Category: aging

  • Copper and gray hair

    Copper and gray hair

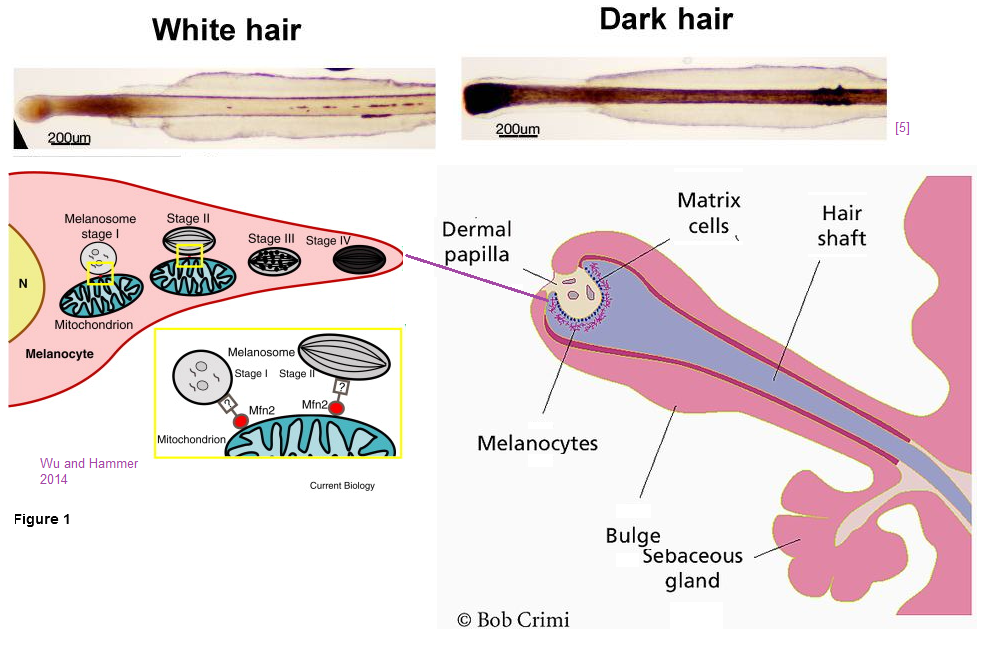
    Melanocyte, the organelles that produce the skin and hair pigment melanin, require ATP generating mitochondria for their maturation. Mitofusin (Mfn) 2, the protein that allows mitochondria to fuse to the endoplasmic reticulum, is also found in the melanosome-mitochondrion contacts according to this 2014 electron microscope study. [1] The featured image of this post illustrates this fusion. These mitochondria contacts were found to be associated to the melanogenesis process. This study also demonstrated that pharmacological inhibition of mitochondrial ATP synthesis reduced not only the contact formation and impairs melanosome biogenesis. [1] The same year Wu and Hammer published a nice lay summary of this discovery. [2] The featured image is a truncated version of their Figure 1. [2]

    Just as Wu and Hammer [2] published a short introduction to the Daniele 2014 TEM study [1] Philpott [3] gave a few interesting introductory insights into a new technique of watching hair turn gray [5].

    Hair follicles are the “mini-organs” that produce hair shafts. The three stages are as follows:

    1. Anagen, a period of active growth. This stage requires a lot of ATP and functioning mitochondria. It is during this phase that melanin production is turned on and off in a more plastic fashion than previously thought, [4,5]
    2. Catagen, a period of regression
    3. Telogen, a period of rest,

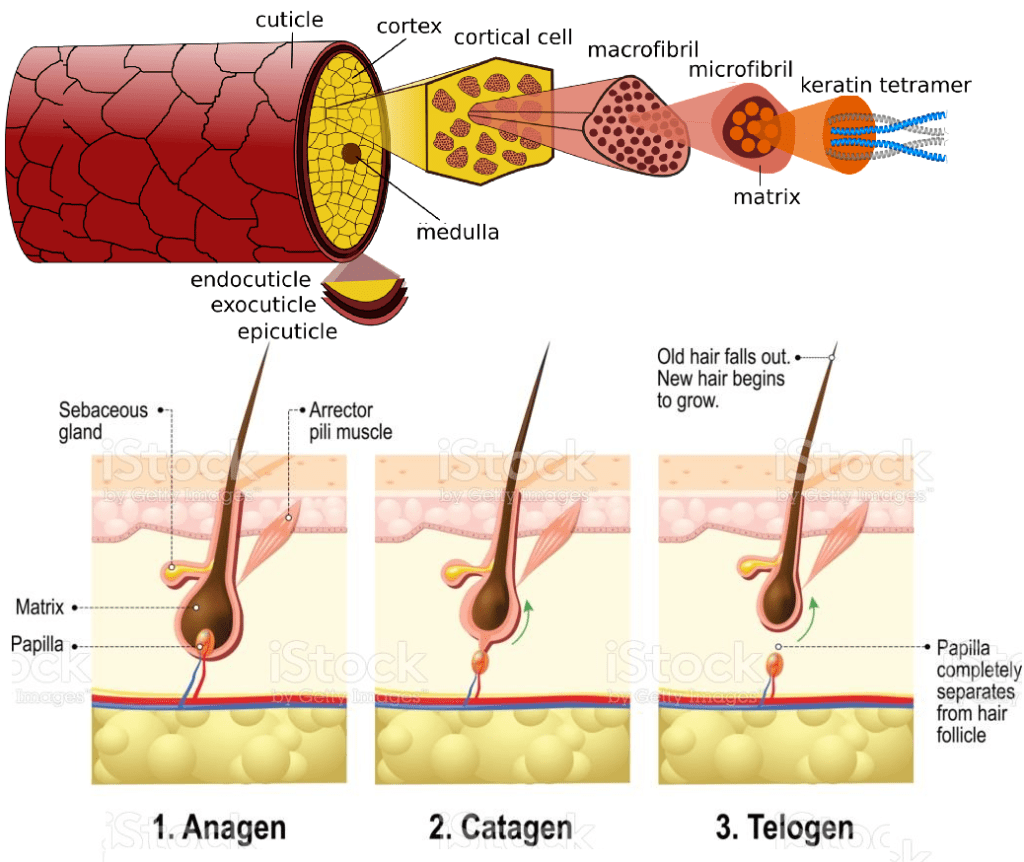
    This image is a combination of a stock photo and the anatomy of a hair follicle from the Cruz review that we will com back to. [4] According to Philpott’s review of the literature, this cycle can last for as little as three months in eyebrow hair or as long as several years for scalp hair. [3]

    Recent advances in hair follicle imaging and correlation of proteins therein have left us with the imagery that hair follicles are like tree rings with snap shots with what we might have been experiencing at the time.[4] Conventional wisdom states that stress can cause pigmented hair to turn white. White hairs can also regain their pigmentation. [4,3]

    The proteomics of white and dark hair shafts

    The Rosenberg study utilized two different protomics techniques in two different laboratories. Both techniques used 1 cm lengths of hair follicles. Both used the proteolytic enzyme trypsin to digest the hair proteins into peptides that were “sequenced” with two different mass spectrometry techniques. These sequences were used to search databases in order to identify the proteins within the hair samples.

    Experiment 1: matched dark and white hairs collected at the same time from two closely age- and diet-matched individuals (one female and one male, both 35 years old, each dark and white HS measured twice, total n = 8)
    Experiment 2 (validation): n = 17 hair segments from seven different individuals (four females and three males).

    These figures are “Volcano Plots” that give us snap shots of significant changes in proteins. The higher the position of the dot, the more likely the protein is to be significantly more or less in white versus dark hairs. Note that we have a lot of mitochondria proteins (red dots) on the right hand “more in white hairs” side of the plots.

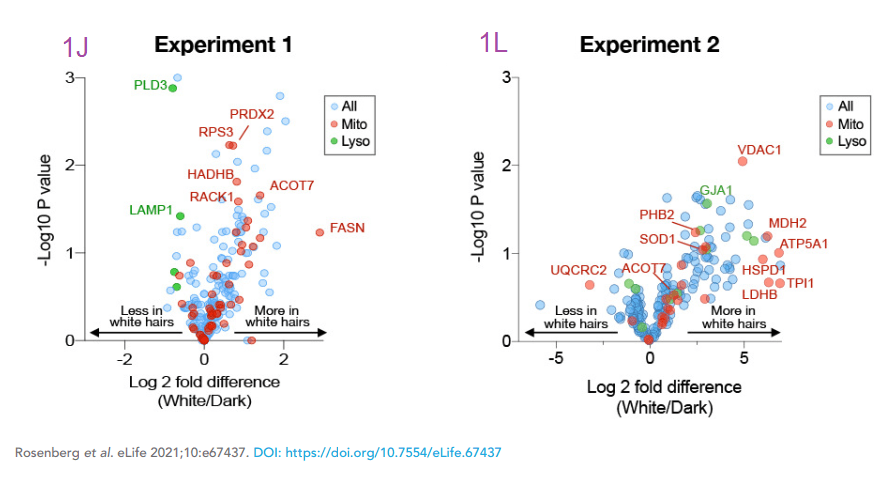
    The next step is to look for proteins that are up and down regulated in both of these two rather diverse experiments.

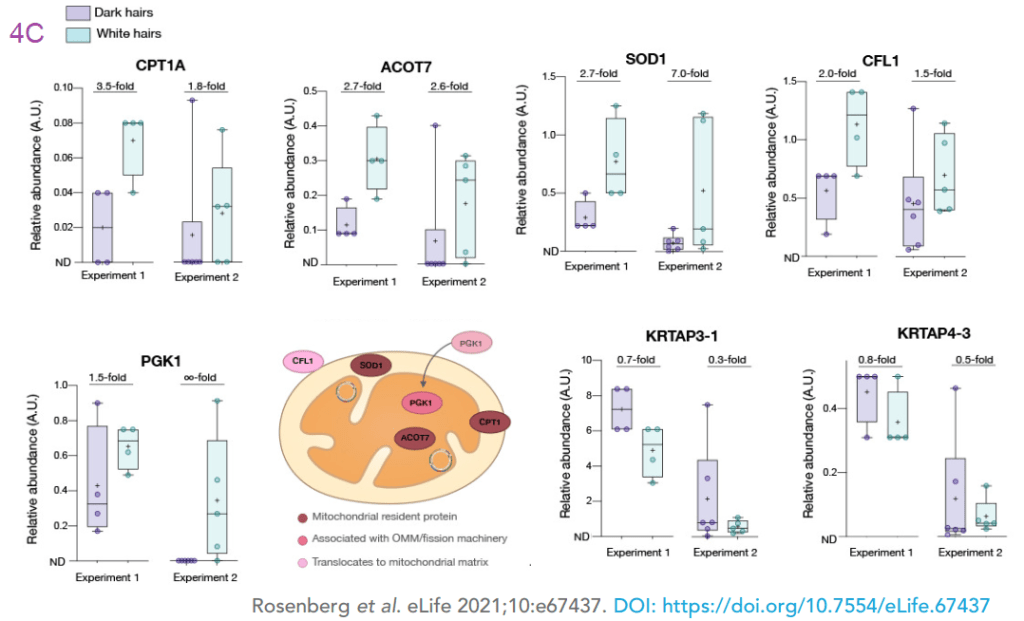
    1. CPT1A, Carnitine O-palmitoyltransferase catalyzes the transfer of the acyl group of long-chain fatty acid-CoA conjugates onto carnitine, an essential step for the mitochondrial uptake of long-chain fatty acids and their subsequent beta-oxidation in the mitochondrion
    2. ACOT7 Cytosolic acyl coenzyme A thioester hydrolase catalyzes the hydrolysis of acyl-CoAs into free fatty acids and coenzyme A (CoASH), regulating their respective intracellular levels.
    3. SOD1 Superoxide dismutase [Cu-Zn] Destroys (super oxide) radicals which are normally produced within the cells and which are toxic to biological systems.
    4. CFL1 Cofilin binds to F-actin and exhibits pH-sensitive F-actin depolymerizing activity.
    5. PGK1 phosphoglycerate kinase catalyzes one of the two ATP producing reactions in the glycolytic pathway via the reversible conversion of 1,3-diphosphoglycerate to 3-phosphoglycerate.
    6. KRTAP3-1 Keratin associated protein 3-1…In the hair cortex, hair keratin intermediate filaments are embedded in an interfilamentous matrix, consisting of hair keratin-associated proteins (KRTAP), which are essential for the formation of a rigid and resistant hair shaft through their extensive disulfide bond cross-linking with abundant cysteine residues of hair keratins. The matrix proteins include the high-sulfur and high-glycine-tyrosine keratins.
    7. KRTAP4-3 Keratin associated protein 4-3…In the hair cortex, hair keratin intermediate filaments are embedded in an interfilamentous matrix, consisting of hair keratin-associated proteins (KRTAP), which are essential for the formation of a rigid and resistant hair shaft through their extensive disulfide bond cross-linking with abundant cysteine residues of hair keratins. The matrix proteins include the high-sulfur and high-glycine-tyrosine keratins.

    Wait, this makes no sense!

    You may be asking yourself why increased levels of Cu/Zn SOD1, generally considered a good thing, be associated with hair going white, generally considered a bad thing. The answer may be found in the Wiriyasermkul 2020 review on ion transporters in melanosomes. [6]

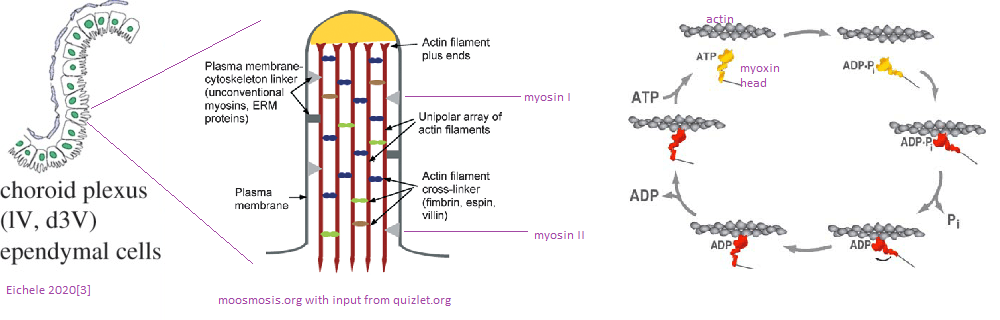
    These are some images from the Wiriyasermkul 2020 review.

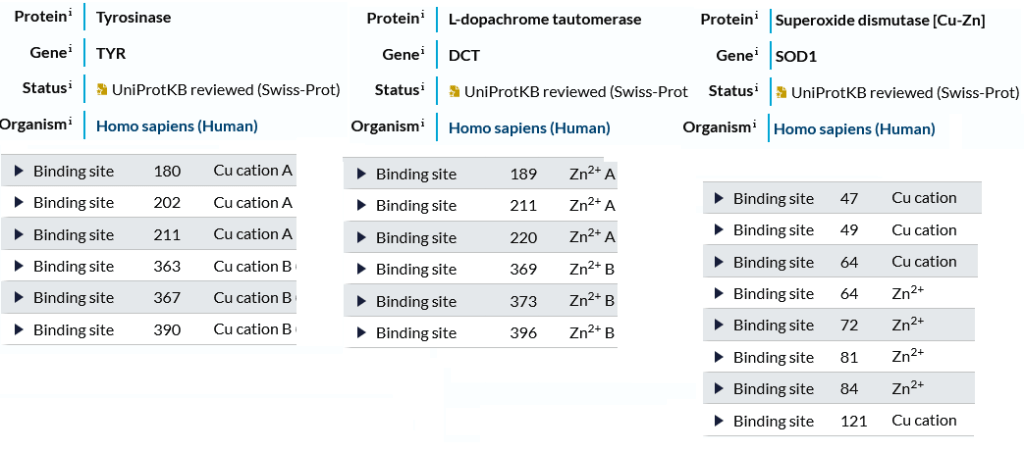
    UniProt as some additional things to say about these copper and zinc enzymes.

    • Tyrosinase: “In addition to hydroxylating tyrosine to DOPA (3,4-dihydroxyphenylalanine), also catalyzes the oxidation of DOPA to DOPA-quinone, and possibly the oxidation of DHI (5,6-dihydroxyindole) to indole-5,6 quinone (PubMed:28661582).
    • L-dopachrome tautomerase TYRP2.:..”Plays a role in melanin biosynthesis (PubMed:33100333). Catalyzes the conversion of L-dopachrome into 5,6-dihydroxyindole-2-carboxylic acid (DHICA)”

    The following are screen shots from the UniProt.org website illustrating the requirement of Cu and Zn for TYR and TYRP2, respectively. Both proteins contain two Cu/Zn per subunit. The Zn vs. Cu requirement of TYP1 is a little more ambiguous. The interesting thing is that mutations in both the TYR and TYRP2 genes are associated with albinism.

    Hypothesis: how Cu cures white hair

    Melanin production enzymes require Cu and Zn. SOD1 also requires Cu and Zn to function. Perhaps, in hair follicles, under conditions of stress, more SOD1 is produced that competes with TYR and DCT for Cu and Zn, respectively. That Cu supplementation cures white hair might simply be a matter of relative availability of Cu versus Zn.

    We don’t know why stress that is associated with white hair [4] might increase certain mitochondria proteins. The Cruz review on hair have very little to say about the keratin associated proteins. [5] The Cruz review does mention growth factors, cytokines, hormones, and neurotransmitters as factors controlling hair cycling. [5] Surely these factors have the potential to also control the expression of the proteins in the Rosenberg study. [4] More mitochondria proteins and Cu/Zn SOD1 could be argued to be a good thing during times of stress that produce white hair. Do we also argue that the aging process is itself a source of stress? During these high stress times, could supplying Cu and/or Zn to Cu/Zn SOD1 reduce the Cu and/or Zn getting to the enzymes responsible for melanin synthesis?

    References

    1. Daniele T, Hurbain I, Vago R, Casari G, Raposo G, Tacchetti C, Schiaffino MV. Mitochondria and melanosomes establish physical contacts modulated by Mfn2 and involved in organelle biogenesis. Curr Biol. 2014 Feb 17;24(4):393-403. free article
    2. Wu X, Hammer JA. Organelle interactions: melanosomes and mitochondria get cozy. Curr Biol. 2014 Mar 17;24(6):R240-2. free article
    3. Philpott MP. Watching hair turn grey. Elife. 2021 Jun 30;10:e70584. PMC free article
    4. Rosenberg AM, Rausser S, Ren J, Mosharov EV, Sturm G, Ogden RT, Patel P, Kumar Soni R, Lacefield C, Tobin DJ, Paus R, Picard M. Quantitative mapping of human hair greying and reversal in relation to life stress. Elife. 2021 Jun 22;10:e67437. PMC free article
    5. Cruz CF, Costa C, Gomes AC, Matamá T, Cavaco-Paulo A. Human Hair and the Impact of Cosmetic Procedures: A Review on Cleansing and Shape-Modulating Cosmetics. Cosmetics. 2016; 3(3):26. free article
    6. Wiriyasermkul P, Moriyama S, Nagamori S. Membrane transport proteins in melanosomes: Regulation of ions for pigmentation. Biochim Biophys Acta Biomembr. 2020 Dec 1;1862(12):183318. PMC free article
  • In defense of Dr Brewer

    This post is refuting an attack on Dr George Brewer who joined us in proclaiming the need for CopperOne. Dr Brewer claimed that small amounts of Cu2+ in our drinking water may contribute to Alzheimer’s Disease. This post asking if copper is safe for seniors critically examines the claims of Dr George Brewer.

    The featured positron emission tomatography (PET) study loaded the blood mice with 64Cu2+ acetate a cell permeable Cu+ chelaate and monitored its distribution over a 24 hour period. They loaded some TASTPM mice engineered with gene mutations associated with early onset Alzheimer’s Disease. [1] Towards the end, the special TASTPM mouse Alzheimer’s Disease model and copper’s role in amyloids will be discussed.

    Argument against Dr Brewer

    Point 1. This post has nothing to say about the cost. This post will review 2022 literature on the link between copper II Cu2+ and Alzheimer’s Disease so that the reader will understand the cost more.

    Point 2. Their hypothesis:

    At the Mitosynergy product page above is a link to what they claim is the science behind their product:

    https://mitosynergy.com/wp-content/uploads/2016/11/AnalysisOfTheNeedForACopper-1SupplementPill_11_04_16.pdf

    by George J Brewer

    A similar article by George Brewer can be found here:
    https://www.scientia.global/professor-george-brewer-how-to-avoid-alzheimers-disease/

    “I refuted at least two of these “anti copper” studies in my book. First, 0.12 ppm copper in water is the same as 0.12 mg/Liter. It’s not copper to blame, it’s clearly copper deficiency. It is not nearly enough copper to be toxic.

    In the second study, it’s 3 mg of copper. Paired with known neurotoxic bad fats, and a diet very high in those bad fats. Again, not enough copper to be toxic, but the copper does help our bodies turn fats into the myelin sheath around the nerves, which is why, even in our Facebook group’s description, at https://www.facebook.com/groups/thecopperrevolution”

    Interesting points, Jason Hommel. Let’s explore where this Cu2+ was found to accumulate.

    Prelude: ventricles and copper

    As we shall discuss, Cu2+ becomes deposited in the ventricles of the brains of normal middle aged and old mice. [1] Since at least 1988 we have known that the ciliated ependymal cells of the ventricles contain actin and myosin. [2] Skeletal muscle isoforms of actin and myosin are responsible for movement of those muscles. Likewise, these ciliated cells are absolutely required for moving cerebral spinal fluid about the brain. [3] Myosin hydrolysis of ATP is required for such movement. ATP is most efficiently produced by the electron transport chain of the the mitochondria. In Alzheimer’s disease, a decrease in expression of complex IV genes COX6A1, COX6C, COX11, SOD1, ATOX1, COX5B, COX6B1, and COX7B has been observed. [4] A decrease in transcripts for Cu/Zn super oxide dismutase 1 and copper chaperone Atox1 were also observed. [4]

    A prelude to the Andreozzi (2020) 64Cu neuro imaging study. [1] who found Cu2+ deposition in the ventricles. The choroid plexus is a specialized component of ventricles with ciliated ependymal cells. These cilia contain actin, myosin, and many actin cross-linking proteins. Non muscle myosin can move these actin bundles in the cilia by hydrolyzing ATP.

    If we do not have enough proper copper in our diets, we could hypothetically not have enough to ATP to fuel the intense ventricular circulation dynamics reviewed in reference [3]. In this model we are proposing, not enough of the good copper Cu+ can lead to accumulation of the bad Cu2+ before it has a chance to be reduced to the good Cu+. With that introductory prelude, let us examine a PET imaging study of Cu2+ acetate in a mouse model.

    Brain imaging of 64Cu

    1. Like Cu2+ from pipes and cell membrane permeable Cu+/2+

    The goal was to directly inject two forms of Cu(II) into the blood: one in a GTSM chelate that can cross the blood brain barrier and one that might resemble a dietary supplement. [1]

    Cu-GTSM is sufficiently lipophilic to penetrate the blood-brain barrier22,23 and cell membranes, but has a relatively high Cu(II/I) redox potential which facilitates extremely rapid intracellular bioreduction and dissociation to release copper within cells,

    The authors are trying to load the mice with two types of copper. (1) copper pipes copper and (2) copper in the mostly proper oxidation state with a lipophilic carrier that can cross the blood brain barrier.

    2. Cu2+ exit from blood

    Both copper compounds were IV injected in the tail veins as opposed to feeding.  Radioactivity was measured over the course of 60 minutes.   The radioactivity in the blood was expressed in terms of the ratio of counts per minute (cpm) to the MBq injected.  (n = 3 )  1 Bq = 1 decay per second. Initial clearance of Cu-GTSM is very rapid with half life < 1 min, whereas Cu-acetate had a slower initial clearance half life of 2-3 min. [1]  

    Figure 1 from Andreozzi (2020) [1]

    The cupric acetate seems to be higher in the blood. Was this due to slower deposition into disposition into tissues or quicker excretion in feces and urine for the GTSM-Cu? This is addressed in Figure 3 at 30 minutes. Note the increased signal from the intestines and kidney.

    3. Improper copper gets peed out?

    These are the wildtype C57BL/6J mice after injection with the two forms of 64Cu. Both forms are rapidly taken up by the liver, intestines, and kidneys. Is the presence in the liver and kidneys evidence of being excreted? The GTSM chelate is also taken up into the brain, heart, lungs, and adrenal glands. The color scale is linear, covering the range 0-1 %ID/mL (min) to 40 %ID/mL (max).

    Figure 3 Andreozzi 2020 [1] The brain images have been enlarged.

    Some enlarged views of sagittal brain sections are shown. The brain (B) and spinal cord(Sp) rapidly accumulate 64Cu from the chelate.

    The heat, lung, and brain are the biggest difference between the cupric acetate and GTSM, that tends towards the Cu(I) oxidation state.  The brain seems to unload the accumulated Cu from 30 minutes to   Why the difference between the brain and heart at 24 hours (p<0.001) at 24 hours is so important was not really elucidated.   The 30 minute accumulation at 30 minutes is lost by 24 hours.  Not so in the brain. 

    Supplemental Fig 3, These mice are 6-8 months old wildtype mice, relatively young. Data are mean ± SD. 64Cuacetate (n=4); 64Cu-GTSM(n=6+

    With the unnaturalGTSM Cu(I) chelate, the Cu peaks and then drops dramatically in most organs other than the brain, spine, and kidney over the course of 24 hours.

    4. Copper getting stuck in the brain and spine

    The supplemental data included individual mouse data from 30 minutes and 24 hours. These again are youngish 6-8 month old wild type mice.

    values are expressed as % of the initial dose green , Cu-acetate, blue, Cu-GTSM, *** p<0.001

    The authors took a closer look at Cu2+ acetate in 6-8 month old mice and some very old 13-15 month old mice. [1] While they only looked at three very old wild type mice, one individual had a slight increase in brain Cu over 24 hours. We can make no statistical conclusions from such a small group. This is sort of what Dr Brewer was saying that Cu2+ might just accumulate very slowly in small amounts as we age. Note also that there is greater population variation in the older versus younger group of wildtype mice.

    Individual mouse data from supplemental figure 7 for copper acetate [1]

    This table breaks down the 64Cu content by brain region

    Eichelle (2019) [3] was the source of the rodent brain ventricle system. Note that the d3 ventricle and choroid plexis line up with regions in which Cu content is increased with Cu2+. The choroid plexis produces cerebral spinal fluid and serves as a barrier between the blood and the cerebral spinal fluid in the ventricles

    “Fig. S5. (a) Left: One-way ANOVA analyses of %ID/g (including Dunnett’s multiple comparison post-hoc tests) confirm significantly lower %ID/g in the midbrain vs. whole brain (p-value <0.01, F=13.39) and significantly higher%ID/g in the ventricles vs. whole brain (p-value <0.001, F=13.39) for 64 Cu acetate at 30 min; Right: the same analysis at 24 h, showing significantly higher %ID/g in the hypothalamus (p-value <0.0001, F=41.29), olfactory bulb(p-value <0.0001, F=41.29), white matter (p-value <0.001, F=41.29), and ventricles (p-value <0.0001, F=41.29) vs. whole brain at 24 h. Data are mean(n=4) ± SD, with %ID/g resulting from the InviCRO brain atlas applied to the PET datasets. (b) A one-way ANOVA with Dunnett’s multiple comparisonpost-hoc tests for 64 Cu-GTSM confirms no differences of %ID/g in any of the individual brain regions compared to whole brain. Data are mean (n=6)±SD,with %ID/g resulting from the InviCRO brain atlas applied to the PET datasets.One-way ANOVA analyses of %ID/mL (including Dunnett’s multiple comparison post-hoc tests) confirm significantly lower %ID/mL in the midbrain vs. whole brain (p-value <0.01, F=13.39) and significantly higher %ID/g in the ventricles vs. whole brain (p-value <0.001, F=13.39) for 64 Cu-acetate at 30 min; the same analysis and significantly higher %ID/g in the hypothalamus (“

    And there was really not a great deal of difference in the Alzheimer’s Disease model

    Figure 7 Andreozzi 2020 [1]

    TASTPMouse

    This Adreozzi study [1] also used what is known as a TASTPM mouse model of human Alzheimer’s Disease. [1] This particular mouse like carries two different sets of mutations linked to early onset Alzheimer’s Disease in humans.

    1. The “Swedish” mutation in the APP gene is two mutations K595A and M596L that increases cleavage by β-secretases
    2. An M146V substitution in the presenilin gene. According to alzforum.org, this mutation impaired γ-cleavage carboxypeptidase like activity but spared the endopeptidase ε-cleavage.  This results in increased Aβ1-42 compared to Aβ1-42    

    The Tougu (2011) kinetic study [2] offered some insight into the role of divalent metal ions in promoting the aggregation of the Aβ peptides and the histidines therein.  Their figure 1 puts into context the role of secretases and the differences between proteolytic cleavage products.  Figure 2 has the metal binding histidines in bold red letting us know that the proteases really make a difference. [2] Figure 3 shows the different pathways to aggregates that generate reactive oxygen species in the presence of ascorbate and the H2O2 that seems to be the byproduct of incomplete reduction of O2 by the mitochondria.

    There have been other reports claiming Cu2+ detection by one means or another. [3-5] The Tougu Figure 3 reminds us that Cu2+ and Cu+ redox cycle with ascorbate and H2O2 to produce hydroxyl radicals.

    Expansion of Fenton chemistry eluded to in Tougu (2011) Figure 3.

    In Alzheimer’s Disease, there is a decrease in the transcripts for many of the subunits of the copper cofactor mitochondrial complex IV.  Transcripts for Cu/Zn SOD1 and the copper bound transcription factor and chaperone Atox1 are also decreased.  These changes are accompanied by a decrease in Cu, a decrease in cytochrome C oxidase activity, and of course a decrease in ATP production. [6]

    Going forward..

    The GTSM mostly Cu+ is unnatural by nature of its cell permeability and therefore not of interest to us.

    1. Can we detect impaired mitochondrial function in the aging brain?
    2. Does Cu(I)NA2 improve CSF circulation within the brain?
    3. Is Cu2+ less likely to form aggregates withAβ if CSF is moving freely and not stagnating?

    The Andreozzi study was performed over only 24 hours. What about dietary Cu2+ over the course of several decards?

    References

    1. Andreozzi, E. M., Torres, J. B., Sunassee, K., Dunn, J., Walker-Samuel, S., Szanda, I., & Blower, P. J. (2017). Studies of copper trafficking in a mouse model of Alzheimer’s disease by positron emission tomography: comparison of 64Cu acetate and 64CuGTSM. PMC free article
    2. C, Ghandour MS, Paulin D, Assenmacher I, Tixier-Vidal A. Characterization of ependymal cells in hypothalamic and choroidal primary cultures. Neuroscience. 1988 Mar;24(3):993-1007
    3. Eichele, G., Bodenschatz, E., Ditte, Z., Günther, A. K., Kapoor, S., Wang, Y., & Westendorf, C. (2020). Cilia-driven flows in the brain third ventricle. Philosophical transactions of the Royal Society of London. Series B, Biological sciences, 375(1792), 20190154. PMC free article
    4. Myhre, O., Utkilen, H., Duale, N., Brunborg, G., & Hofer, T. (2013). Metal dyshomeostasis and inflammation in Alzheimer’s and Parkinson’s diseases: possible impact of environmental exposures. Oxidative medicine and cellular longevity, 2013, 726954. PMC free article
    5. Tõugu V, Tiiman A, Palumaa P. (2011)Interactions of Zn(II) and Cu(II) ions with Alzheimer’s amyloid-beta peptide. Metal ion binding, contribution to fibrillization and toxicity. Metallomics. 2011 Mar;3(3):250-61. free article
  • Modulating CD8+ T cell activity

    Modulating CD8+ T cell activity

    We tend to accept that our cancer risks increase as we age. In introductory remarks on an exciting new landmark paper Li and coauthors were commenting on the fate of poor CD8+ T cells in the center of tumor micro environment (TME). CD8+ cytotoxic T cells are antigen specific recognizing antigens from tumors, virus infected cells, and normal cell. CD8+ is a protein that binds to the constant chain of the MHC1 antigen presenting surface protein. Recognizing normal cells is considered an act of autoimmunity. When exposed to infected/dysfunctional somatic cells, CD8+ T cells release the cytotoxins perforin, granzymes, and granulysin, enzymes that activate the caspase protease cascade eventually leading to programmed cell death. Human Cell Bio. Not only are the T cells constantly exposed to antigen that sets them off, but they are also competing with the tumor for oxygen. [1] Naturally reactive oxygen species are part of the TME. [2] According to Healthline, age is not one of the risk factors for autoimmune diseases. In autoimmunity CD8+ T cells are also constantly exposed to self antigen. [3] It is desirable that they become exhausted and less self- reactive. Both of these featured studies used T cells from mice that are allergic to an egg protein ovalbumin. These dual roles of CD8+ T cells was addressed in a review by Collier and coauthors. [4]. This post will not get into the PD1/PDL1 checkpoint inhibitors that have been discussed elsewhere on this site. We have covered the inner-relationship between NADH/NADPH (derived from niacin) and reduced thiols. This post examines the possibility that cuprous niacin could find the happy middle ground between T cell exhaustion in cancer and viral infections and autoimmunity, both of these may be issues as we age. Perhaps age is not an autoimmune disease risk factor, but surely contributes to the symptoms.

    1. Tales from the tumor micro environment [2]
      1. Figure 1, an increase in glycolysis
      2. Fig 2 less O2 reduction and ATP production with chronic stimulation
      3. Figure 3 mitochondria inhibition and T cell proliferation (not shown)
      4. reactive oxygen species and reduced thiol supplementation
    2. Nicotinamide slowing down CD8+OT-I T cells? [3]
      1. Figures 1 and 2 Turning on cytokine production, or not…
      2. Figure 3 Some Sea Horse experiments
    3. Concluding thoughts
    4. References

    Polyclonal CD8+ T cells, T cells were isolated from the spleen and inguinal lymph nodes of C57BL/6 mice. T cells were also isolated from OT-I mice. These mice contain transgenic inserts for mouse Tcra-V2 and Tcrb-V5 genes. The transgenic T cell receptor was designed to recognize ovalbumin peptide residues 257-264 (OVA257-264) in the context of H2Kb (CD8 co-receptor interaction with MHC class I). The take home is that chronically stimulated T cells, by tumor antigens or ovalbumin, leads to impaired mitochondrial function and more reactive oxygen species generation. Both copper and niacin have the potential to improve this situation.

    OT-I transgenic T cells, following 48 h of stimulation were co-cultured with B16-F10 melanoma cells that had been treated with IFN-γ to induce MHC-I expression. Chronically stimulated T cells were treated with mitochondrial electron transport chain complex inhibitors to test the response to oxygen consumption.

    This results in MHC class I-restricted, ovalbumin specific, CD8+ T cells (OT-I cells). That is, the CD8 T cells of this mouse primarily recognize OVA257-264 when presented by the MHC I molecule. Cells were cultured in the presence of 1 μM of SIINFEKL peptide, a peptide from ovalbumin. The melanoma cells supplied the MHC class I to present the transgenic T cells with their ovalbumin peptide. Vardhana used B16-F10, B16-OVA, EL4, and A20 meleanoma cell lines. An interesting nuance is that they added 50 μM of the reducing agent β-mercaptoethanol (β-ME).

    In the melanoma cells, 1 ng/mL IFN-γ was to induce MHC-I expression. IL-2, 10 ng/mL, was also added with (chronic) or without (acute) 1 μM SIINFEKL. T cells were passaged into fresh co-cultures every 48 h until eight days following initial stimulation with the peptide.

    From Vardhana (2020) figure 1
    • In Figure 1a we see the same story: The more PD-1 on the cell surface, the less TNF in vesicles. It is the chronically stimulated cells that have the most PD-1. Skipping some flow cytometry data….
    • Panel d, The chronically stimulated T cells consume much more glucose than the T cells only stimulated once with the ovalbumin peptide. This glucose could be for glycolysis only or glycolysis plus OxPhos.
    • Panel e shows an increase in lactate production indicating that glucose consumption is probably not going towards OxPhos.
    • Panel f demonstrates that the extracellular acidification rate (ECAR) is increased when both the chronic and the acute stimulated T cells are stimulated with CD3 antibodies. The acute stimulation cells acidify more in the presence of electron transport chain blockers. And finally,
    • panel g, the acute stimulation T cells divide almost 4x as fast as those chronically stimulated with the ovalbumin peptide .

    Vardhala also used radioactive glucose to measure TCA cycle activity in these T cells (panels d-f not shown).. Some of the nucleotide ratios are not being shown in this post in effort to keep the narrative simple. It is just impossible to do this public access publication justice in a single post.

    select panels from Vardana (2021) figure 2 [2] P values were calculated by unpaired, two-sided Student’s t-test (a-c,e-f) or unpaired, two-sided Student’s t-test test with Benjamini-Hochberg False Discovery Rate (FDR) correction (i). Data are presented as the mean ± s.d. of n=5 (a), n=8 (a,c), n=4 (b), or n=3 i) biologically independent samples from a representative experiment. *P<0.05, **P<0.01, ****P<0.0001. Please see the original publicaton for complete data

    They saw a decrease in all intermediates in the TCA cycle. [2] Triphosphate and monophosphate nucleotide ratios were also reduced in the chronic stimulated T cells compared to the one time only acute stimulated cells. [2] Panel i from the chronic model documents that he problem gets worse with time.

    Cu(I)NA2 is predicted to supply Cu/Zn SOD with the necessary cofactor to mitigate the ROS generation as well as keep the flow of electrons through through the electron transport chain. Both of these should increase the ATP/AMP ratio as well as decrease the NADH/NAD+ ratios.

    Data are presented as the mean ± s.d. of n=3 (a,e,f) or n=5 (c) biologically independent samples from a representative experiment. **P<0.01, ****P<0.0001 MFI, mean fluorescence units.
    • Panel a Mitotracker green is simply a fluorescent indicator there to measure mitochondria size irrespective of activity. These mitochondria might be undergoing a vain attempt to expand and keep up with demand.
    • panel b This is a Western blot. The black bands are proteins. There does not appear to b a huge difference in protein amounts of various complex proteins.
    • panel c This is something we might want to copy. A smaller NADH/NAD+ ratio in the acute T cells that were not over exposed to peptide suggest better functioning mitochondria.
    • Panel d examines the total and mitochondrial reactive oxygen species upon stimulation. The gray shaded trace is the unstimulated reference.
    • Panel e Various inhibitors of electron transport chain complexes were used to mimic he effect of chronic stimulation: complex I (rotenone), complex V (oligomycin),Fe-S cluster containing complexes, cobalt chloride (CoCl2),

    The rest of the Vardhana publication addressed the issue that the real root of reduced T cell proliferation was due to ROS generation rather than impaired mitochondria activity.

    Agliano, Federica et al. “Nicotinamide breaks effector CD8 T cell responses by targeting mTOR signaling [3] graphical abstract and a cartoon of mTOR signaling. AMP kinase (AMPK) is activated when ATP/energy levels are low.

    The next paper tests the hypothesis that nicotinamide can shut down over responsive CD8+ T effector cells. [3] Just as a warning, this is the exact opposite of T cell exhaustion. The paper makes use of the OT-I mice genetically engineered to think that the ovalbumin egg protein is a virus. These authors introduced us to the mammalian target of Rapamycin, or mTOR. mTOR integrates all sorts of signals from everywhere and gives the cell permission to start translating mRNAs into proteins. Ribosomal S6 kinase is a target of mTOR. This kinase promotes translation of mRNAs. Note that increases in the ratios of ADP to ATP tend to turn mTOR off and sufficient nutrients tend to turn it on. These authors used the Sea Horse to measure extracellular acidification rate, i.e. glycolysis without the TCA cycle and electron transport chain. [3]

    Naïve CD3+, CD4+, CD8+ T cells from spleen and lymph nodes from C57BL/6J mice were purified and differentiated using a commercial kit with added 30 mM or 10 mM NAM or the solution used to dissolve the NAM. Final activation was with CD3/CD28 or PMA + ionomicyn (PMAi), a combo used to stimulate T cell activation, proliferation, and cytokine production. The authors saw differences in cytokine production, but by their own admission, used an surrealistically high concentration of NAM in their cell culture experiments. [3] Not getting into the specifics, the reason has to do with mTOR.

    Let us continue with the Agliano [3] publication, which also used T cells from OT-I mice. Recall that these cells were engineered to react with the ovalbumin peptide provided that it is presented via MHC1 surface proteins.

    • Panel A the general protocol. They are activating the T cells with the peptide, phorbol ester, or a bunch of cytokines.
    • Panels Band C Nicotinamide only slows down production of INFγ in response to the peptide, but not the phorbol ester plus ionomycin Ca2+ ionophore. PMA activates protein kinase C. ionomycin pokes Ca2+ permeable holes in cell membranes. This is sort of a double whammy way of activating T cells. Panel D examined response to interleukins.
    • Panel E. Here Angliano and coauthors are comparing 10 mM nicotinamide (NAM) and the solution (vehicle) used to dissolve NAM. When glucose (gluc) is added the cell culture medium starts acidifying. Adding the ATP synthase inhibitor oligomysin (Olig.) does nothing. At 122 g per mole, an average human male with 5 liters of blood would have to consume about 6.1 g of nicotinamide to theoretically achieve this concentration.
    • Panel F The large extracellular concentrations of nicotinamide are increasing the intracellular concentrations of NAD+.
    • Panel G used only 1 mM NAD+. Consuming 0.6 g of NAD+ probably won’t happen either.
    • Panel H, FK866 is a highly specific noncompetitive inhibitor of nicotinamide phospho ribosyltransferase . The authors presented another narrative suggesting that the large doses of niotininamide were slowing the translation of cytokine transcripts via phospho-AMP kinase pathways involving mTOR. [3]

    Figure 4 demonstrates that NAM down regulates mTORC1 independently of NAD+. [3] Figures 5 and 6 looked at the effect of NAM on human T effector cells. This post is not going to get into this part of the study.

    The Vardhana paper made the cause for CD8+ T cell exhaustion being tied to reactive oxygen species and proposed use of reduced thiol supplements like N-acetyl cysteine. [2] We’d like to point out that (1) copper is a cofactor for Cu/Zn superoxide dismutase and (2) niacin is a precursor for NADH/NADPH. NADPH, in particular, plays a role in keeping thiols reduced. The Agliano paper made the case niacin’s close relative nicotinamide, being a good treatment autoimmune diseases when CD8+ T cells become cytotoxic against self, i.e. autoimmunity. [3] This site is in not way making any claims to treat disease. That cuprous niacin could treat two opposite ends of immune dysregulation would be an audacious claim and perhaps a worthy hypothesis to test!

    1. Li W, Cheng H, Li G, Zhang L. Mitochondrial Damage and the Road to Exhaustion. Cell Metab. 2020 Dec 1;32(6):905-907. free article
    2. Vardhana, S. A., Hwee, M. A., Berisa, M., Wells, D. K., Yost, K. E., King, B., Smith, M., Herrera, P. S., Chang, H. Y., Satpathy, A. T., van den Brink, M., Cross, J. R., & Thompson, C. B. (2020). Impaired mitochondrial oxidative phosphorylation limits the self-renewal of T cells exposed to persistent antigen. Nature immunology, 21(9), 1022–1033. PMC free article
    3. Agliano, Federica et al. “Nicotinamide breaks effector CD8 T cell responses by targeting mTOR signaling.” iScience vol. 25,3 103932. 15 Feb. 2022, free article
    4. Collier JL, Weiss SA, Pauken KE, Sen DR, Sharpe AH. Not-so-opposite ends of the spectrum: CD8+ T cell dysfunction across chronic infection, cancer and autoimmunity. Nat Immunol. 2021 Jul;22(7):809-819. PMC free article
  • Mitochondria and T cell exhaustion

    Why do the elderly get sick more than younger folks? Fight Aging has a good lay friendly piece on the mitochondrial aspects of T cell exhaustion. The following paper is cool enough to be published in the prestigious journal Cell. The authors found that hypoxia does something bad to the mitochondria that prevents them from producing cytokines needed to keep chronic virus infections contained. We’ve know for a long time that the real damage to cardiac mitochondria occurs when oxygen is restored. The mitochondria turn into superoxide generating machines. We might be done with the pandemic proper, but older folk are still getting Covid, the flu, and so on. Then there is the chicken pox/ shingles virus.

    Schurich A, Pallett LJ, Jajbhay D, Wijngaarden J, Otano I, Gill US, Hansi N, Kennedy PT, Nastouli E, Gilson R, Frezza C, Henson SM, Maini MK. Distinct Metabolic Requirements of Exhausted and Functional Virus-Specific CD8 T Cells in the Same Host. Cell Rep. 2016 Aug 2;16(5):1243-1252. PMC free article

    1. Figure 1. HBV specific CD8+ T Cells express more Glut 1
    2. Niacin and the role of NADH/NAD+
    3. Figure 2. CD8+ T Cells may become hypoxic in the liver.
    4. Figure 3 HBV T cells, glycolysis, “immediate effector function”
      1. MitoTracker stains healthy and unhealthy mitochondria
      2. JC-1 measures membrane potential of healthy mitochondria.
    5. Figure 4 IL-12 for exhausted T cells not producing IFNγ?
    6. Cu(I)NA2 comes to the rescue
    7. Conclusion

    This publication asked the question of why we humans might have some chronic virus infections like cytomegalovirus that are usually well contained and generally harmless. Others, like hepatitis B virus, are far from harmless. The above publication compared CMV and HBV specific T cells from the same patients. The lay reader not particularly intersected in scientific experiments is encouraged to just glance at the images to take in the hard work that goes into understanding out our bodies work.

    The graphical abstract of Schurich 2016 has been embellished to demonstrate the role of IL-12 in increasing transcription of interferon gamma.

    The patients in this study had both CMV and HBV reactive T cells. Peripheral blood mononuclear cells (PBMC) were isolated from patients positive for HLA-A2+ , one of many variants of the MHC complex of T cell receptors. According to these authors, naïve T cells rely on mitochondrial oxidative phosphorylation of fatty acids. Activated T cells switch to glycolysis as a quicker source of energy even though it is less efficient.

    The authors used fluorescent probe labeled peptides from HP,KLHLYSHPI, from Proimmune. As the affinity of isolated, soluble monomeric MHC-peptide complexes for their specific TCR is weak, and the interaction between the MHC-peptide and associated TCR has a half-life of approximately 10 seconds, multimerization is applied to enhance detection sensitivity. The detection sensitivity increases with the amount of MHC monomers complexed onto a multimer. For enhanced detection sensitivity, the Dextramer® technology holds an optimized number of MHC-peptides that enable efficient and sensitive detection of antigen-specific T cells. Read more about the sensitivity of the Dextramer® reagents here.

    Figure 1. HBV specific CD8+ T Cells express more Glut 1

    The authors are building their case that cytotoxic T cells that express the CD8 marker also express more Glut1 because they are more dependent on glycolysis. Virus specific dextramer was used to activate these T cells into cytokine production. The center histogram graph is perhaps the easiest to understand. The CMV specific CD8+ T cell population has a large number of members that just express a few Glut1 transporters on their cell membranes. The implication is that they are more reliant on fatty acid oxidation and OxPhos to meet their energy needs.

    Comments on Schurich et al (2016) are in purple.

    This post is skipping some of the data in Figure 1. Panel 1E asks the question of whether the Glut1 glucose transporters are actually operational. 2-NBDG is glucose with a fluorescent tag NBD. Not only are more Glut1 on the surface of HBV T cells, but they are also operational.

    Not the almost non-overlapping of CMV and HBV histograms for 2-NMDG uptake in 1E.

    The argument for a copper supplement is that the ATP yield from one molecule is 38 with a copper replete electron transport chain versus 2 ATP from glycolysis alone. The Schurich group has published an excellent review on T cell metabolic requirements in chronic infections. Cholesterol and fatty acid synthesis is needed for T cell proliferation. Fatty acid oxidation was given limited mention. For now we are left with the hypothesis that Glut1 is there because O2 is not available as an electron accept in the electron transport chain. We have to remember that glucose can also be a source of electrons for OxPos ATP production.

    Our programmed death receptor 1 PD-1 in Long Covid journey began in a previous post. A follow up post examined the role of PD-1 andTim-3 in chronic versus acute LCMV infections. These cell surface receptors shut down transcription of genes for fatty acid metabolism. Sometimes we need to remember niacin, the other two thirds of BioCu1/ Copper One.

    This figure is not from Schurich (2016). It is added to illustrate the complexity of NAD+ and ADP/ATP signalling of energy status.

    Figure 2. CD8+ T Cells may become hypoxic in the liver.

    The next figure compares virus killing cytotoxic T cells from peripheral blood mononuclear populations (PBMC) to intrahepatic liquid (IHL). These cells were stimulated with the HBV dextramer. The low affinity binding (box) is really not that much different. The expression of the Glut1 passive glucose transporter is greater at p<0.05 level of confidence. The authors think that the hepatic environment may be hypoxic. If the liver is hypoxic, could the same situation exist in GI epithelial cells and the SARS-Cov2 virus?

    The story continues with PBMC cultured under normoxic and hypoxic conditions. Regardless of the virus specificity, growth in hypoxic conditions increases the expression of Glut1.

    This post makes use of a SeaHorse cartoon illustrating the strategy of gradually adding electron transport chain inhibitors and their use to calculate the spare and maximal respiratory capacity. The spare reserve capacity (SRC) is the maximum O2 consumption minus that which is coupled to ATP production.

    Note that the PD-1+ T cells have some sort of electron transport chain defect between complex I and V.

    Figure 3 HBV T cells, glycolysis, “immediate effector function”

    Part of the reasoning behind these experiments was a previous study that Schurich and coauthors cited suggesting that galactose as a sugar source slows down glycolysis. It probably slows down oxidative phosphorylation (ATP production with reduction of oxygen to water. NADH is reduced to NAD+) and the ETC if fatty acid beta oxidation is not a choice.. If sugars are the only source of energy, there is still the additional step required. Glucose to glucose 6-phosphate is the first step in glycolysis. Galactokinase and Gal-1-P uridyltransferase are an additional two steps that slow down glycolysis, but still permit it.

    The metabolic diagram in the lower right hand corner was added to the original Schurich figure 3A.

    The boxed in areas on the right hand side of the 3A charts are CD8+ T cells that contain a large amount of IFNγ cytokine, presumably in secretory vesicles.  Note that T cells that have receptors for CMV have a tendency to express large amounts of IFNγ whether or not the sugar in the growth medium is glucose or galactose.  Panel 3B puts numbers to go with the flow plots.  The same trend for greater TNF cytokine production is also seen for CMV vs HBV.

    MitoTracker stains healthy and unhealthy mitochondria

    The fluorescent dye MitoTracker stains mitochondria regardless of whether or not they have a resting membrane potential. In some pathologies postulated by the authors, mitochondria may become enlarged. The possibility of mitochondrial proliferation was not discussed but could potentially be detected in this assay.

    In panel D we see a larger population of HBV specific T cells have more MitoTracker dye uptake. Is this pathology or simply a failed attempt to keep up with increased energy demands. When the T cells are activated with HBV dentomers, the difference is lost.

    JC-1 measures membrane potential of healthy mitochondria.

    The JC-1 mitochondrial membrane potential dye was used to look at functionality.

    When the membrane potential is inside negative, JC-1 enters the healthy mitochondria and aggregates in such a way to yield red fluorescence. In HBV virus specific T cells, cells with 50/50 green/red fluorescence predominate, 63.2 %. In CMV specific cells.

    Figure 4 IL-12 for exhausted T cells not producing IFNγ?

    This post is skipping the work with IL-12. In so many ways Anna Schurich and fellow researches published an interesting study that raises more questions about what is going on in the mitochondria in T cells, or any cells, during hypoxia.  Bumping up production of INFγ with IL-12 is interesting.  That IL-12 also seems to increase the output of mitochondria is more interesting and leaves us searching for an explanation of why this is. 

    • Why is the liver hypoxic and the many organs that CMV infects not hypoxic? 
    • Is the liver always hypoxic or just when the metabolic load of a meal arrives via the portal vein or when the patient takes a drug that requires metabolism by cytochrome P450
    • Could the real mitochondria damage occur when O2 is restored?

    Cu(I)NA2 comes to the rescue

    Marin W. et al. (2021) Mitochondria as a therapeutic target for cardiac ischemia‑reperfusion injury (Review) Int, J. Mol Med. 47: 485-499, 2021 PMC free article

    The review summarizes several decades of research towards the understanding of how cardiac mitochondria become generators of superoxide when ischemia that results from a myocardio infarction is reversed too quickly by reoxygenation.  Complex I becomes a generator of super oxide.  The Marin review discusses therapeutic interventions to restore the NAD+ that is depleted in the ischemic heart. Nicotinamide riboside (NR) and nicotinamide mononucleotide (NMN) are the natural precursors of NAD+.  Copper is only given brief mention in this review as a cofactor in Cu/Zn SOD 1 that removes the superoxide generated by the ischemia reperfusion injured cardiac mitochondria.

    The pandemic might be in the rear view mirror for many, but the elderly are still coming down with Covid and many other viral infections that are less of a problem for the young. The lay reader is not expected to understand all of the experiments leading to T cell mitochondria as being the smoking gun for T cell exhaustion in viral infections. We think that the combination of niacin and copper might one day prove to be therapeutic.

  • PD-1 and Tim-3

    This post was initiated as an effort to better understand a previous post showing association of CD8 cytotoxic T cell surface proteins PD-1 and Tim-3 with Long Covid. A 2010 study documented coregulation of CD8 T cell exhaustion by Tim-3 and PD-1 during chronic lymphocytic choriomeningitis virus infection (LCM) [1] Could Long Coivd be a chronic infection enabled by exhausted T cells? PD-1/Tim-3 play a role in T cell exhaustion in cancer. A study has used H2 gas to bolster the mitochondria in human cancer patients. [2] Cuprous niacin could have an even greater potential as an immunomodulator for more than just Long Covid! For now, Long Covid is where the FDA interest seems to be. This study [1] tells us that anti viral CD8+ T cell surface receptors PD-1 and Tim-3 are something we should include in the clinical trial. Ref [2] that PD-1 has a strong mitochondrial and NAD+ connection. PD-1

    During chronic viral infections such as HIV, hepatitis B virus, and hepatitis C virus
    (HCV) , CD8 T cells become “exhausted” as characterized by [1]

    1. Inability to produce cytokines
    2. Inability to lyse virus infected cells
    3. Inability to proliferate
    Materials and Methods [1]
    • Six-week-old female C57BL/6 mice were were intraperitoneally
      infected with 2 × 10⁵ pfu of LCMV
    • Lymphocytes were isolated from tissue including spleen, liver, lung, and blood as previously described.
    • To detect degranulation, splenocytes were stimulated with individual LCMV peptides or a pool of eight LCMV epitopes for 5 h in the presence of brefeldin, monensin, anti–CD107a-FITC, and anti–CD107b-FITC. Cells were then analyzed on by flow cytometry to determine surface markers.
    • CD8 T cells were purified to more than 90% purity using magnetic beads.
    • Tim3+PD1+ and Tim3-PD1+ CD8 T and cocultured with splenocytes from Thy1.1+ C57BL/6 mice in the presence of LCMV peptides for 3 d.  Proliferation was measured suing flow cytometry.
    • For blockade of PD-1 pathway, 200 μg of rat antimouse PD-L1 antibody were administered intraperitoneally every 3 d for 2 wk.
    • For blockade of Tim-3 pathway, 100 μg of Tim-3-Ig fusion protein were injected intraperitoneally every 2 d for 2 wk.
    • Titers of virus from serum or homogenized tissue sample were determined by plaque assay on Vero cells.
    Fig 1 Intro to flow cytometry and acute vs chronic viral infections

    Figure 1 Panels B and D showed flow cytometry quadrant plots for all data points. [1] The antibodies that recognize the surface markers are conjugated with different colored fluorescent tags.  Cells that are negative for both surface marker are in the lower left quadrant.  Those that are positive for both, in this case GP33 and Tim3 appear in the upper right quadrant.  Panel 1A is a series of histogram plots.  The X-axis is bins of signal intensity for the CD33 antibody.  The Y-axis is the counts, or number of cells with a given signal intensity.  GP33 appears to be a LCMV peptide.   These T cells in acute and/or chronic infections should recognize peptides from the surface of LCMV.       

    Of all of the T tells that have receptors that bind to GP33, the majority also express Tim3 and PD1 receptors in chronic, but not acute infections. 

    Fig. 2 Co-expression of Tim-3 and PD-1 correlates with …

    more severe exhaustion of LCMV-specific CD8 T cells during chronic infection. Functions of
    Tim3+PD1+ or Tim3-PD1+ CD8 T cells were analyzed using splenocytes at day 50 after infection. [1]

    (A) This post is omitting panel on that demonstrates the isolation protocol.   

    (B) Frequency of GP33- or GP276-specific CD8 T cells producing cytokine after
    stimulation for 5 h with GP33-41 or GP276-286 peptides.  These cytokines seem to be in secretory granules or something.  Their synthesis and/or secretion is dependent on binding of peptides from the LCMV to the T cell receptors.  These panels examine the ratio of cells expressing producing cytokines to those T cells with receptors receptors that recognize LCMV peptides.  Having Tim3 and PD1 on the cell surface tends to correlate with low inflammatory cytokine

    (C) Frequency of Tim3+PD1+, Tim3-PD1+, or Tim3-PD1- CD8 T cells producing IL-10 was analyzed after stimulation for 5 h with the LCMV peptide. Data are representative of three independent experiments. Error bars represent SEM. LCMV   pool consists of GP33-41, GP276-2.  Note the lavender arrow that emphasizes the Tim3 negative status of the empty circles.  These T cells do not produce the inhibitory cytokine IL10. 

    Fig. 3. In vivo blockade of Tim-3 and PD-1 pathways

    enhances virus-specific CD8 T-cell responses during chronic viral infection. [1]

    Chronically infected C57BL/6 mice (80 d after infection) were treated every third day or every eeks other day for 2 wk with αPDL1 or Tim3Ig, respectively. Frequency of GP33-specific CD8 T cells before and after treatment of individual mouse is shown in the blood. Total number of GP33-specific CD8 T cells in the indicated
    tissues at 2 wk after treatment. Data are representative of three independent experiments with five to six mice per group in each experiment

    In the three tissues but not the blood, just knocking down PDL1 increases the proportion of all CD8+ cytotoxic T cells that express the GP33+ receptors that recognize the LCMV peptides.

    Fig. 4. Dual blockade of Tim-3 and PD-1 pathways…

    enhances function in exhausted virus-specific CD8 T cells. [1]

    (A) IFN-γ production and degranulation by CD8 T cells in treated mice at 2 wk after therapy. The percentage of IFN-γ+CD107+ CD8 T cells specific for each of the LCMV peptides are summarized.

    (B) Polyfunctional (TNF-α+IFN-γ+) CD8 T cells in treated mice at 2 wk after therapy.

    (C) The proliferation of antigen specific CD8 T cell after dual blockade is shown as the percentage of Ki67+ on LCMV GP33-specific CD8 T cells. Data are representative of three independent experiments with five to six mice per group in each experiment.

    *P < 0.05; **P < 0.01

    While it takes the peptide pool to really get the T cells to crank out TNFα and INFγ, just peptides restricted to smaller regions of LCMV are effective in increasing T cell proliferation as measured by Ki67.

    Fig. 5. Dual blockade of Tim-3 and PD-1 pathways…

    enhances viral control. [1]
    Viral titer was determined by plaque assay in the blood before and after treatment. Viral load in spleen, liver, and lung at 2 wk after treatment is shown. Data are representative of three independent experiments with five to six mice per group in each experiment. Error bars represent standard error of the means.

    Never mind the decreased proliferation and cytokine production by exhausted CD8+ T cells, inhibiting PD-1 and Tim-3 reduces the LCMV viral load in this mouse study. What if Long Covid really is a chronic infection that escapes the immune system? This site has covered the role of copper deficiency in T cell exhaustion. What if bolstering the mitochondria can prevent PD-1 from being expressed in the first place?

    It should also be noted that the PD1/PD-L1/Tim3 system plays a role in cancer and tuberculosis infections as well as transplanted organ tolerance and autoimmunity. [2] The Wolf review did not mention chronic Lyme Disease infections. These authors did go into the many ligands of Tim3 and the possible benefits of Tim3 ligand binding blockage.

    This story [1] is all very interesting, but what is the connection to the mitochondria?  This question was addressed by a human study of cancer patients with colorectal carcinoma on the PD1 antibody chemotherapy agent Nivolumab.  [2] Specifically, these patients had issues with CD8+ T cells that also expressed PD-1 and Tim3. [3]  Akagi and Baba covered many important points as to why they thought there was mitochondrial dysfunction and that the patients would benefit form H2 gas therapy.

    • Nivolumab cure rate of 20‑30% and needs a biomarker to distinguish responders from non-responders.  ,
    • These T cell dysfunctions of exhausted T cells are inversely correlated with decreased
      mitochondrial function (3),
    • which is caused by progressive loss of peroxisome proliferator‑activated receptor‑γ coactivator 1α (PGC1α), a regulator of mitochondrial replication that is controlled by a variety of signaling pathways
    • (Akt, p38‑MARK, AMPK, SIRT1, PRMT1… Note that AMPK and SIRT1 pathways are connected with NAD+, ADP/ATP, and overall mitochondrial function. 
    • The authors reported that the proportion of PD‑1+terminal CD8+ T cells containing PDT+ and PDT‑ (exhausted CD8+T cells) in the peripheral blood of colorectal cancer patients was reduced by hydrogen gas, an activator of PGC1‑α,
    • They used serum coenzyme Q as a marker of mitochondrial function.  CoQ10 was in the serum was highly associated with patient prognosis.  [2]

    The authors found that some patients responded to hydrogen gas and that others did not.  The PD1/Tim3 + T cells (PDT+) decreased with the H2 therapy.   PDT+ was inversely correlated with serum CoQ10.  The authors claimed no appropriate method to easily measure mitochondrial function.   They argued that CoQ10 is part of the electron transport chain.  If so, what is it doing in the serum?   The Seahorse respirometer is a not so easy way to measure cellular respiration as is cellular ATP content.  Akagi and Baba discussed NAD+ pathways and gene transcription. They also discussed the putative role of H2 in turning components of NAD+ and ADP/ATP ration gene transcription. So H2 has some benefit. It does not address the possibility that the antiviral cytotoxic T cell does not have enough nutrients to do its duty so it is expressing PD-1 so that it may be turned off.

    Onorati 2022 introduced the concept that the senescent associated secretory phenotype (SASP) upregulates PD-L1 expression.

    The Tchkonia review [4] discussed signaling pathways like p53/p21..

    Triggers may include DNA damage, reactive oxygen species, and protein aggregation. They introduced an interesting concept of “sterile inflammation” as opposed to inflammation that results from a pathogen infection.

    The role of copper deficiency and mitochondria dysfunction was not discussed, but we think this may be relevant in aging. . The role of Cu/Zn superoxide dismutase was also not discussed in terms of reactive oxygen species.

    1. PD-L1 was increased in human diploid lung fibroblasts induced to undergo senescence.
    2. This induction requires the SASP
    3. The SASP “fires” through second messenger protein kinases called JAK-STAT
    4. mTOR, the nutrient sensing master regulator, is involved.
    5. PD-L1 is upregulated in interstitial lung disease.

    References

    1. Jin, H. T., Anderson, A. C., Tan, W. G., West, E. E., Ha, S. J., Araki, K., Freeman, G. J., Kuchroo, V. K., & Ahmed, R. (2010). Cooperation of Tim-3 and PD-1 in CD8 T-cell exhaustion during chronic viral infection. Proceedings of the National Academy of Sciences of the United States of America, 107(33), 14733–14738. PMC free article
    2. Wolf Y, Anderson AC, Kuchroo VK. TIM3 comes of age as an inhibitory receptor. Nat Rev Immunol. 2020 Mar;20(3):173-185. PMC free article
    3. Akagi J, Baba H. Hydrogen gas activates coenzyme Q10 to restore exhausted CD8+ T cells, especially PD-1+Tim3+terminal CD8+ T cells, leading to better nivolumab outcomes in patients with lung cancer. Oncol Lett. 2020 Nov;20(5):258 PMC free article
    4. Onorati A, Havas AP, Lin B, Rajagopal J, Sen P, Adams PD, Dou Z. Upregulation of PD-L1 in Senescence and Aging. Mol Cell Biol. 2022 Oct 20;42(10):e0017122. PMC free article
    5. Tchkonia T, Zhu Y, van Deursen J, Campisi J, Kirkland JL. Cellular senescence and the senescent secretory phenotype: therapeutic opportunities. J Clin Invest. 2013 Mar;123(3):966-72.  PMC free article