Category: aging
-
Seniors need copper and iron
Choe YM, Suh GH, Lee BC, Choi IG, Lee JH, Kim HS, Kim JW. Association Between Copper and Global Cognition and the Moderating Effect of Iron. Front Aging Neurosci. 2022 Mar 29;14:811117. PMC free article
This is a really nice study out of South Korea that suggests that blood serum copper and iron in the low end of the reference range may be associated with cognitive decline as measured by the the Mini-Mental State Examination (MMSE) We need both copper and iron in our carrier protein ceruloplasmin.

This is a recycled image from the ceruloplasmin post that describes the the cooperative actions of iron (Fe) and copper (Cu) in transport of these minerals.
On this site we have mad much ado about the active role of copper in Complex IV of the mitochondria electron transport chain. If one checks the Wikipedia site on Complex IV function, it becomes clear that iron also plays a very important role in electron transport. Let us just keep in mind while we review the South Korean study that Cu and Fe are partners in traversing our circulation and generation of ATP in our mitochondria.
This study was part of a larger longitudinal study that follows patients over time, in this 99 non-demented adults between 65 and 90 years of age: 42 cognitively normal (CN) adults and 57 adults with mild cognitive impairment (MCI) were enrolled in the General Lifestyle Alzheimer’s Disease study with 13 dropouts. The Clinical Normal group consisted of participants with a Clinical Dementia Rating score of 0 and no diagnosis of MCI or dementia. All participants with Mild Cognitive Impairment met the current consensus criteria for amnestic MCI. Patients with mental illnesses and other physical issues associated with test taking were excluded.
Clinical Assessments
The MMSEwas used to measure global cognitive function. Vascular risk factors, income, smoking status, and so on were also taken into consideration.
Measuring Serum Copper Levels and Other Blood Biomarkers
Blood was collected after overnight fasting in the morning (8–9 a.m.). The normal range for the serum copper level is 75–145 μg/dL according to the Mayo Clinic Laboratories. This reference category was used to subdivide the participants into three groups, or tertiles.
- low (< 87 μg/dL)
- medium (87–98 μg/dL)
- high (> 98 μg/dL)
Blood iron was divided into “low” and “high” according to the reference range.
Table 1 asked if smoking status, education, income, alcohol consumption, gender,APO4E and so on predicted being in the low, medium, or high copper group. They did not by themselves. The APOE gene codes for apolipoprotein. The APO4E variant, one of three, of apolipoprotein puts one at risk for Alzheimer’s Disease. “Version 4 is less effective at removing plaques from the brain. Individuals who have version 4 have a significantly increased risk for developing Alzheimer’s,” according to Alzheimer’s Organization. The authors came up with models (equations) to incorporate factors that might affect the MMSE score and serum copper. These other factors are confounding variables. Let us say that people who drink a lot have a higher risk of lung cancer. Does alcohol cause lung cancer? Maybe not. People who drink a lot may hang out in bars where there is a lot of tobacco smoke. Perhaps those who drink a lot are also addicted to tobacco as well. We need not concern ourselves with the equations the South Korean group used to sort out the other life style issues that influence MMSE score and serum copper and iron.

Figure 1 Partial regression plots of the serum copper and MMSE score. (A) Overall and (B,C) by subgroup (B, low iron and C, high iron). Multiple linear regression analyses were performed after adjusting for all confounders. We’ve covered a confounder. Multiple linear regression means taking multiple predictors into the outcome variable MMSE. The lower the P value, the higher the probability that the observed difference is not due to random chance. The cut off of significance is generally p<0.05, or 95% certain that random chance was not at play. The R2 value, Pearman correlation coefficient, tells us how tight the dependent outcome variable is with the independent variable. A value of 1.0 tells us there is a one to one tightness of one with the other. A value of 0 means no relation whatsoever.
- Overall, the higher the adjusted serum copper, the higher the MMSE…. serum iron notwithstanding. We are very sure that this observation is not due to random chance. The tightness of the relationship is sort of borderline.
- When we go to the low iron group, we see the same increase in MMSE score as a function of serum copper. The R2 value is closer to 1.0 and the p value indicates that this is not due to random chance.
- In the high serum iron group, serum copper is less of a predictor of MMSE score.
Then the publication moved on to bar graphs that might be easier to understand.

Figure 2. Box plots of the serum copper categories and MMSE score. (A) Overall and (B,C) by subgroup (B, low iron and C, high iron). Multiple linear regression analyses were performed after adjusting for all confounders. *P < 0.05; **P < 0.01; ***P < 0.001. When a person is in the low iron group, going from low to high copper makes a significant difference in the MMSE score. If the elder already has high iron, being low or high copper does not make that much difference in the MMSE score.
If an elder is in the low reference range for copper and iron, should he/she supplement? This would be a health care provider question. The Choe study from South Korea suggests every little bit helps.
If we were to conduct an informal version of this study, we may not include many confounding variables if we are starting with seniors with low reference range copper and/or iron. If we are just looking a cognitive scores while in the low reference range for copper and the after scores we need not worry as much about confounding variables. ApoE4 status will not change. Smoking and alcohol use will probably not change. We could add an additional outcome variable like “chasing grand kids.” We’d then have to measure the copper and/or iron status after a given period of supplementation.
-
cytochrome C oxidase activity deficiency in aging
We found an absolutely beautiful image of cytochrome C oxidase activity in a skeletal muscle section. [1] This site failed to reference the claim that 3% of the muscle fibers in the elderly are deficient in the copper cofactor enzyme cytochrome C oxidase (CCO) enzyme activity. CCO/complex IV terminates the electron transport chain of the mitochondria. Naturally this claim had to be investigated. An internet search was performed for more beautiful images of CCO activity in aged human muscle sections.
- We found an excellent 2011 publication that investigated the increased age related muscle frailty in AIDS patients on long term retroviral treatment. [2] This paper had much to say about the retrovirals accelerating the accumulation of mutations in the mitochondria genome which contains the gene for CCO. A keyword search of the PDF file of this paper for “copper” revealed nothing!
- This year, 2023, an amazing review was published in Experimental Gerentology on muscle aging. [3] “Ultrastructural changes, including loss of type I and type II myofibers and a greater proportion of cytochrome c oxidase deficient” was a major theme, but not one word whatsoever on copper! What? This cannot be!
- Then we found a 2003 paper on the use of copper deficiency to accelerate cardiac muscle aging in a rat model was discovered that explains so much. [4] This research was performed before 2004 when 90% of the human genome had been sequenced. [5] Technology has enabled us to learn so much more, yet we are forgetting the basics. A brief nod may be given to a new 2018 assay to measure CCO activity deficiency in small tissue samples.[6]
Never mind genes, diet induced CCO deficiency and more

Ten weaning rats were fed a casein based diet that was copper adequate diet and allowed to eat as much as they pleased. Another ten had a casein based copper deficient diet and were also allowed to eat as much as they pleased.
The food that these rats was recorded. Then another two groups of ten rats were fed 80% of the rats that were eating as much as they liked. copper-adequate diet (5.0 μg Cu/
g diet) or copper-deficient diet (0.3μCu/g diet) for five weeks after which time their hearts were harvested. Two different different observations were being pursued with this study.- Copper deficiency causes mitochondrial oxidative stress by depriving cytochrome C oxidase of adequate copper.
- Caloric restriction is a good thing.
Over the course of this study the rats grew from about 78 g to about 200 to 270g. The rats eating as much as they wanted of the copper adequate grew significantly more than the other three groups. Food restricted/ copper adequate rats experienced the same growth as the copper deficient rats that were allowed to eat as much as they wanted. Food restricted, copper deficient rats grew significantly less than the other three groups. There was no statistical synergy between copper deficiency and food restriction. The 10% adequate copper in the diet meant about 10% control copper in the liver. Copper deficiency tended to decrease the amount of iron sticking around in the liver.
Multifaceted mitochondrial issues with copper deficiency
Before looking at important “and more” enzymes other than cytochrome C oxidase in complex IV, we need a cartoon.

This image came from Looking for Diagnosis which does an excellent job of explaining genetic cytochrome C oxidase deficiency. The Looking for Diagnosis does an excellent and quick overview of how mutations in proteins involved in getting Cu to complex IV can cause production of reactive oxygen species. (ROS). Note the decrease in glutathione peroxidase activity as well as the minochondria’s resident scavenger of superoxide O2– Manganese superoxide dismuase, also called SOD2. Note the one O2 picking up one electron e–. This is a math mistake. The cartoon should have two yellow circle electrons taking O2 to H2O. When our bodies make the same mistake we reduce O2 to the deadly reactive oxygen species super oxide written as O2 â—- The “â—” is chemistry for a an unpaired electron. Electrons in this life are always looking to pair up.
One of them is blood vessel relaxing nitric oxide (NO) to from reactive nitrogen species peroxy nitrite ONOO–
Role of superoxide dismutases and glutathione peroxidase
Then we get to our dynamic dual. Both starred superoxide dismutases (SOD) take superoxide back to oxygen and hydrogen peroxide, H2O2.
Glutathione peroxidase takes reduced glutathione (GSH) and H2O2 and gives us harmless H2O and oxidized GSSG.
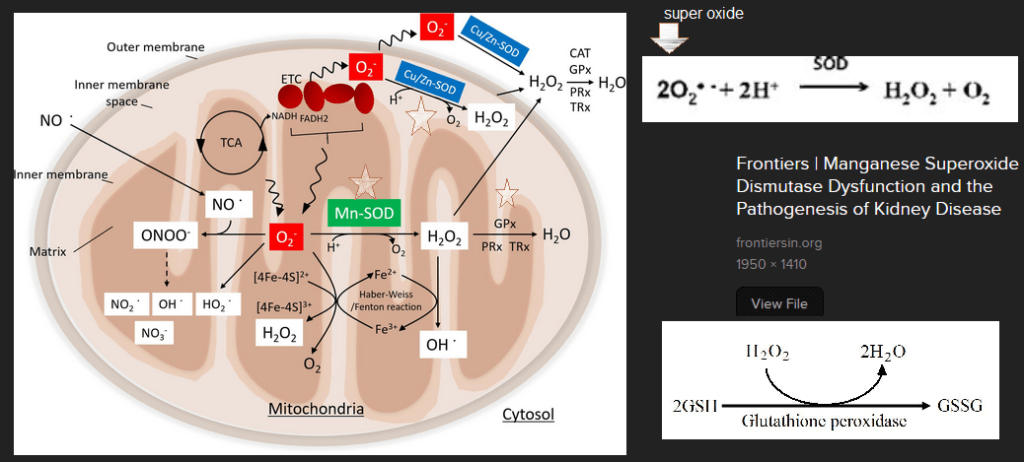
The Mitochondria cartoon with key enzymes MnSOD, GPx, and Cu/Zn SOD starred was obtained with an Internet search and a screen capture of the scientific article that went into details. Other screen captures of the reactions carried out by these enzymes have been added. Now that we know the dynamic dual, let’s look at data
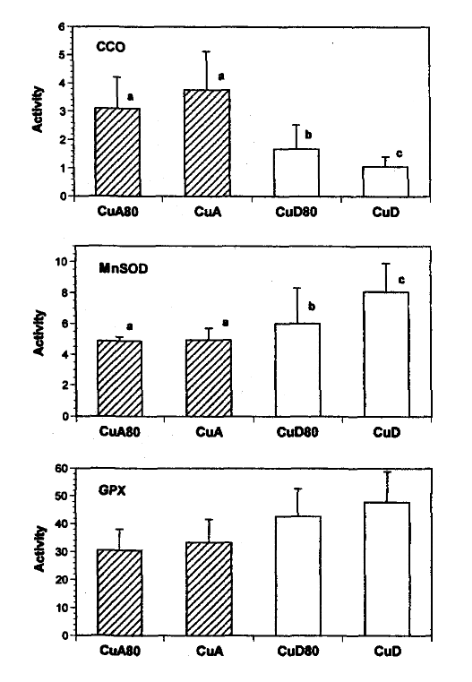
Figure 1: Activities of cytochrome c oxidase (CCO), manganese superoxide dismutase (MnSOD) and glutathione peroxidase (GPX) in mitochondria isolated from the hearts of rats fed copper-adequate diet either ad libitum (CuA) or at 80% of the ad libitum intake (CuA80) and copper-deficient diet either ad libitum (CUD) or at 80% of the ad Ubitum intake (CUD80). Enzyme activities are expressed as Units/mg protein. Values shown are means±SD.
- where a unit of CCO is the amount that catalyzes the oxidation of μmol ferrocytochrome c / min, For non chemists, they are looking at color changes in ferrocytochrome C per minute.
- a unit of MnSOD is the amount that causes 50% inhibition in the rate of pyrogallol autoxidation, Superoxide likes to react with pyrogallo causing a color change.
- and a unit of GPX is the amount that catalyzes the oxidation 1 nmol NADPH / min.
- The authors did some math so that they could meet the rule requirement to use a statistical technique called the 2-way ANOVA.
enzyme diet food restriction combination of the two CCO P=0.0001
99.999% sureP=0.067
93.3% sureP=0.0002
99.998% sureMnSOD P=0.0006
99.994% sureP=0.01
99% sureP=0.01
99% sureGPx P=0.0001
99.999% sureP=0.14
86% sureP=0.052
94.8% surevolume of
mitochondriaP=0.008
99.2% sureP=0.002
99.8% sureP=0.0001
99.99% sureP values from the figure legends have been translated into % certainty that the observed changes are not due to random chance. 95% certainty is generally considered the cutoff. Even back in 2004 mitochondria swelling was a common symptom of copper deficiency. These are two images of heart cross sections analyzed by electron microscopy. The image on the right was adjusted in a free version of PhotoShop called Gimp2.
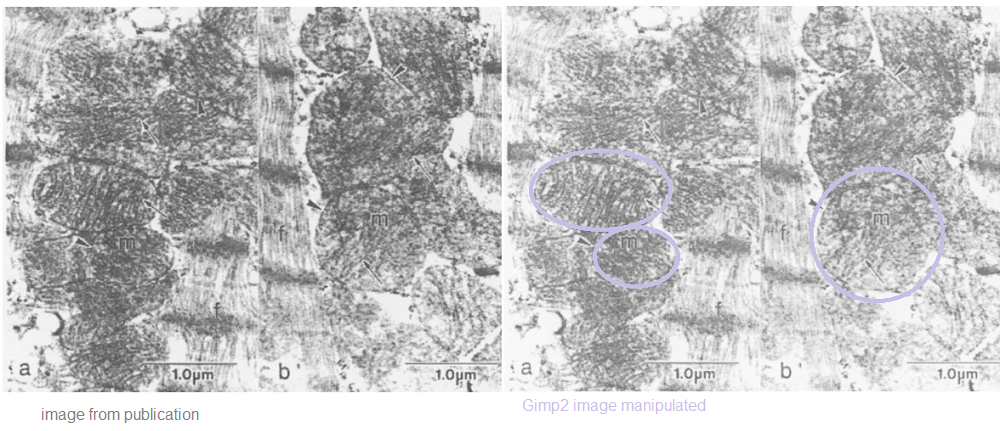
Electron micrographs of mitochondria (m) from hearts of rats fed copper-adequate (panel a) or copper-deficient (panel b) diets ad libitum. The myofibrillar component is indicated (f). The general morphology of the mitochondria, the outer membranes(arrowheads) and the cristae (arrows) demonstrate no detrimental effects associated with the copper-deficient diet. 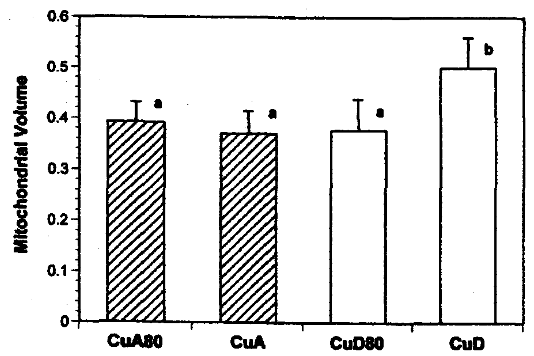
FIGURE 4: Mitochondrial size in hearts from rats fed copper-adequate diet either ad libitum (CuA) or at 80% of the ad libitum intake (CuA80) and copper-deficient diet either ad
libitum (CUD) or at 80% of the ad libitum intake (CUD80).
Mitochondrial volumes are relative to myocardium minus nuclear volume.What does this mean for humans?
The take home is that a diet deficient in copper for five weeks really decreased cytochrome C oxidase activity as well as activity of anti-oxidant enzymes MnSOD and GPx. The authors didn’t even analyze for Cu/Zn SOD! Johnson and Newman [4] also did not measure copper content in the rats’ hearts. [4] The odd thing is that of the rats with unrestricted food access the final weight was~270 vs ~240 g. How do we know we are getting enough copper? Five years ago an assay was published to detect cytochrome C oxidase activity in muscle (not heart) biopsies of rodents and humans. [6] Dr Leslie Klevay, also of the University of North Dakota, has spent his career studying copper deficiency. Here is a direct quote from a 2022 review’s conclusion. [7]
“One can conclude from numerous medical articles that copper deficiency contributes to, and probably causes, Alzheimer’s disease, ischaemic heart disease, some myelodysplastic syndrome and postmenopausal osteoporosis. These chronic diseases have low organ copper and impaired metabolic pathways dependent on copper. They improve with supplements containing copper. Thus, they exhibit classical characteristics of deficiency.” [7]
The study of Johnson and Newman [4] gives us some onsite on the what might be the cause of multi-organ disease states: loss of cytochrome C oxidase activity and anti-oxidant helpers MnSOD and GPx. [4]
References
- Frontal Cortex Online Course
- Payne BA, Wilson IJ, Hateley CA, Horvath R, Santibanez-Koref M, Samuels DC, Price DA, Chinnery PF. Mitochondrial aging is accelerated by anti-retroviral therapy through the clonal expansion of mtDNA mutations. Nat Genet. 2011 Jun 26;43(8):806-10. PMC free article
- Picca A, Lozanoska-Ochser B, Calvani R, Coelho-Júnior HJ, Leewenburgh C, Marzetti E. Inflammatory, mitochondrial, and senescence-related markers: Underlying biological pathways of muscle aging and new therapeutic targets. Exp Gerontol. 2023 Jul;178:112204. PMC free article
- Johnson WT, Newman SM Jr. Copper deficiency: A potential model for determining the role of mitochondria in cardiac aging. J Am Aging Assoc. 2003 Jan;26(1-2):19-28. PMC free article
- National Genome Research Institute
- Simard ML, Mourier A, Greaves LC, Taylor RW, Stewart JB. A novel histochemistry assay to assess and quantify focal cytochrome c oxidase deficiency. J Pathol. 2018 Jul;245(3):311-323. PMC free article
- Klevay LM. The contemporaneous epidemic of chronic, copper deficiency. J Nutr Sci. 2022 Oct 11;11:e89. PMC free article
-
Niacin muscle NAD+
This post started out exploring an NAD+ boosting niacin clinical trial. The thought that if some other group had shown that niacin increases NAD+ we don’t need to prove it. Key enzymes in the NAD salvage pathway play a role in a progressive external opthalmoplegia (PEO) as shown by a niacin clinical trial. Then a second request came in to explore telomeres and the role NAD+ has in controlling telomere length.
What is PEO and the niacin link?
Pirinen E, Auranen M, Khan NA, Brilhante V, Urho N, Pessia A, Hakkarainen A, Kuula J, Heinonen U, Schmidt MS, Haimilahti K, Piirilä P, Lundbom N, Taskinen MR, Brenner C, Velagapudi V, Pietiläinen KH, Suomalainen A. Niacin Cures Systemic NAD+ Deficiency and Improves Muscle Performance in Adult-Onset Mitochondrial Myopathy. Cell Metab. 2020 Jun 2;31(6):1078-1090.e5. PMC free article

This image, distorted with Gimp2 to make it more like a painting and less like a patient, was obtained from eyerounds.org. It is shown to illustrate weakness of the eye muscles. The following are some definitions to consider before reviewing a clinical trial to improve this condition with niacin supplementation.
from ncbi conditions
“Progressive external ophthalmoplegia is a condition characterized by weakness of the eye muscles. The condition typically appears in adults between ages 18 and 40 and slowly worsens over time. The first sign of progressive external ophthalmoplegia is typically drooping eyelids (ptosis), which can affect one or both eyelids. As ptosis worsens, affected individuals may use the forehead muscles to try to lift the eyelids, or they may lift up their chin in order to see. Another characteristic feature of progressive external ophthalmoplegia is weakness or paralysis of the muscles that move the eye (ophthalmoplegia). Affected individuals have to turn their head to see in different directions, especially as the ophthalmoplegia worsens. People with progressive external ophthalmoplegia may also have general weakness of the muscles used for movement (myopathy), particularly those in the neck, arms, or legs. The weakness may be especially noticeable during exercise (exercise intolerance). Muscle weakness may also cause difficulty swallowing (dysphagia). When the muscle cells of affected individuals are stained and viewed under a microscope, these cells usually appear abnormal. These abnormal muscle cells contain an excess of cell structures called mitochondria and are known as ragged-red fibers. ”
from the Pirinen 2020 publication
Progressive External Ophthalmoplegia is generalized muscle weakness, and susceptibility to fatigue is often caused by single or multiple mitochondrial DNA (mtDNA) deletions.
A mouse model for some progressive mitochondrial myopathy manifests as NAD+ depletion. Intracellular NAD+ concentrations can be increased by various approaches, such as decreasing NAD+ consumption and NAD+ precursor supplementation: nicotinic acid (niacin), nicotinamide (NAM), and nicotinamide riboside (NR). The simplest approach would be to supplement with niacin and also examine lipid metabolic parameters that have been shown to occur with niacin supplementation and that might relate to NAD+The design
This study came out of the University of Helsinki, Finland. These researchers at the University of Helsinki report that mitochondrial muscle disease leads to low NAD+ levels in both blood and muscle. They treatment treated niacin, a vitamin B3 form and an NAD+ precursor, improves NAD+ levels, disease signs, and muscle metabolism in patients, also improving muscle strength and performance. These results indicate that NAD+ depletion occurs in human diseases, and its repletion is a potential therapy for mitochondrial myopathies. Patients were given escalating doses of administered an increasing doses of the NAD+-booster niacin form (to 750-1,000 mg/day.
Arm Intervention/treatment Experimental: Niacin in controls The arm includes healthy controls supplemented with niacin. Dietary Supplement: Niacin The dose for a slow-released form of niacin will be 750-1000 mg/day. The daily niacin dose, 250 mg/day, is gradually escalated by 250 mg/month so that the full dose is reached after 3 months. The intervention time with the full niacin dose is 1 and 7 months for controls and patients, respectively, and subsequently total intervention time 4 and 10 months, respectively. At the end of the study, the daily dose will be decreased by 250 mg/month rate. Other Name: Nicotinic acid Experimental: Niacin in mitochondrial myopathy patients The arm includes mitochondrial myopathy patients supplemented with niacin. Dietary Supplement: Niacin The dose for a slow-released form of niacin will be 750-1000 mg/day. The daily niacin dose, 250 mg/day, is gradually escalated by 250 mg/month so that the full dose is reached after 3 months. The intervention time with the full niacin dose is 1 and 7 months for controls and patients, respectively, and subsequently total intervention time 4 and 10 months, respectively. At the end of the study, the daily dose will be decreased by 250 mg/month rate. Other Name: Nicotinic acid from clinicaltirals,gov 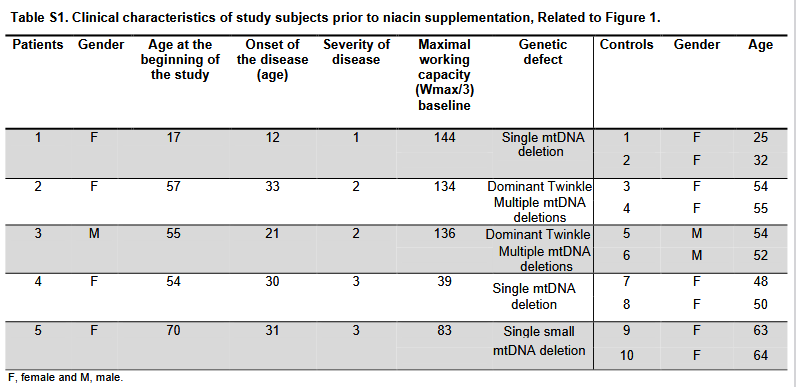
Severity score: 0=no symptoms, 1=mild muscle weakness, mild myalgia only during exercise, mild exercise intolerance, independent in daily
activities; 2=moderate muscle weakness, moderate myalgia at rest and during exercise, moderate exercise intolerance, no walking aid, independent
in daily activities; 3=moderate muscle weakness, moderate myalgia at rest and during exercise, moderate exercise intolerance, need of one
walking aid (e.g. walking stick), independent in daily activities.Fig. 1 NAD+ chemical family changes
As a point of reference, the CopperOne clinical trial participants took 12.12mg cuprous niacin per day for 28 weeks. About 9 mg of this was niacin. The PEO clinical trial used much higher amounts of niacin.

(A) The schematic diagram of the study design. The daily niacin dose was gradually escalated from 250 mg/day by 250 mg per every four weeks to achieve the final treatment dose, 1 g/day. At the end of the study, the dose was decreased by 250 mg per every 4 weeks. Clinical examinations and collection of muscle biopsies were performed in patients at the time points 0, 4, and 10 months and in controls at 0 and 4 months. Fasting blood samples were collected every second week until 4 months and thereafter every 6 weeks until the end of the study.(B) Muscle NAD+ content before and after niacin supplementation in controls (n = 8) and patients (n = 5).(C) Whole blood NAD+ metabolite levels; NAD+ Note that the PEO patients have lower muscle and whole blood NAD+ levels than the normal controls. Niacin supplementation increases the NAD+ in whole blood but not the muscle in the same controls. This panel is from the supplemental data section. It shows the enzymatic pathways between niacin (NA), NAD+, and other related small molecules. Are PEO patients the way they are because of enzyme deficiencies in these pathways?
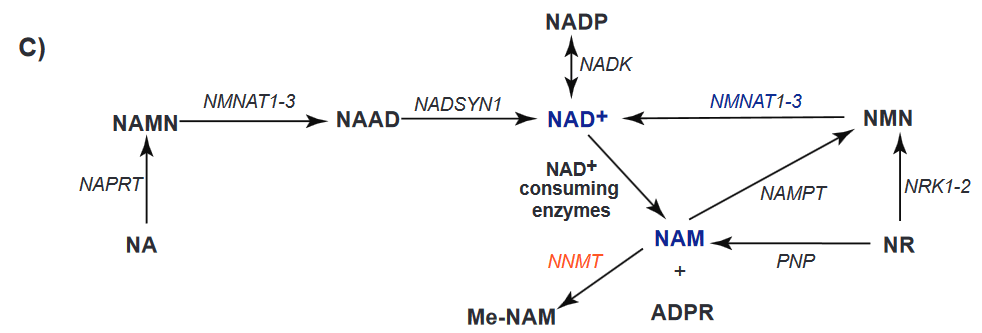
NAMPT, NAM phosphoribosyltransferase; NMNAT, NAM-nucleotide adenylyltransferase; NRK, NAM riboside kinase; PNP, purine
nucleoside phosphorylase; NNMT, NAM N-methyltransferase, NAPRT, nicotinate phosphoribosyltransferase; NADSYN, NAD+ synthetase; NADK,
NAD+ kinase; PARP, poly(ADP-ribose) polymerase; CD38, cluster-of-differentiation-38, NA, niacin, NAMN, nicotinic acid mononucleotide, NAAD,
nicotinic acid adenine dinucleotide; NAD+, NAM adenine dinucleotide; NADP, NAM adenine dinucleotide phosphate; NMN, NAM mononucleotide;
NR, NAM riboside; ADPR, ADP ribose and SIRT, sirtuin.Note that sirtuins are some of the NAD+ consuming enzymes. Nicotinamide riboside is not that different between PEO patients and controls. NADP and NMN are a little lower in PEO patients than the controls even after supplementation with large amounts of niacin. It is the NAM and ADPR that are much higher in the PEO patients even after supplementation.

(D), NAM mononucleotide (E), NR (F), NAM (G), and ADPR (H) before and after niacin supplementation in controls (n = 8) and patients (n = 3–5).
Data are median ± lowest and highest value. ∗p < 0.05; ∗∗p ≤ 0.01; ∗∗∗p ≤ 0.001. Baseline differences between controls and patients were analyzed using Mann-Whitney non-parametric test. Friedman non-parametric ANOVA was used to determine the effect of treatment on patients’ values at different time points whereas control values before and after niacin supplementation were compared using Wilcoxon non-parametric test.NNMT catalyzes the reaction
S-adenosyl-L-methionine + nicotinamide ⇌ S-adenosyl-L-homocysteine + 1-methylnicotinamide.
These data are from supplemental figures of the publication. The authors were looking at gene transcripts for enzymes for proteins in NAD pathways. Note that NNMT enzyme activity is much higher in the PEO patients than the healthy controls. Not surprisingly, muscle NAM is much lower at baseline and at 4 months. Ten months of niacin supplementation seems to rectify the disparity.

Fig. S2. Muscle nicotinamide (NAM) metabolism was deteriorated in mitochondrial myopathy patients, Related to Figure 1.
(A) Muscle expression of genes involved in NAD+ biosynthesis and consumption in patients (n=4) compared to controls (n=8) at baseline.
(B) Muscle NAM content in controls (n=8) and patients (n=5) at baseline and upon niacin supplementation. (C) Presented in earlier figures in this post… . *p < 0.05.Fig. 2 Lipid metabolism parameters
We became interested in the relationship between niacin and copper in fat metabolism and milk production when asked if our supplement would boost milk production in cows. See the fatty liver in cows post. While body weight was not affected, the authors saw variable decreases in fat stores. The reduction in liver fat in the PEO patients is probably most notable.
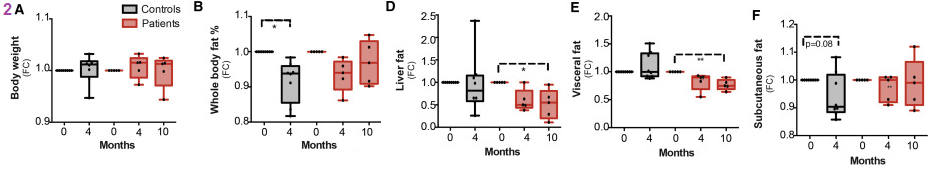
While increased muscle mass in normal and PEO patients may not be the same thing as milk production, we are extremely excited by this finding in humans. Adiponectin is a peptide hormone secreted by adipocytes. It controls fatty acid and glucose metabolism in many tissues. The energy expenditure is in units of percent of control.
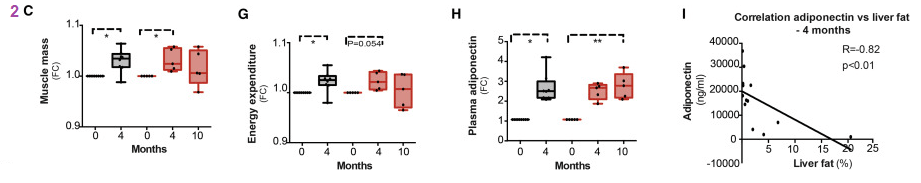
Fig 3. Physical Function
Data in panels 3B- F were collected on a Good strength Metitur adjustable dynamometer chair. This is a Finnish brand. This chair measured static strength of back muscles, and dynamic strength of abdominal and shoulder muscles. FC stands for fraction of control.
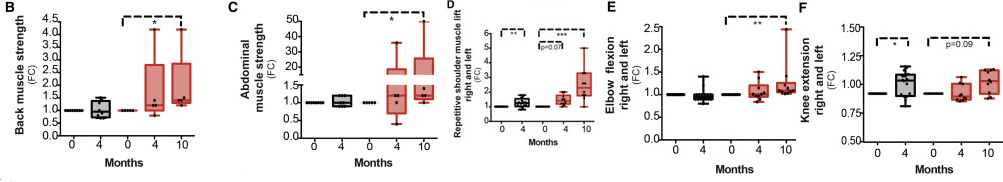
back muscle (B), abdominal muscle (C), repetitive shoulder muscle lift (D), elbow flexion (E), and knee extension (F) strength compared to baseline in controls (n = 8) and patients (n = 4–5). For isometric tests, the highest value from three repetitions was recorded. Results are expressed as FC compared with pretreatment stage. One patient was excluded from the 6-min walk test due to a recent foot injury at 10-month time point. Data are median ± lowest/highest value. Friedman non-parametric ANOVA was used to determine the effect of treatment on patients’ values at different time points whereas control values before and after niacin supplementation were compared using Wilcoxon non-parametric test. The baseline difference between groups and the effect of niacin on lactate levels in controls and patients were determined with two-way ANOVA with Dunnett’s multiple comparison test. ∗p < 0.05; ∗∗p ≤ 0.01; ∗∗∗p ≤ 0.001. Note the high variability in the PEO patients’ response to niacin. In many cases the supplemented PEO patients performed better than the controls!
The six minute walking test speaks more to the mitochondrial function that targets our customer base. As a reminder, a cartoon of pyruvate entering the NADH generating TCA cycle is shown. NADH supplies the ATP generating electron transport chain (ETC) of the mitochondria with electrons and H+. How much does the availability of NAD+/NADH + H+ dictate whether pyruvate goes to acetylCoA or lactate?
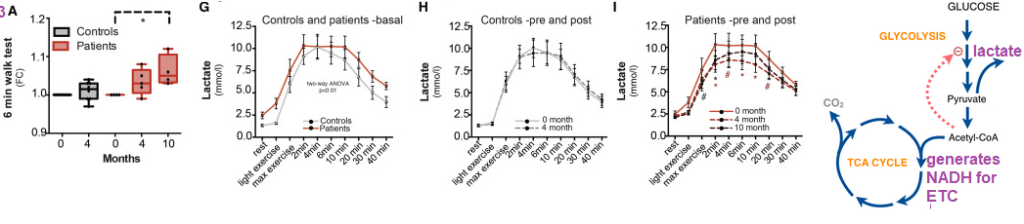
Note the drastic improvement in the six minute walk test in the PEO patients and the variable response in the control patients.
Fig. 4 the mitochondria
Cytochrome c oxidase (COX), respiratorycomplex IV of the electron transport chain, has some subunits encoded by mitochondrial DNA. Succinate dehydrogenase (SDH) complex II of the ETC is entirely encoded by nuclear genes. In PEO patients niacin decreased the fibers that were negative for COX yet positive for SDH. Fibers that were negative for complex I (CI) were also decreased. Mitochondrial total COX activity and mass in muscle fibers increased. Mitochondrial mass was also increased in both controls and PEO patients.
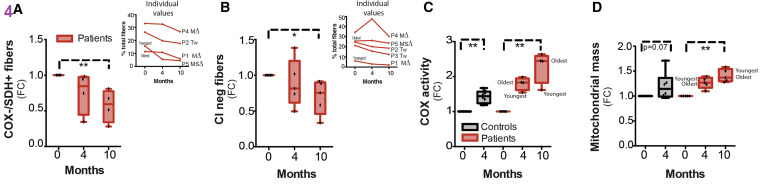
(A and B) Immunohistological assessment of COX-negative, SDH-positive (A) and complex I (CI)-negative (B) muscle fibers compared with baseline in patients (n = 4–5). Three and seven subunits of COX and CI are encoded by mtDNA subunits, respectively, and thereby mtDNA deletions cause COX and CI deficiency, whereas complex II is completely nuclear encoded and not affected by mtDNA deletions. Results are expressed as FC compared with pretreatment stage. Individual patient values are shown in small inserts. Samples from one patient were excluded from the assessment of COX-negative/SDH-positive muscle fibers due to poor sample quality.
(C and D) Immuhistochemical analysis of COX activity (C) and mitochondrial mass (D) compared with baseline in controls (n = 8) and patients (n = 5). Results are expressed as FC compared to pretreatment stage. Data are median ± lowest/highest value. ∗p < 0.05; ∗∗p ≤ 0.01. Friedman non-parametric ANOVA was used to determine the effect of treatment on patients’ values at different time points whereas control values before and after niacin supplementation were compared using Wilcoxon non-parametric test.FC is fraction of control. In panels C and D we see that four months on niacin increases Cox activity and mitochondrial mass. We have to ask ourselves if increases like these can be seen with less “medicinal” levels of niacin and Cu(I).
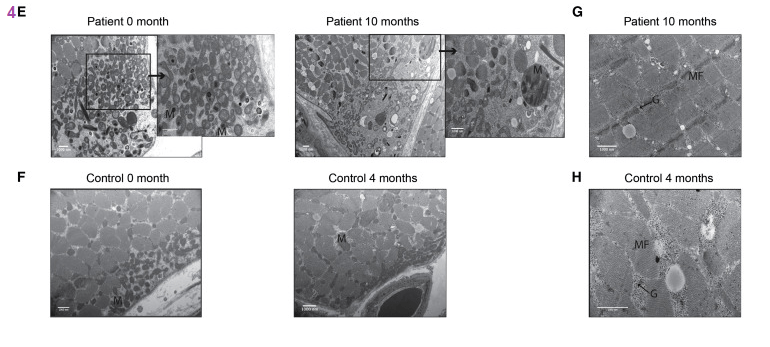
(E and F) Electron micrographs of subsarcolemmal mitochondria (M) in one patient (E) and one control (F) at different time points. Scale bar, 1,000 nM. Enlargements of the subsarcolemmal mitochondria are shown on the right-hand side for the patient sample at the time points 0 and 10 months.
(G and H) Electron micrograph image of one PEO patient (G) and one control (H) showing glycogen (G) deposition (marked with arrow) in muscle fiber (MF) after niacin. Scale bar, 1,000 nM. Results are expressed as FC compared to pretreatment stage. Data are median ± lowest/highest value. ∗P< 0.05; ∗∗P≤ 0.01. Friedman non-parametric ANOVA was used to determine the effect of treatment on patients’ values at different time points, whereas control values before and after niacin supplementation were compared using Wilcoxon non-parametric test.No further comments will be presented on these SEM images on this post.
Fig 5. Metabolites
This post is going to skip the Principle Component Analysis of panel 5A. In short the authors were trying to establish which metabolites separate the patients before and after and the controls before treatment. This post will present Panel 5E which summarizes the methyl transferring pathways that predominate the data
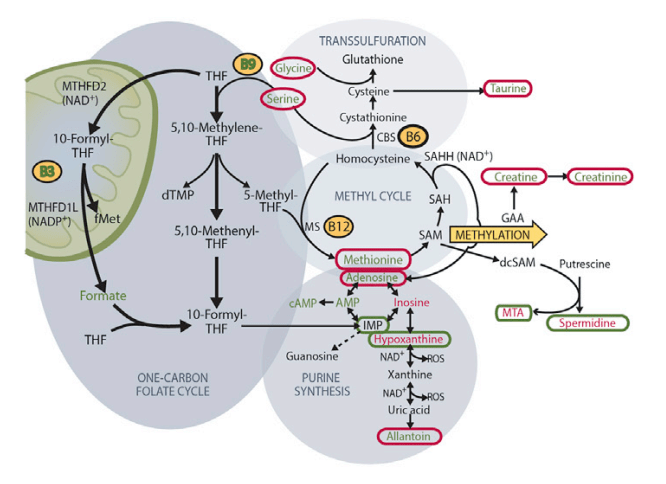
E) One-carbon metabolism and associated pathways in patient muscle pre- and post 10-month niacin. Red increased from baseline, green, decreased. Circled metabolites, changed upon niacin
This post is going to skip presenting Panel 5D that presented amino acid metabolite changes that tended to be around 2x the baseline values. We may need to come back to it when there’s a better understanding of the salvage pathways in yeast and humans in telomeres.
Fig. 6 Pathways
The reviewing this section note will be made when the pathways intersect that of copper and copper cofactor enzymes
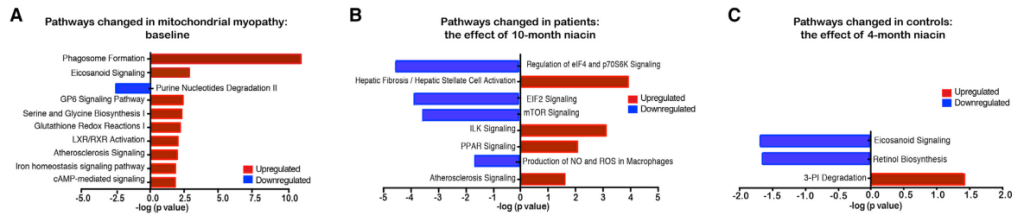
(A) Transcriptomic pathways changed in patients compared with control baseline based on ingenuity pathway analysis (controls n = 8 and patients n = 4–5).(B and C) The effect of 10- (B) or 4-month (C) niacin on transcriptomic pathways in patients (n = 4–5) and controls (n = 8) compared to baseline, respectively This will be an awkward transition from the salvage pathway, and niacin supplementation to the salvage pathway in telomeres in yeast. Three references were found from the JS Smith Lab that increased my understanding of the role of niacin in telomeres.
NAD+ and telomeres
The Sir2 enzyme is an NAD-dependent protein deacetylase that is required for turning off the silent mating-type loci, telomeres, and the ribosomal DNA (rDNA). Mutations in the NAD salvage gene NPT1 weaken all three forms of silencing and also cause a reduction in the intracellular NAD level. [1]
What are telomeres and telomerase?
Telomerase is a ribonucleoprotein that adds a species-specific telomere repeating sequences to the 3′ end of telomeres. A telomere is a region of repetitive sequences at each end of the chromosomes of most eukaryotes that function to prevent fusion with other chromosomes and DNA damage.
In higher eukaryotes, telomere length plays a major role in regulating cellular senescence. This is especially true in primary fibroblasts that do not express telomerase. Telomeres become shorter during each cell division. The Hayflick limit is reached when telomeres become short enough to senesce.
Yeast telomerase is constantly expressed with no progressive shortening in mitotic daughter cells. Mutations in telemerase can mimic mammalian aging with progressive shortening of telomeres. Telomerase deficient est2Δ rad52Δ mutants can’t repair their telomeres. Deleting SIR2 further accelerates senescence within the population. [3]
In yeast the lack of Sir2 results loss of telomeric silencing, which increases the transcription of non-coding TElomeric Repeat containing RNAs (TERRA) Wikipedia has an excellent page on these controllers of telomerase activity. Telomeric silencing refers to the observation that protein coding genes located close to telomers tend to be transcribed less.
A mammalian telomere, NAD+ comes in here
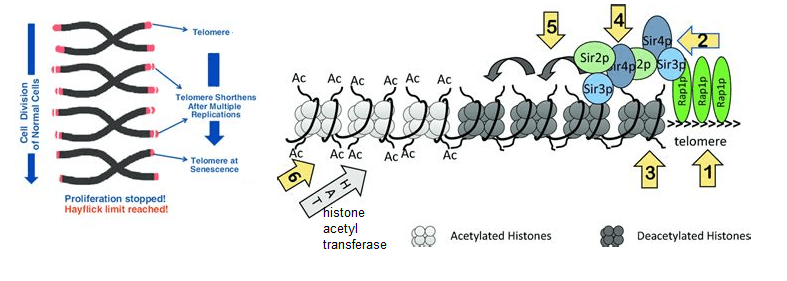
This is a link for the image and following text. - Rap1p binds to the telomeric repeats.
- Sir3p/Sir4p/Sir2p complex is recruited to Rap1p. Enter NAD+
- Sir2p deacetylates histones in the adjacent nucleosome.
- Deacetylated histones recruit more Sir3p/Sir4p/Sir2p complex. Enter NAD+
- The cascade of deacetylation spreads away from the telomeres.
- Spreading of deacetylation is countered by Histone Acetyl Transferases (HATs)
Back to yeast telomeres and NAD+ salvage
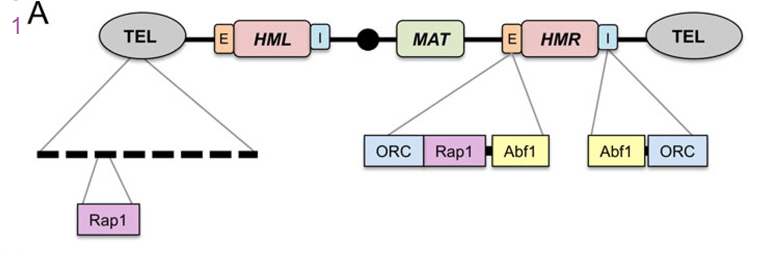
Classic silencing targets of Sir2 on chromosome III. A) Schematic diagram showing Rap1 binding sites at the telomeric repeats. The Rap1, origin recognition complex (ORC), and Abf1 binding sites within the E and I silencer elements flanking HMR are also shown. Transcriptional repression can be highly localized and transient, such as at the promoters of specific genes, or more widespread across large regions of the genome that remain in a repressive and condensed state for extended periods. These latter domains tend to be heterochromatic and stable, sometimes even through multiple generations. In budding yeast, HML, HMR, and telomeres are generally considered to be the heterochromatin equivalents in this organism. [3]
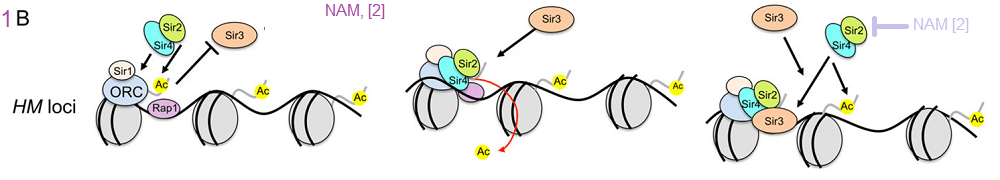
Classic silencing targets of Sir2 on chromosome III. B) Updated model for Sir2-mediated histone deacetylation at silent chromatin (via the SIR complex). A Sir2/Sir4 sub-complex is recruited by ORC, Sir1, and Rap1 at the silencers. H4K16 is then deacetylated, which promotes Sir3 binding to form a SIR holocomplex, and induce spreading. Silencing spreads as more Sir2/4 is recruited to adjacent nucleosomes, resulting in further histone deacetylation and the binding/stabilization of additional Sir3 units.[3] In a previous report NAM was shown to be inhibitory towards Sir2 
he RENT complex, recruitment to the rDNA and rDNA stability in yeast aging. A) The RENT complex consists of Sir2, Net1, and Cdc14, and functions as a histone H3 and H4 deacetylase within the nucleolus. B) RENT is recruited to the intergenic spacers of the rDNA repeats at either IGS1 via interactions with Fob1, or at IGS2 via interactions with RNA polymerase I at the rDNA gene promoter (Pol I). 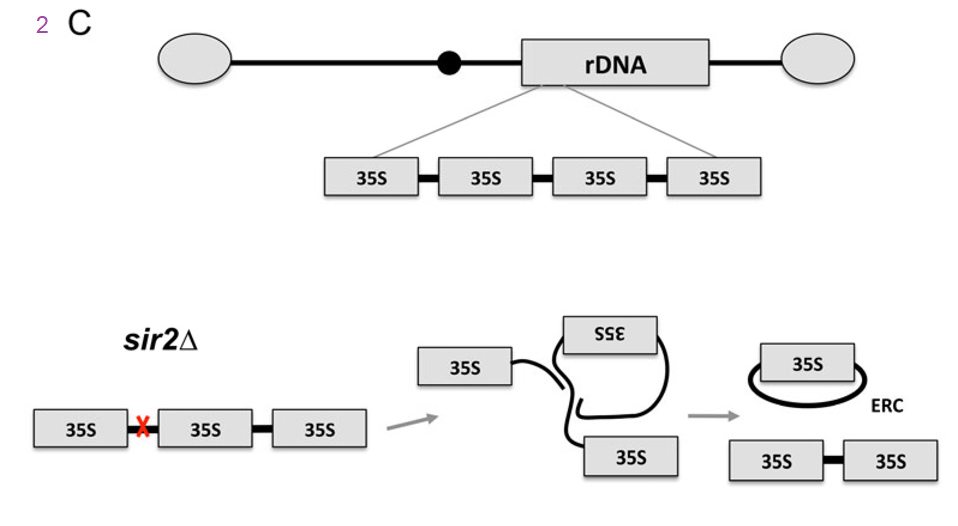
C) The rDNA genes are organized as a large tandem array on the right arm of chromosome XII. Double-strand DNA breaks that occur at the replication fork block site in IGS1 (red x) are repaired through homologous recombination. In the absence of SIR2, the rDNA tandem array is destabilized and unequal intra-chromatid exchange results in the formation of extrachromosomal rDNA circles (ERCs), which are self-replicating and asymmetrically segregated into mother cells. The authors discussed nutrient sensing ensembles of proteins that also control aging. These include sensors of mitochondrial function that is not just NAD+ production but also the ADP to ATP ratio. This is where we think that Cu+ and mitochondrial cytochrome C oxidase may synergize with agents that boost NAD+.
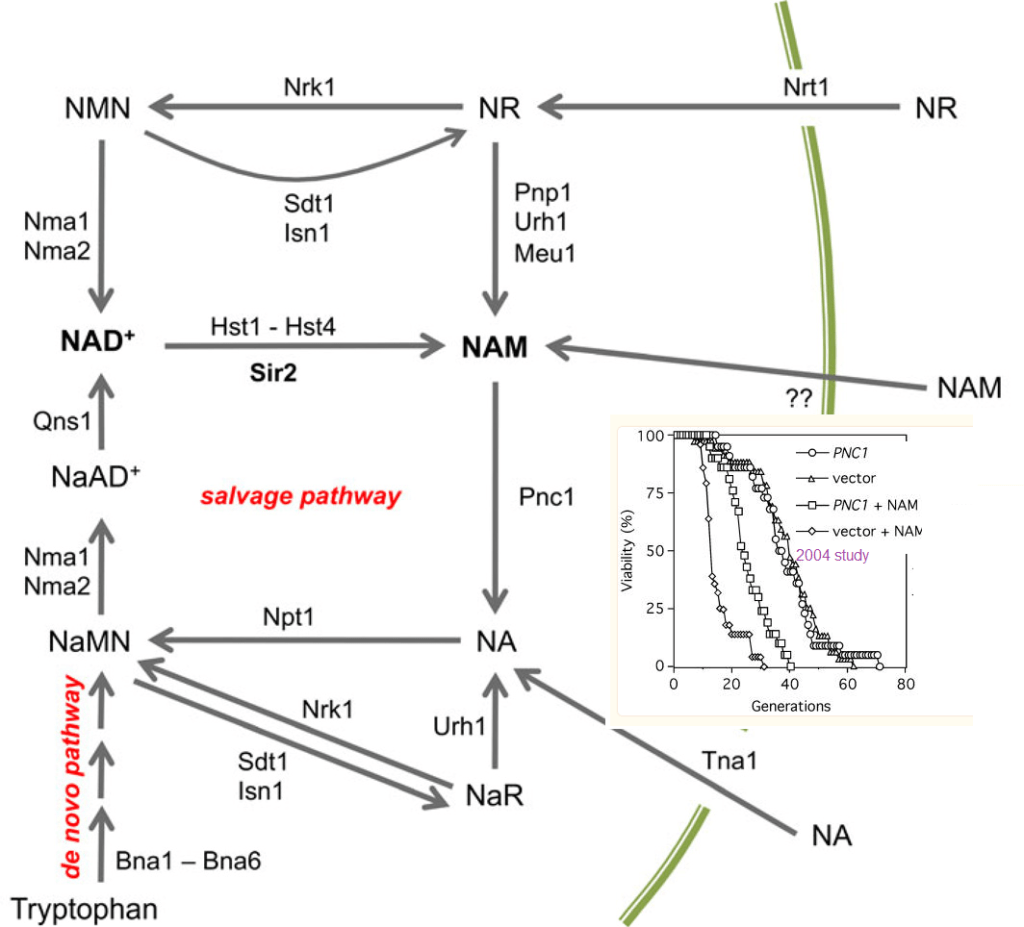
Figure 3 yesast ref [3] Overview of NAD+ biosynthesis and metabolism in Saccharomyces cerevisiae. NAD+ is synthesized de novo by the Bna1-Bna6 enzymes using tryptophan as the starting substrate. The vitamin precursors nicotinic acid (NA), nicotinamide (NAM), and nicotinamide riboside (NR) are imported and then enter a set of salvage pathways that ultimately feed into nicotinic acid mononucleotide (NaMN) or nicotinamide mononucleotide (NMN). These mononucleotides are further adenylated to by Nma1 or Nma2 to form the dinucleotide forms, which for nicotinamide, is actually NAD+. Precursors from the nicotinamide branch of the salvage pathways can be shifted to the nicotinic acid branch through deamidation of nicotinamide by Pnc1. The sirtuins produce nicotinamide during the deacetylation reaction. The mechanism of nicotinamide import is unknown. Other abbreviations: NaAD, deamido NAD; NaR, nicotinic acid mononucleotide. inset is from ref [2] yeast telomere references
- Sandmeier JJ, Celic I, Boeke JD, Smith JS. Telomeric and rDNA silencing in Saccharomyces cerevisiae are dependent on a nuclear NAD(+) salvage pathway. Genetics. 2002 Mar;160(3):877-89. PMC free article
- Gallo CM, Smith DL Jr, Smith JS. Nicotinamide clearance by Pnc1 directly regulates Sir2-mediated silencing and longevity. Mol Cell Biol. 2004 Feb;24(3):1301-12. PMC free article
- Wierman MB, Smith JS. Yeast sirtuins and the regulation of aging. FEMS Yeast Res. 2014 Feb;14(1):73-88. PMC free article
-
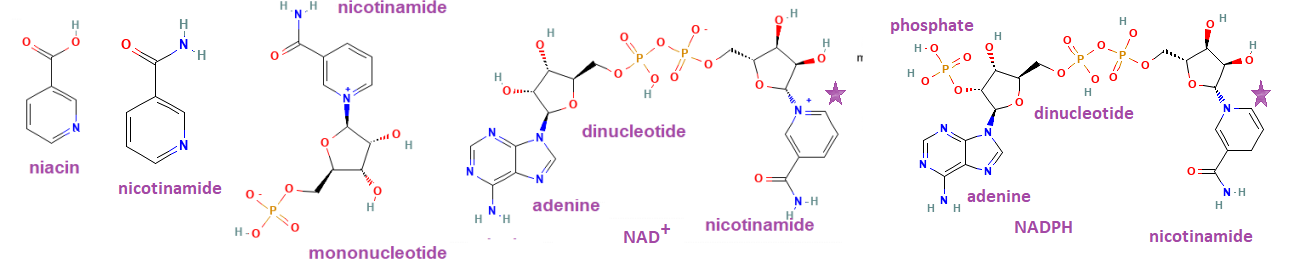
nicotinamide dinucleotide riboside
The purpose of this post is to convince Elysium Health and/or customers that they should consider added BioCu1 to one of their formulations proven to increase NAD+ levels, the topic of this post. What does NAD+ have to do with aging? According to the featured paper, “The maintenance of efficient cellular metabolism has been shown to play a pivotal role in the prevention of age-associated pathologies and in regulating longevity. ” On a philosophical note so much of cellular metabolism involves the shuttling of electrons.
This post will discuss why BioCu1 may add to the NAD+ boosting abilities of the Elysium formulation.
Where do electrons come from again?
Donuts! Connecting fuel to NAD+ and ATP!
Fats and carbohydrates are metabolized into two carbon acetyl units and attached to coenzyme A. Acetyl CoA feeds into the
tricarboxylic acid cycle, or TCA cycle for short
The purpose of the TCA cycle is to take NAD+, add some H+ and electrons and gas off the carbon as carbon dioxide, CO2.

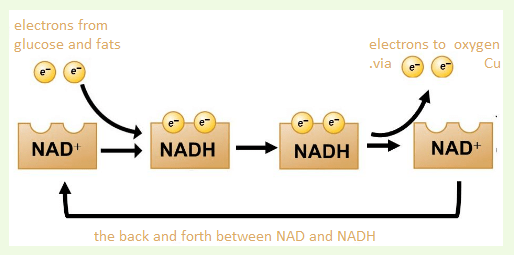
the electron transport chain
NADH feeds into the electron transport chain, also in the mitochondria. Copper is essential to make the final deliver of electrons from NADH (donuts) to oxygen, O2.
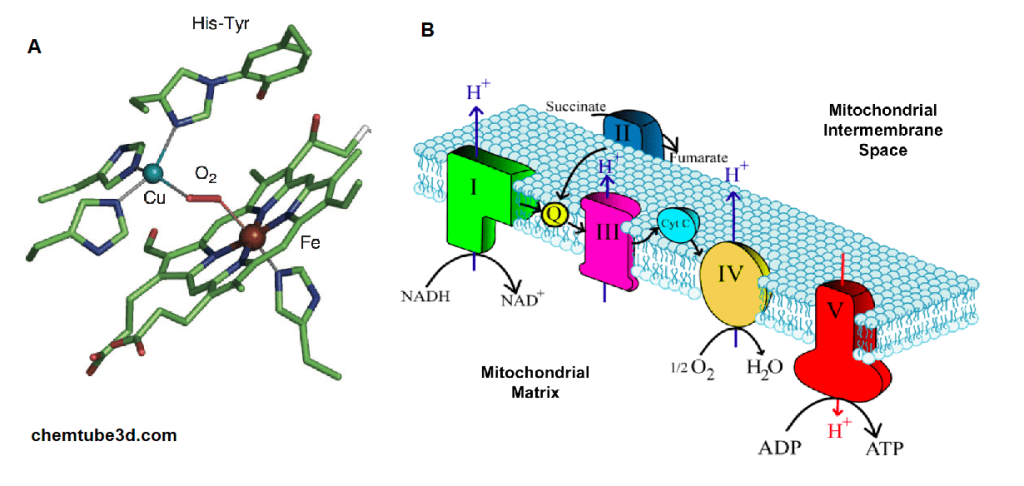
A. The active site of bovine cytochrome C oxidase contains a copper (Cu) and an iron (Fe) Both bind to oxygen, O2. Electrons from NADH flow through the chain to B. An
overview of the electron transport chain and cytochrome C oxidase in complex IV, where ½ O2 is reduced to H2O.Let’s move to the featured paper
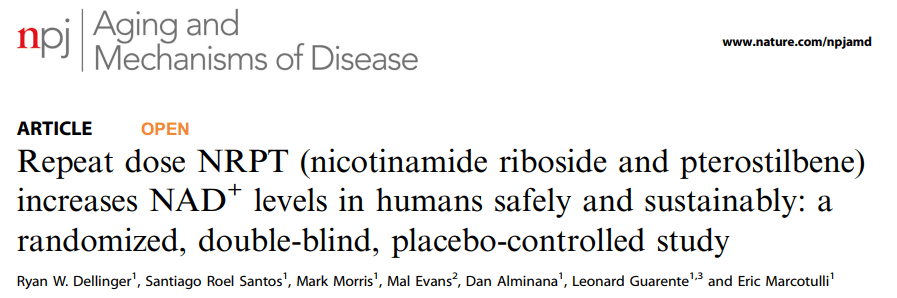
Dellinger RW, Santos SR, Morris M, Evans M, Alminana D, Guarente L, Marcotulli E. Repeat dose NRPT (nicotinamide riboside and pterostilbene) increases NAD+ levels in humans safely and sustainably: a randomized, double-blind, placebo-controlled study. NPJ Aging Mech Dis. 2017 Nov 24;3:17. PMC free article
Elysium Health, Inc, New York, NY USA Clinical trial performed by KGK Science.
Introduction
This clinical trial evaluated the ability of nicotinamide riboside and a polyphenol in blue berries called pterostilbene on their ability to increase NAD+ in plasma. PT is also a naturally occurring analog of resveratrol, a pholyphenol activator of the longevity enzyme sirtuin. Sirtuins are NAD+ consuming enzymes. See the cartoon in the summary. Sirtuins remove regulatory acyl groups from proteins. The authors reasoned that PT should be more bio available than resveratrol owing to more hydroxyl groups. ITT, intention to treat, is intended to avoid certain artifacts, but may introduce other issues.
Figure 1 the study design

A background image has been added to Figure 1 the trial design. Sirtuins are a family of enzymes that remove regulatory acetyl groups from enzymes by transferring them to adenosine diphosphate of NAD+. Niacin is released from NAD+ is what is left over. The PT component is anticipated to activiate sirtuin activity. The two components are anticipated to synergize deacetylase activity. A background image has been added to Figure 1 the trial design. Sirtuins are a family of enzymes that remove regulatory acetyl groups from enzymes by transferring them to adenosine diphosphate of NAD+. Niacin is released from NAD+ is what is left over. The PT component is anticipated to activiate sirtuin activity. The two components are anticipated to synergize deacetylase activity. Table 1 demographics
This post will not go into these details.
Aside: Measuring ATP levels, could we do better?
This post takes a skeptical approach to measuring just NAD+. We’ve already discussed that the precursor for NAD+, NADH, comes from efficient metabolism of donuts and other foods. Measuring ATP is something a bit more to the point when it comes to activities such as walking around the block.
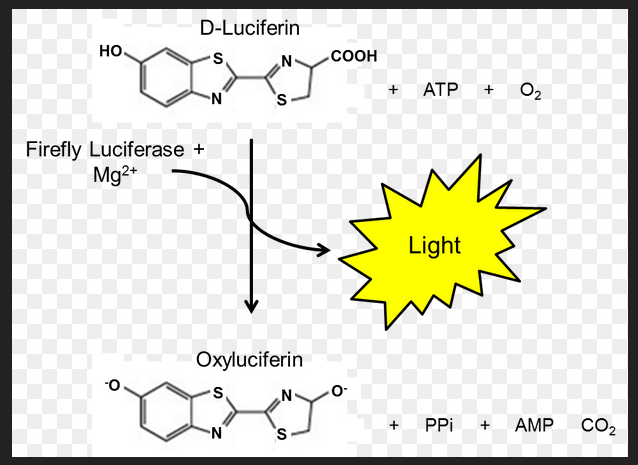
One common way to measure ATP levels is a firefly butt enzyme called luciferase. Luciferase takes D-luciferin, ATP, and oxygen to produce oxyluciferin, AMP, PPi, and carbon dioxide. BioMol.com is one of many companies that sells ATP detection kits. Naturally one also needs a way of measuring the light that is produced. ATP is not the exact same thing as cellular respiration, but it is dang close. 38 ATP from one molecule of glucose. 2 ATP from glycolysis and 36 from the electron transport chain.
Figure 2 NAD+ levels in whole blood
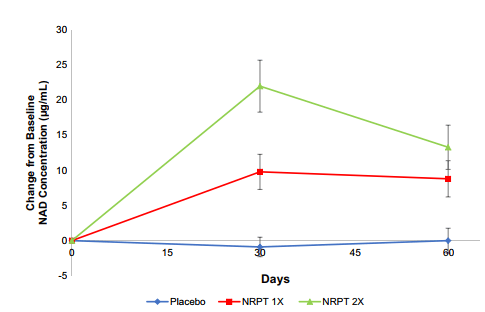
Fig. 2 NRPT increases NAD+ levels. Total NAD+ levels were measured in whole blood from all subjects at day 0 (baseline), day 30, and day 60. Graph depicts change from baseline NAD+ concentration (μg/ml) for Placebo (blue diamonds), NRPT 1X (red
squares) and NRPT 2X (green triangles). Data shown is the mean ±
standard deviation of the mean for each time pointTotal NADH and NAD+ would be interesting.
Table 2 results
The patient variability is pretty large just because we are all so different. Some fancy statistics had to b be used to detect affects. The lower the P-value the more confident we are that the observed difference is not due to random chance. Generally the cut off is p<0.05.
Placebo NRPT 1X NRPT 2X Between Group P-Value Mean ±SD (n) Mean ±SD (n) Mean ±SD (n) NAD Concentration (μg/mL) Day 0 Baseline 22.0 ± 8.1 (40) 22.5 ± 11.9 (39) 23.8 ± 9.0 (38) 0.619λ § Day 30 21.1 ± 8.6 (40) 32.2 ± 13.4 (40) 45.8 ± 20.8 (38) <0.001λ § Day 60 End of Study 22.0 ± 7.8 (40) 31.5 ± 16.3 (40) 37.2 ± 16.7 (38) <0.001λ § Change from Day 0 to Day 30 -0.9 ± 8.8 (40) 9.8 ± 15.6 (39) a 22.0 ± 22.8 (38) a <0.001λ Δ Change from Day 0 to Day 60 0.0 ± 11.2 (40) 8.8 ± 16.1 (39) a 13.3 ± 19.4 (38) a <0.001λ Δ Table S3: Basis increases NAD+ in the PP Population (N = 113). § Between group comparison were made using ANOVA.
Δ Between group comparisons were made using ANCOVA adjusting for baseline.lThe square root transformation was required to achieve normality for all change from Day 0 to Day 30 and Change from Day 0 to Day 60 data.a denotes significant difference compared to placebo as assessed by the Tukey-Kramer post-hoc test.Probability values P≤0.05 are statistically significant.This is a direct quote from the publication:
“It is not clear why the NRPT 2X group showed the partial decline at 60 days, but it is possible that extraordinarily high levels of NAD+ can induce homeostatic mechanisms to restrain further increases. One possible mechanism is induction of NAD+ degrading enzymes, such as CD38“
It should be noted that sirtuins are also NAD+ degrading enzymes too, hence the PT blueberry extract.
Table 2, liver function
Elysium was looking for liver enzymes in the blood and and other signs of damage to test the hypothesis that the formulation causes hepatocytes to die and release their enzymes into the blood. The product was concluded to be liver safe.
Table 3 Cholesterol stuff, plus introduction
Table 3, Sirt1 and cholesterol blood stuff
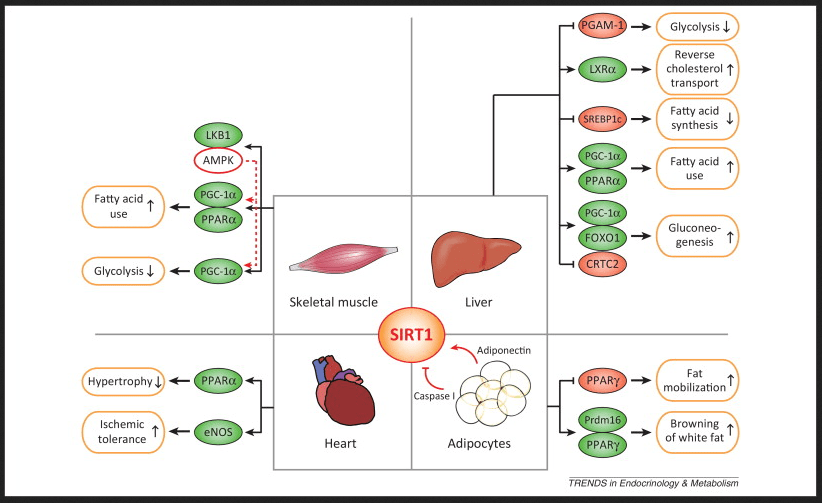
https://www.cell.com/cms/attachment/2011038768/2033498943/gr1.jpg Link to the source of this image showing the red and green oval transcription factors that control which genes get transcribed into mRNA and ultimately translated into protein that controls parameter Note that sirtuins promote the metabolism of the fat component of donuts but not so much the carbohydrate portion via glycolysis.
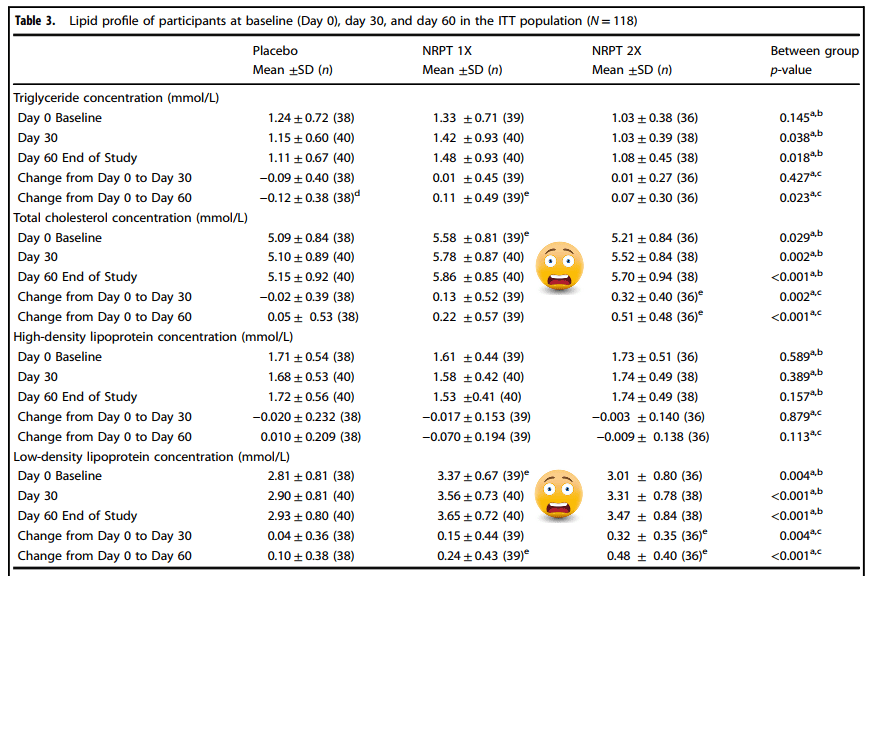
Probability values p ≤ 0.05 are statistically significant The logarithmic transformation was required to achieve normality b Between group comparisons were made using ANOVA (no adjustment for baseline) c Between group comparisons were made using ANCOVA adjusting for baseline
d Denotes significant within-group comparisons were made using the paired Student t-teste Denotes significant difference compared to placebo as assessed by the Tukey-Kramer post-hoc testTable 4, stratifying for BMI
In very simple terms, the authors thought that perhaps the starting BMI (body mass index) might have an influence on cholesterol index related parameters..
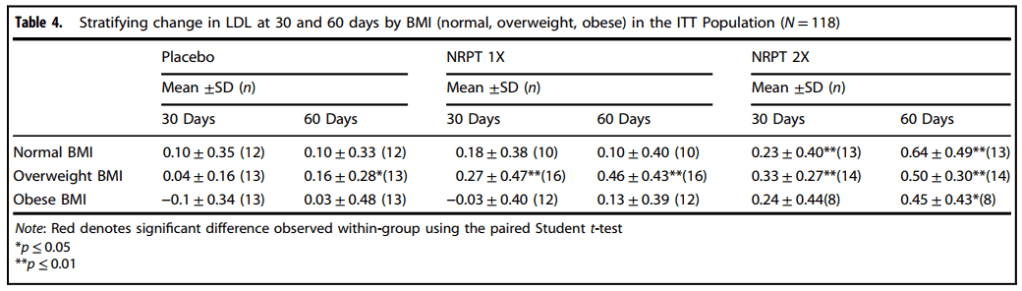
These data are still somewhat of a concern.
Other data not presented in main paper
There were no changes relative to baseline at day 30 or 60 in heart rate or blood pressure in any group except in the NRPT 1X group, where diastolic blood pressure decreased
significantly at day 60 (Table S4, not shown).
NRPT and mobility
To assess mobility in the study, a 30-second chair stand test and 6- minute walk test were employed. Higher numbers in the chair stand test indicate more lower body strength.30 sec chair stand Placebo NRPT 1X NRPT 2X Between Group P-Value Mean ±SD (n) Mean ±SD (n) Mean ±SD (n) Number of Stands from Chair in 30 Seconds Day 0 Baseline 13.2 ± 4.5 (40) 13.0 ± 3.1 (40) 13.4 ± 3.5 (33) 0.896* § Day 30 13.5 ± 4.4 (40) 12.9 ± 3.2 (40) 14.0 ± 3.8 (33) 0.612* § Day 60 End of Study 13.6 ± 5.4 (40) 13.2 ± 3.4 (40) 14.4 ± 4.2 (33) 0.470* § Change from Day 0 to Day 30 0.32 ± 2.03 (40) -0.05 ± 2.28 (40) 0.64 ± 1.54 (33) 0.450*∆ Change from Day 0 to Day 60 0.50 ± 3.08 (40) 0.28 ± 2.72 (40) 1.03 ± 2.14 (33)b 0.406*∆ Table S5: Physical Performance Measured by the 30 Second Chair Stand Test at Baseline (Day 0), Day 30, and Day 60 for Participants in the PP Population (N = 113). n, number; SD, standard deviation; Min, minimum; Max, maximum.§ Between group comparisons were made using ANOVA (no adjustment for baseline)Δ Between group comparisons were made using ANCOVA adjusting for baseline.δ Within group comparisons were made using the paired Student t-test.b Denotes significant within group comparisons were made using the paired Student t-test * The logarithmic transformation was required to achieve normalityProbability values P≤0.05 are statistically significant.
The 6-minute walk test measures distance (in meters) an individual can walk at a normal pace for 6 min. The NRPT 1x dose was kind of funny with regards to cholesterol and other lipid parameters, The walking test is even more troubling. Why is it that these participants can walk less on the 1x dose?walk test with significant results Placebo NRPT 1X NRPT 2X Between Group P-Value Mean ±SD (n) Mean ±SD (n) Mean ±SD (n) Distance Walked (m) Day 0 Baseline 459 ± 79 (40) 436 ± 96 (40) 455 ± 69 (33) 0.422 § Day 30 466 ± 87 (40) 425 ± 103 (40) 470 ± 73 (33) 0.053 § Day 60 End of Study 475 ± 78 (40) 429 ± 89 (40) 489 ± 74 (33) 0.005 § Change from Day 0 to Day 30 7 ± 64 (40) -11 ± 90 (40) 16 ± 46 (33) 0.105∆ Change from Day 0 to Day 60 16 ± 58 (40) -7 ± 98 (40) 34 ± 64 (33)b 0.007∆ Table S6: Physical Performance Measured by the 6 Minute Walk Test at Baseline (Day 0), Day 30, and Day 60 for Participants in the PP Population (N = 113). n, number; Min, minimum; Max, maximum; SD, standard deviation. § Between group comparisons were made using ANOVA (no adjustment for baseline)Δ Between group comparisons were made using ANCOVAadjusting for baseline.δ Within group comparisons were made using the paired Student t-test.b Denotes significant within group comparisons were made using the paired Student t-test Probability values P≤0.05 are statistically significant.
In summaryIn summary, Sirt1 appears to be metabolically regulated. Elysium seems to be seeing exciting things that may have something to do with their resveratrol analog. We propose that a BioCu1 copper supplement and ATP measurements could be the next step. We’ve discussed the role of cd38, mitochondria function, sirtuins, and NAD+ back when niacin was in the Covid news.
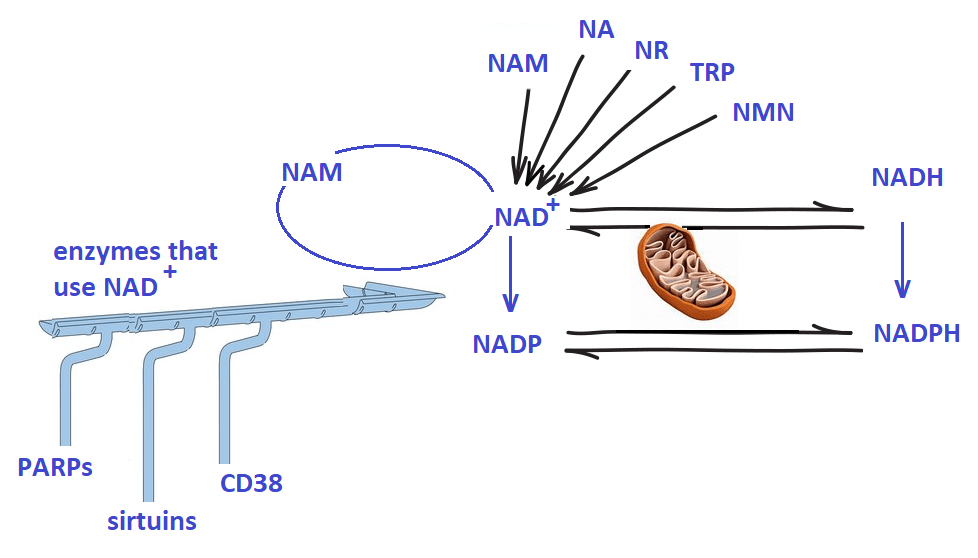
Note the role of both NAD+ and ATP We have not discussed the anti-oxidant enzymes that use NADP/NADPH as a cofactor. Elysium may have seen a greater boost in redox health if the analysis has been expanded.
-
Aging, telomeres, hair
We had thoughts, at one time, of measuring telomere length in cultured fibroblasts as a index of aging. Why not cultured hair follicles since so many customers report restoration of pigmentation in their hair when consuming BioCu1. Hair follicles are also more mitochondria reliant for their daily activities… unless the aging process is taking its toll. The more we thought about the proper controls, the harder and more expensive things seemed. Perhaps we are over thinking the story.
- Background Cu1 vs Cu2, don’t forget niacin
- Oxidative stress and telomere length
- Exposure to Cu1 and Cu2
- Aging studies: hair follicles in culture
- Follicles from hairs that have turned dark
Background Cu1 vs Cu2, don’t forget niacin
- Ctr1 describes the Ctr1 Cu(I) transport channel. Cu(II) does not get transported until it is reduced to Cu(I). We have always assumed that Cu(I)niacin is more bioavailable than Cu(II) sulfate.
- Copper chaperones deliver Cu in the +1 oxidation state to their target enzymes. This is why we always thought, but never proved, that our copper is better.
- Niacin in the Covid describes how we began to realize that Cu(I) and niacin likely work together.
- Fatty Liver in Cows expands on the interplay between niacin and copper.
Oxidative stress and telomere length
von Zglinicki T. Oxidative stress shortens telomeres. Trends Biochem Sci. 2002; 27: 339-344 Sci-Hub free paper
Some images were imported of the position of telomeres in a chromosome and examples of telomere shortening with cell divisions. Stem cells, red, keep a fairly constant telomere length. The moment a cell differentiates into a somatic cell (green) with a designated function, telomeres start to shorten. The Hayflick limit (HL) is the number of times a cell may divide before division stops. Crises (blue) may alter gene expression and increase telomere length. PD is the population doubling. (b) The downward green arrows in the von Zglinicki Fig 1 indicates that stress can shorten telomere length more rapidly than normal population doubling. (c) High stress and/or lack of good oxidative defenses, indicated by the width of the blue triangle, can send the telomere length into an almost vertical downward spiral. Good oxidative stress defense can send the telomere length response to
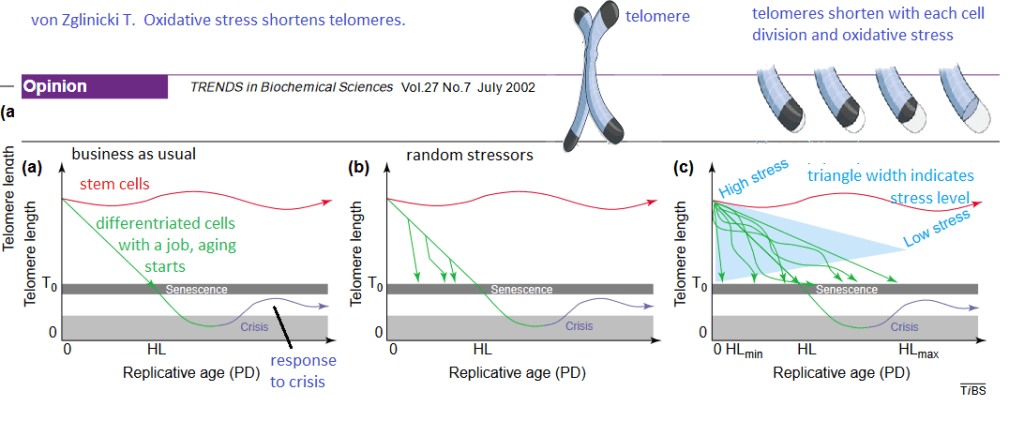
Though this review was published over 20 years ago, it was very insightful and extremely useful for generating hypotheses. The Cu(I) of BioCu1 supplies Cu/Zn superoxide dismutase with a necessary cofactor. Niacin can be a precursor of NADH and NADPH, a cofactor for many anti-oxidant enzymes.
Exposure to Cu1 and Cu2
These are some thoughts on how we might design a cell culture experiment in fibroblasts or maybe even hair follicles in culture. Fibroblasts from individual patients and hair follicles could be studied.
- For starters we will need the culture medium without red dye that is used to indicate pH. We will add the same molar amount of Cu1 used in previous cell culture studies to the culture medium. We will take UV/Vis spectrophotometer scans every one minute for 15 minutes. We will calculate the time window in which we can keep the Cu1 in culture medium on the cells with less than 10% being oxidized to Cu2. (Cupric copper is blue).
- We could add both coppers to cultured follicles and/or fibroblasts for the designated time.
- After the incubation period, the copper containing media could be moved and the copper adhering to the outsides of the cells rinsed away.
- As another control for the Cu1 , we might want to consider the same molar amount of niacin without the copper. As a control for the cupric sulfate we might want to add a non copper sulfate.
- Do we have a way of measuring the copper that was taken up by the cells?
- The next step might be to measure ATP content.
This is already starting to seem like a considerable amount to perform fibroblast or cultured hair follicle experiments. Others are using hair follicles in culture to study telomere aging.
Aging studies: hair follicles in culture
Stone RC, Aviv A, Paus R. Telomere Dynamics and Telomerase in the Biology of Hair Follicles and their Stem Cells as a Model for Aging Research. J Invest Dermatol. 2021 Apr;141(4S):1031-1040. free article
- This review proposed that telomere length dynamics play an important role in the biology of the hair follicle (HF),
- HF are mini organs that show an intriguing aging pattern in humans.
- The pigment producing unit ages quickly but epithelial stem cells (ESC) are more aging resistant. Telomerase deficient mice with short telomeres display an aging phenotype of hair graying and hair loss that is attributed to impaired HF ESC mobilization.
hair follicles are complicated organs

Figure 1 Aging resistance in the cycling human HF. Anti oxidative capacity of the human HF is attributed to ROS scavenging molecules (e.g., catalase, melatonin), oxidative damage response controls (e.g., NRF2), synthesis of neuro hormones influencing mitochondrial function (TRH/TSH), and various DNA repair mechanisms. Similarly, the roles for telomerase and IGF-1 are proposed in the context of TL and TA in the HF. HF, hair follicle; NRF2, nuclear erythroid factor 2- related factor 2; TA, telomerase activity; TL, telomere length;
Reactive oxygen species (ROS) not defined
The lay reader, and even trained biologists, would have to do so much background reading to properly understand what is being said in this review. This review does not discuss the anti-oxidant enzyme Cu/Zn super oxide dismutase simply because no one can think of everything at once.
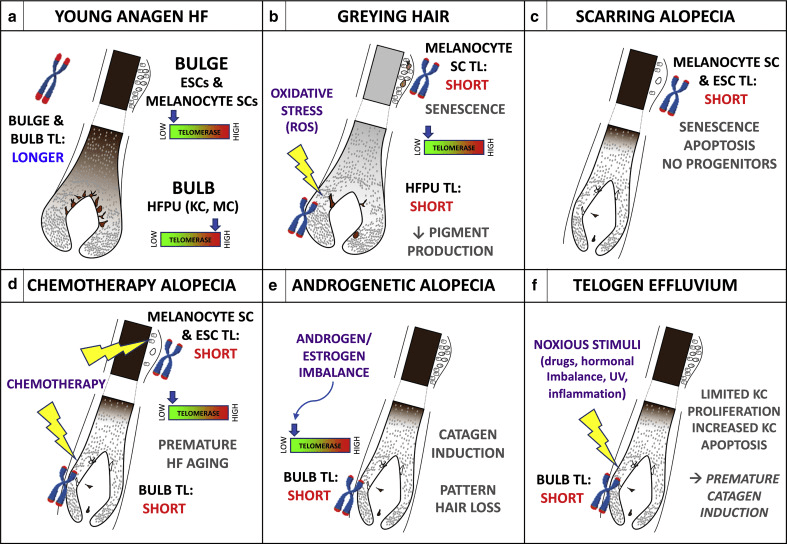
Figure 2 Proposed roles of TL in human HF biology and pathology.
(a) Young anagen HF with longer telomeres and low TA in the bulge region containing ESC, melanocyte SC and longer telomeres but high TA in the proliferative bulb region containing KC and MCs of the HFPU. (b) In graying hair, bulge melanocyte SCs with short telomeres senesce and limit new HFPU formation, whereas the ROS-sensitive aging HFPU accumulates endogenous and exogenous oxidative damage that shortens telomeres and impairs pigment production; induction of TA might prevent age-associated graying.(c) In cicatricial (scarring) alopecia, critically short telomeres in bulb SCs trigger senescence and apoptosis; with no progenitors and transient-amplifying cells, HF cycling and hair growth are irreversibly halted.
(d) Chemotherapy (e.g., taxanes) damages telomeres and/or low TA HF SCs and also shortens telomeres of the stress-sensitive HFPU. Pretreatment with TA inducers might mitigate chemotherapy-induced HF aging and/or graying and hair loss. (e) Low HF aromatase activity may lower local estrogen and/or progesterone levels; loss of transcriptional stimulation of hTERT production leads to shortened telomeres and premature HF entry into catagen, contributing to AGA. (f) Noxious stimuli shorten hair matrix KC telomeres, limiting cycling of transient-amplifying cells and increasing apoptosis, leading to anagen termination and/or catagen induction and telogen effluvium. AGA, androgenetic alopecia; ESC, epithelial stem cell; HF, hair follicle; HFPU, hair follicle pigmentary unit; KC, keratinocyte; MC, melanocyte; SC, stem cell; TA, telomerase activity; TL, telomere length.This is all very interesting, but we’ve got to
Follicles from hairs that have turned dark
We have so many anecdotal stories of customers who have had their original hair color return after taking BioCu1. Why not just analyze the follicles from such hairs that have turned dark and compare them with hair follicles from the same customer before BioCu1.
-
Hair Growth
For an overview of gray hair and a few works on the mitochondria requirement to grow hair, visit the gray hair post. The starting point of this post is Women’s World 8 essential oils for hair growth. The strategy is to do a PubMed search on each and then figure out which phytochemicals are in each and what their receptors are.
Rosemary oil
It took six months to see a difference in androgen associated hair loss. [1]
- Panahi Y, Taghizadeh M, Marzony ET, Sahebkar A. Rosemary oil vs minoxidil 2% for the treatment of androgenetic alopecia: a randomized comparative trial. Skinmed. 2015 Jan-Feb;13(1):15-21. PMID: 25842469. PubMed
pumpkin seed oil
In a 3 month clinical trial PSO showed promise in treating female pattern hair loss. In this 24 week clinical trial with men with androgen alopecia Mean hair count increases of 40% were observed in PSO-treated men at 24 weeks, whereas increases of 10% were observed in placebo-treated men (P < 0.001). Adverse effects were not different in the two groups.

The phytochemical in question for pumpkin seed oil appears to be a phyto steroid testosterone mimetic [3] - Ibrahim IM, Hasan MS, Elsabaa KI, Elsaie ML. Pumpkin seed oil vs. minoxidil 5% topical foam for the treatment of female pattern hair loss: A randomized comparative trial. J Cosmet Dermatol. 2021 Sep;20(9):2867-2873 PubMed
- Cho YH, Lee SY, Jeong DW, Choi EJ, Kim YJ, Lee JG, Yi YH, Cha HS. Effect of pumpkin seed oil on hair growth in men with androgenetic alopecia: a randomized, double-blind, placebo-controlled trial. Evid Based Complement Alternat Med. 2014;2014:549721. PMC free article
- Teeranachaideekul V, Parichatikanond W, Junyaprasert VB, Morakul B. Pumpkin Seed Oil-Loaded Niosomes for Topical Application: 5α-Reductase Inhibitory, Anti-Inflammatory, and In Vivo Anti-Hair Loss Effects. Pharmaceuticals (Basel). 2022 Jul 27;15(8):930. PMC free article
peppermint oil
Only one abstract was found on PubMed which focused on a type of hair loss specific to African American women which stated that there was not great evidence that this substance was effective.
Ezekwe N, King M, Hollinger JC. The Use of Natural Ingredients in the Treatment of Alopecias with an Emphasis on Central Centrifugal Cicatricial Alopecia: A Systematic Review. J Clin Aesthet Dermatol. 2020 Aug;13(8):23-27. Epub 2020 Aug 1. PubMed
lavender oil
Also see the thyme oil section for the Turkish combination study.
clary sage oil
I could find nothing on PubMed concerning clary sage oil and hair loss. Titles indicate it is calming.
cedarwood oil
Also see the thyme oil section for the Turkish combination study.
tea tree oil
A study out of Saudi Arabia tested the hypothesis that adding tea tree oil would improve hair growth in male androgenic alopecia. These authors used a multimodal microemulsion of minoxidil (a dihydrotestosterone antagonist), diclofenac (a nonsteroidal anti-inflammatory agent), and tea tree oil which they viewed as an anti-infective agent. This publication reports stability factors that might be of interest to Mito. The good news is that significant hair growth was recorded after 32 weeks of use compared to the placebo and traditional medication.
Farouk Sakr F, Gado A, Mohammed H, Ismail AAN. Preparation and evaluation of a multimodal minoxidil microemulsion versus minoxidil alone in the treatment of androgenic alopecia of mixed etiology: a pilot study. Drug Des Devel Ther. 2013;7:413. [PMC free article]
thyme oil
The Ezekwe review is the only thing that showed up on PubMed {1] This is not to say the research has not been performed. The Ezekwe review lead to a Turkish study of a combination of essential oils that are to be rubbed into the scalp. [2] The active group in this clinical trial received a compound available in Turkey: Revigen® Areata solution (Mikro-Gen Co, Istanbul, Turkey) which has essential oils, Thyme vulgaris, Lavandula agustifolia, Rosmainus officialis and Cedrus atlantica and mixed in carrier oil which was a combination of jojoba and grape seed oils.
- Ezekwe N, King M, Hollinger JC. The Use of Natural Ingredients in the Treatment of Alopecias with an Emphasis on Central Centrifugal Cicatricial Alopecia: A Systematic Review. J Clin Aesthet Dermatol. 2020 Aug;13(8):23-27. Epub 2020 Aug 1. PMC free article
- Özmen I, Çalişkan E, Arca E et al. Efficacy of aromatherapy in the treatment of localized alopecia areata: a double-blind placebo controlled study. Gulhane Med J. 2015;57:3. free article
If the particular source of thyme oil contains the terpene thymol it might be effective as a skin permeability enhancer to get active ingredients past the stratum corneum.
Holistic approach: biotin, niacin,more
A very recent review mentioned popular use of biotin in products for hair regrowth but seemed to be much more optimistic about niacin. [1] The corresponding author of this paper is Raja Sivamani MD, who usually publishes with four or five institutes as his home base. These include a medical school and several research centers. Raja Sivamani has been part of numerous clinical trials.
College of Medicine, California Northstate University, 9700 W Taron Dr, Elk Grove, CA 957
Integrative Skin Science and Research, 1495 River Park Drive, Sacramento, CA
Pacific Skin Institute, 1495 River Park Dr Suite 200, Sacramento, CA
Department of Dermatology, University of California-Davis, Sacramento, CAHere is what the review [1] has to say about B vitamins:
B Vitamins
B vitamins, including niacin (vitamin B3), biotin (vitamin B7), and folic acid (vitamin B9) have been implicated in hair loss. For example, in addition to the well-documented pellagra characteristic of niacin deficiency, alopecia is an additional common clinical finding associated with deficient niacin [43]. However, no studies have directly assessed niacin levels among patients presenting solely with hair loss, and studies have found no significant difference in folate levels between alopecia patients and control subjects [57,58].
“Biotin, a cofactor for carboxylation enzymes with dietary sources including protein, has been more extensively assessed for effects on hair parameters, and it is included in a variety of supplements or serums intended for hair health [44]. Genetic biotin deficiency is associated with severe dermatitis and alopecia (infantile) and sparse or absent scalp, eyebrows, and eyelash hair (infantile). Similarly, acquired biotin deficiency is characterized by alopecia and brittle nails [43]. A 2016 study assessed serum biotin levels in women with self-reported hair loss and found 38% of patients reported a biotin deficiency [59]. However, this study did not include matched controls.
Despite many misconceptions, biotin functions to increase hair strength, rather than hair growth. Furthermore, biotin can interfere with troponin and thyroid testing. For example, excess serum biotin can result in a falsely low TSH level [60], and unnecessary supplementation can lead to missed cardiac events [61]. Yet, biotin supplement use has depicted increasing trends from 1999 to 2016; a cross-sectional survey study found self-reported use of biotin at 1 mg/d or greater to increase from 0.1% (95% CI 0.0–0.05%) in 1999 to 2.8% (95% CI 1.9–3.9%) in 2015–2016 [61].
Despite biotin’s popular inclusion in marketed hair supplements, there is no indication that biotin supplementation should be used among healthy individuals [43]. While biotin supplementation has shown benefit specifically among cases in which acquired or inherited causes of biotin deficiency are identified, there is insufficient evidence supporting supplementation among healthy individuals who are not deficient [62]. Thus, vitamin B testing may only be clinically useful in cases of suspected biotin deficiency, where biotin supplementation may improve the clinical condition.”

Morbus alba, otherwise known as white mulberry, is an herb that has been shown to influence the hair growth cycle 3.2.3. Light-Based Approaches “Low level light therapy refers to therapeutic exposure to low levels of red and near infrared light [118]. Studies have demonstrated increased hair growth in mice with chemotherapy-induced alopecia and AA, in addition to both men and women human subjects. Proposed mechanisms of efficacy include stimulation of epidermal stem cells residing in the hair follicle bulge and promoting increased telogen to anagen phase transition [119].” Note: this is near infrared light that I’ve written about in another post several years ago because I thought there’s be synergy with cuprous niacin. Red Light Post.
Section 3.3 on platelet rich plasma might be a good thing to discuss with Charlie Barker’s neighbor at the Flagstaff incubator.
- Natarelli N, Gahoonia N, Sivamani RK. Integrative and Mechanistic Approach to the Hair Growth Cycle and Hair Loss. J Clin Med. 2023 Jan 23;12(3):893. PMC free article
-
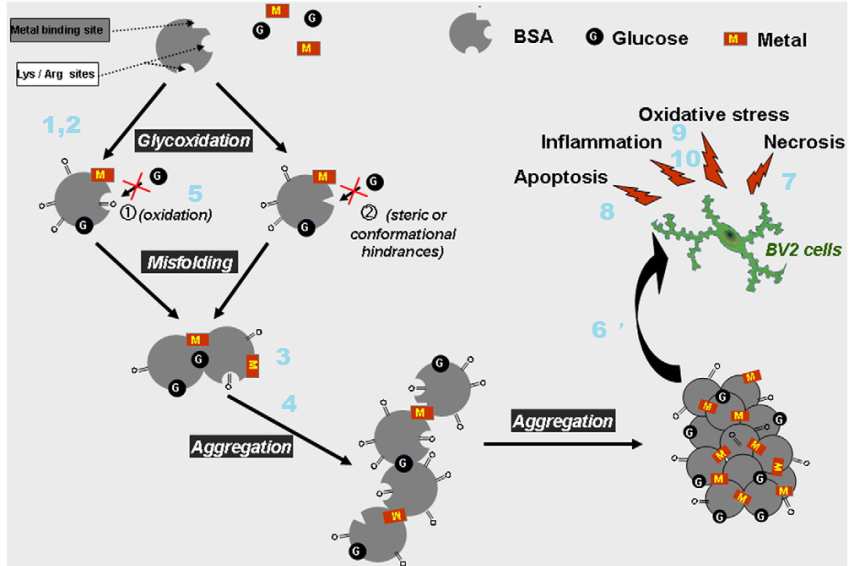
Cu(II) and advanced glycation end products
A travel back in time [1,2]
We have known that Cu(II) is potentially toxic for a long time. The year is 2002. We have only recently appreciated the role of nitric oxide in relaxing our blood vessels. The Nobel Prize in medicine for this discovery was awarded in 1998.
- Glycated albumin binds three times as much Cu(II) and
- Copper bound to glycated albumin remains redox active. [1]
- Cu(II) glycated albumin causes the degradation of nitric oxide. [1] So what? We’ve covered Fenton/Haber-Weiss chemistry on this site. NADPH oxidase, ACE inhibitors for high blood pressure, the opposite of NO relaxing our blood vessels…
- Plasma copper of diabetic rats is approximately twice that in normal rat plasma. [1]
- The same is true for tail tendons of diabetic rats. [1]
- Implants coated with glycated albumin can chelate 5x as much Cu(II) as implants coated with non glycated albumin. [1]
We’ve covered the so called Maillard reaction in the polyol post. The same reaction that leads to advanced glycation end products (AGE) also leads to the browning of bread and other food chemistry sorts of things. In 2004 food scientists in Germany compared binding of Cu(II) and Zn(II) to N(epsilon)-fructose-lysine and N(epsilon)-carboxymethyl-lysine. The regions in squares were chemically blocked so that XCu(II) and Zn(II) could only bind to the side chains. [2] Cu(II), but not Zn(II), bound to both of these compounds. [2]
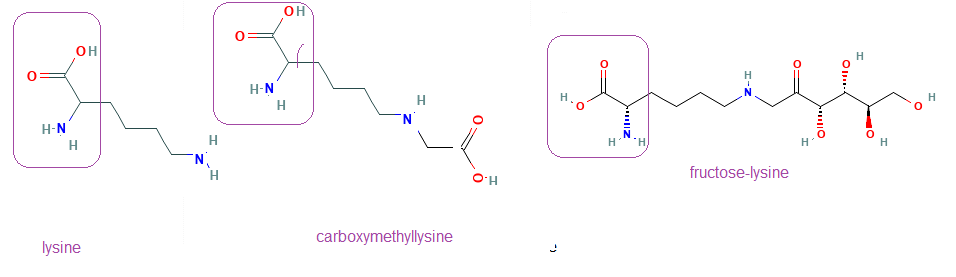
The regions in the boxes are part of the peptide bond in proteins. The modified lysine side chains bind Cu(II) In vitro adducts of Cu(II) to glycated lysines was identified in 2014. [3] The following paper may be difficult for non biochemists to follow. Short lay summaries will be given after each set of figures because this is important.
1 Cu binding to collagen and albumin
0.4 mM bovine serum albumin (BSA) was reacted with 100 mM D-glucose in a pH 7.2 buffer under sterile conditions and nitrogen gas in capped vials at 37 °C for seven weeks. Solutions of 1 mM, 3 mM of copper (CuCl2) or zinc(ZnCl2) ions were added during the glycation process. The proteins were dialyzed against MES buffer, pH 7.2 and stored at -20 °C. AGE-related modifications were determined by measuring glycophore fluorescence at 425 nm under excitation at 345 nm.
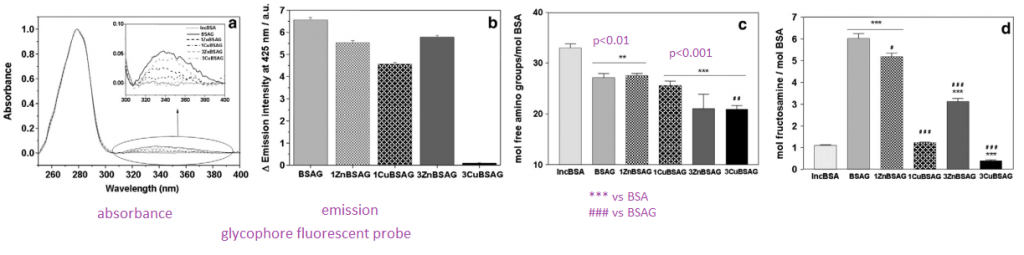
- Panel A We are looking at a fluorescent probe that binds to glycosyl groups. Glycophore absorbs in the 345nm long UV region of the spectrum. When light of this wavelength is used to illuminate the sample
- Panel B We see an emission in the 425 nm blue region of the spectrum. With the 3 mM Cu(II) sample we are seeing a decrease in groups that react with glycophore.
- Panel C Mock 37oC incubated samples have a fair decrease in the amount of free amino groups. What is binding to them, we do not know.
- Panel D For the case of BSA incubated with glucose and 3mM Cu(II) we are starting to suspect that Cu(II) might be blocking glycation..
The interactions between copper and glucose with this abundant blood protein are complicated.
2 Cu(II) changes protein structure

- Panel A When tryptophan is deep inside the core of a protein, it fluoresces in the long UV region of the spectrum when illuminated by shorter wavelength UV light. When the protein unfolds these tryptophans become solvent exposed and less fluorescent. All modified albumins underwent quenching of tryptophan fluorescence as a consequence of protein incubation with glucose. These data suggest that the protein is funfolding.
- Panel B When the tryptophan fluorescence was normalized to “normal” glycated BSA, a “blue shift” was seen in the maximal emission in the Cu(II) bound variety. This is considered indicative an the structure being different, perhaps due to a more exposed tryptophan.
- Panel C Analysis of momentum 1 (M1) relative to the tryptophan emission for different albumin samples was interpreted as indicative of the aggregation process. Aggregation was attributed to important conformational changes int the protein protein in the presence of copper(II) or zinc(II). A cartoon has been added of a protein unfolding, aggregating, and undergoing larger conformational changes.
- Panel D FTIR is used to measure secondary structure, i.e. alpha helices, beta sheets. Cartoons of alpha helices and beta sheets have been added. The idea is that Cu(II) is affecting global structure without affecting local structures.
The Cu(II) and Zn(II) glucose combination can cause this abundant blood protein to aggregate.
3 Cu(II) causes glycated albumin aggregation
This figure is a follow up to Figure 2c.

- Panel 3A Rayleigh scattering is a means of monitoring the formation of larger particles.
- Panel 3B this is an SDS PAGE gel that sorts proteins by size and charge. The charge is established by the charge of the amino acids and the size, which determines how much charged SDS detergent can coat it. In this publication “native†probably means without the reducing agent. BSA can form disulfide bonds with essentially double the apparent molecular weight.   Â
- Panel 3C Thioflavin T is a fluorescent probe that fluoresces when it interrelates into amyloid structures. A similar concept has been covered with Cu(II) induced IgG light chain amyloid AL post.
These aggregates also exhibit amyloid structures.
4 Cu(II) albumin aggregation part 2
Atomic force microscopy (AFM) is a type of scanning probe microscopy that uses a mechanical probe that touches or feels the surface with Piezoelectric elements that allow the touching to be recorded. . The information is gathered by “feeling” or “touching” the surface with a mechanical probe. ATM is more than 1000 times better than the optical diffraction limit.
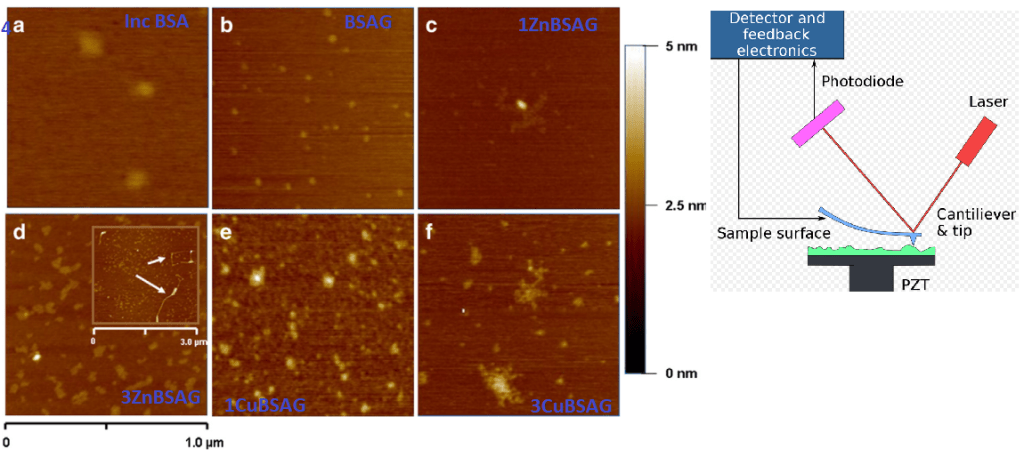
These Cu(II) and Zn(II) aggregates are clearly different.
5 Loss of free thiols and gain of carbonyls
While BSA has only one free thiol, this thiol can form a disulfide bond with the other single free thiol of a second BSA. This is suggested in Panel 3B. Protein carbonylation is another modification that can cause a protein to unfold and aggregate.
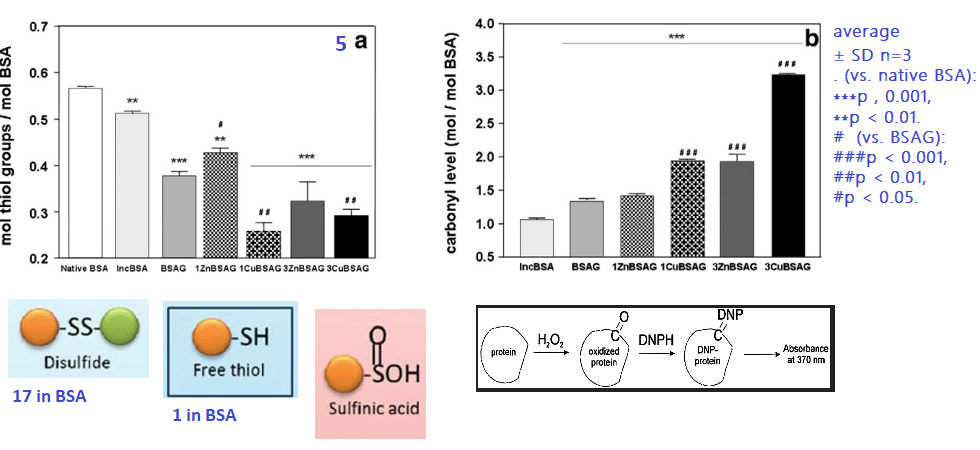
We don’t know if the loss of free thiols in the presence of Cu(II) and Zn(II) is due to direct binding and competition for the assay reagents or if some of these thiols have been oxidized to sulfinic acid and related compounds. It is interesting to note that redox inactive Zn(II) also increases protein carbonyls
The 3 mM Cu(II) and glucose combination is the most potent inducer of BSA carbonyls.
6 In vitro toxicology
The trolox equivalent anti-oxidant capacity (TEAC) assay is very much a Cu(II) dependent assay that measures anti-oxidant capacity relative to Trollox, a vitamin E analog.

7 Glycated BSAs kill cells
A moused microglia cell line, BV2 cells, were used for all assays. The MTT assay , in simple terms, indicates cells with healthy amounts of NADH. Cell viability was also measured by surface characteristics (forward light scattering) using a technique called flow cytometry.

Recall that the unbound glucose and Cu(II) or Zn(II), as the case may be, have been removed from the BSA mixture. This modified BSA is greatly reducing cell viability.
8 Necrosis vs Apoptosis
Propidium iodine (PI) is a dye that becomes fluorescent when it binds to DNA. It can only get to the cell nucleus when the cell membrane has been damaged. PI is the red dye outside the scell waiting to enter holes in the membrane in the second image. High fluorescence is indicative of necrotic cells. Healthy cells should have little or no PI fluorescence, lower half. Annexin V is a protein that binds to phosphatidyl serine, a phospholipid that appears of cells undergoing apoptosis, programmed cell death. Healthy cells should appear in the lower left quandrant.

These data indicate that BSA treated with 3mM Cu(II) and Zn(II) are more toxic than just the 1mM treatment groups. It should be remembered that this is not the raw metal but BSA treated with the raw metal and glucose! 3 mM is really not that much.
9 Reactive oxygen species and IL-6
The rationale for looking at IL-6 is not that clear. IL-6 was not mentioned more than twice in the Kamalov study: once in the methods and once in the results saying that 3ZnBSA induced it. [3]
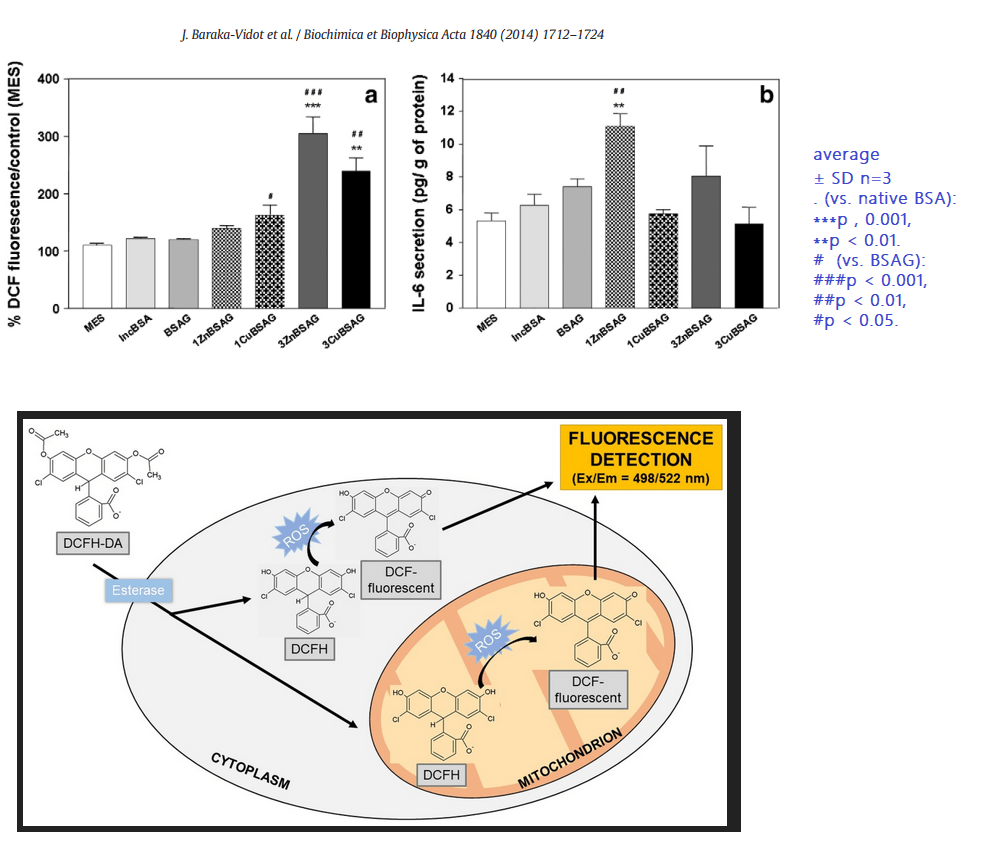
The confusing thing about use of IL-6 is that it is not a direct product of the inflammasome that we have discussed on this site. Some of these results are unexpected because Zn does not redox cycle like Cu, yet glycated BSA treated with Zn also causes the generation of ROS in a microglia cell line. These results are suggestive of an unfolded protein response that is speculated on this post, not necessarily by Kamalov and coauthors [3], to recruit macrophage.
Glycated albumin in the presence of Cu(II) and Zn(II) can induce cells to generate reactive oxygen species. A followup question(s) would be do Co(II), Mg(II), and Mn(II) have the same interaction with glycated albumin?
10 Cu sites on glycated BSA
Bovine serum albumin, BSA as we have been calling it, has several potential divalent cation binding sites that were discussed in the Kamalov publication. [3] These include a cysteine at position #34 in the N-terminus and several histidines in the metal binding site. The source of the images came from a publication on ischemia conditioned albumin.

This is bad news for diabetic cows. What about people?
A follow up study with human albumin
The followup study used human albumin and methylglyoxal as the lysine, arginine, and cysteine modifying small molecule. [4] In this publication the position was taken that about 10–15% of the total copper in blood is bound to albumin. The position was also taken that Cu(II) bound to albumin does not engage in Fenton chemistry. A technique called mass spectrometry was used to detect AGE in peptides from treated HSA. Cu(II ) at physiological and sub-physiological concentrations inhibited HSA glycation compared to Cu(II) free HSA. [4] At concentrations above 5 mg Cu(II) glycation was facilitated. [4]
Conclusion
Thank you for following us through this rather complicated study. While there is some evidence that copper may help those with T2D modulate their blood sugar, perhaps it would be better to avoid Cu(II) just in case the serum concentration exceeds that which is protective against albumin glycation. Too much of a Zn(II) supplement may also be bad. It is best to discuss these things with one’s healthcare provider.
References
- Eaton J.W., Qian M. Interactions of copper with glycated proteins: possible involvement in the etiology of diabetic neuropathy. Mol Cell Biochem. 2002;234-235(1-2):135–142. [PubMed]
- Seifert S.T., Krause R., Gloe K., Henle T. Metal complexation by the peptide-bound maillard reaction products N(epsilon)-fructoselysine and N(epsilon)-carboxymethyllysine. J Agric Food Chem. 2004;52(8):2347–2350. [PubMed]
- Baraka-Vidot J, Navarra G, Leone M, Bourdon E, Militello V, Rondeau P. Deciphering metal-induced oxidative damages on glycated albumin structure and function. Biochim Biophys Acta. 2014 Jun;1840(6):1712-24. free article
- Ramirez Segovia AS, Wrobel K, Acevedo Aguilar FJ, Corrales Escobosa AR, Wrobel K. Effect of Cu(ii) on in vitro glycation of human serum albumin by methylglyoxal: a LC-MS-based proteomic approach. Metallomics. 2017 Feb 22;9(2):132-140. [PubMed]
-
Brain Cu Deficiency and the polyol pathway
The polyol pathway is a two step process that converts glucose to fructose. This post explores how copper deficiency may make intermediates in this pathway worse.These findings have relevance to Alzheimer’s Disease.
Xu J, Begley P, Church SJ, Patassini S, McHarg S, Kureishy N, Hollywood KA, Waldvogel HJ, Liu H, Zhang S, Lin W, Herholz K, Turner C, Synek BJ, Curtis MA, Rivers-Auty J, Lawrence CB, Kellett KA, Hooper NM, Vardy ER, Wu D, Unwin RD, Faull RL, Dowsey AW, Cooper GJ. Elevation of brain glucose and polyol-pathway intermediates with accompanying brain-copper deficiency in patients with Alzheimer’s disease: metabolic basis for dementia. Sci Rep. 2016 Jun 9;6:27524. PMC free article
Introduction …. to Alzheimer’s Disease
“Alzheimer’s disease†(AD) may occur through interplay of environmental, genetic, and metabolic factors according to these authors. The authors list some pathological manifestations:
- Aβ-amyloid deposition
- neurofibrillary tangles comprising tau protein
- impaired cerebral glucose metabolism (‘hypo metabolism’) with insulin resistance and defective carbohydrate regulation
- oxidative stress and inflammation
- cerebrovascular amyloid angiopathy (CAA)
- enhanced advanced glycation end-product (AGE) formation
- defective copper regulation.
- defects in glucose uptake
The polyol pathway
The polyol pathway is a means of taking the six carbon sugar glucose with the aldehyde C=O group on the top of the structure to a ketone form, fructose, with the C=O on the second carbon from the top. In this way, the propensity to form advanced glycation end products is reduced.
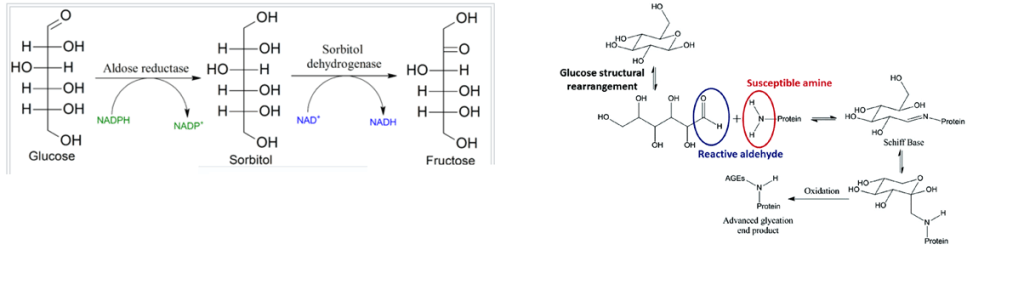
Copper should theoretically increase the utilization of glucose if copper is a pivotal player in brain glucose utilization simply by keeping the electron transport chain running.
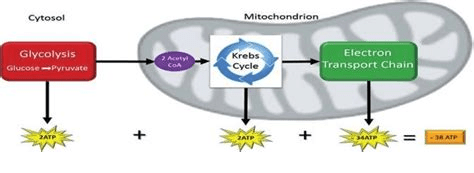
Our brains really need ATP. Copper is an important part of the electron transport chain that maximizes the yield of ATP from glucose. It makes sense that copper deficiency might lead to a pile up of glucose that then gets shunted to sorbitol and fructose.
The authors analyzed post-mortem tissue from seven brain regions of patients with AD and controls who did not have clinical evidence of dementia. The possibility exists that one or more patients had undiagnosed mild T2D or pre-diabetes. The authors reported that elevated glucose levels have previously been linked to altered tissue-copper regulation in the context of diabetes.
Regions most prone to damage in AD
- hippocampus
- entorhinal cortex
- middle temporal gyrus
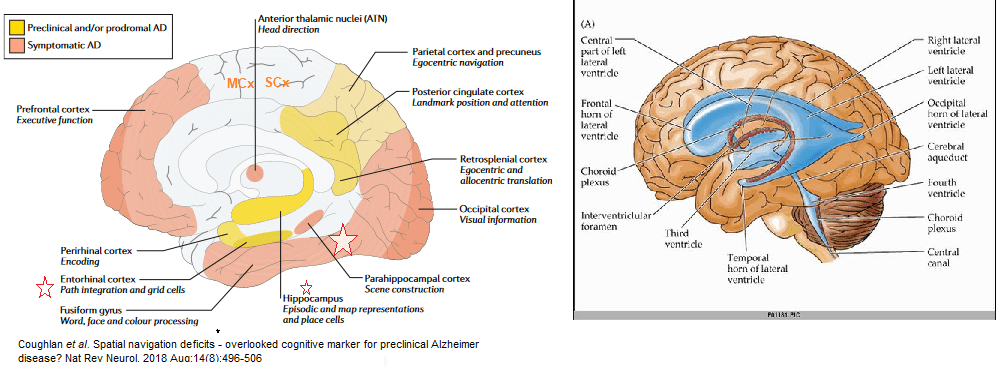
Three regions are less effected
- cingulate gyrus,
- sensory cortex
- motor cortex
The cerebellum is largely spared.
The inverse relationship between glucose and copper
Free glucose is elevated in AD brain, particularly in vulnerable regions where elevated glucose may well be linked to copper deficiency and tissue-damage.
- Overall mean brain-glucose levels were higher (P = 9.7 × 10−13) in AD vs controls
- Brain copper values lower (P = 1.6 × 10−8) in cases vs controls.
P values that the AD is different from the controls is written below the data points. There was modest evidence that overall brain-copper and brain-glucose values were inversely correlated (P = 0.021) in AD-patients but not controls
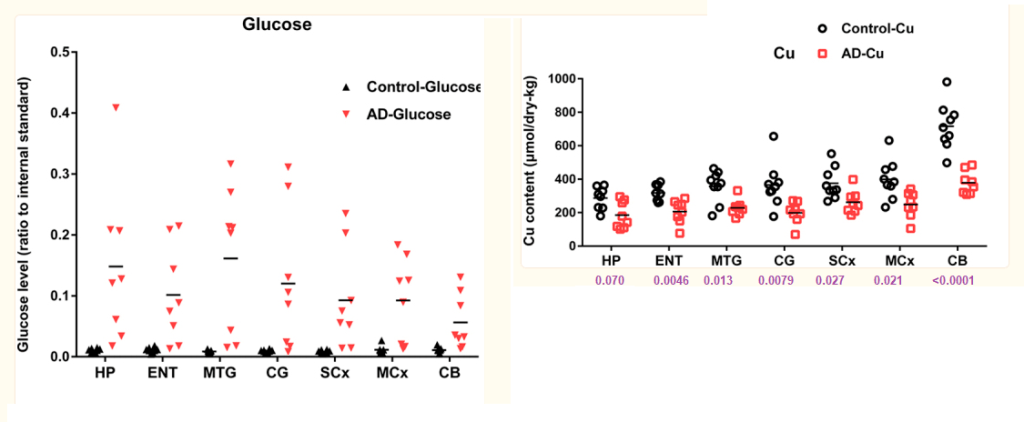
Brain-sorbitol and brain-fructose levels are also elevated in AD brain, consistent with increased polyol pathway flux. Defects may be in glucose utilization, the TCA cycle, or the electron transport chain.
The six carbon sugar pile up in AD and T2D
A further, mechanistically-related finding is that pan-cerebral brain-copper deficiency accompanies these glucose and polyol-pathway defects: elevated tissue-CML levels provide a molecular linkage between elevated brain glucose and copper deficiency.
Impaired neuronal glucose utilization could play a major role in tissue-damage in AD, possibly via defective mitochondrial metabolism caused by deficient copper supply to cytochrome C oxidase subunits I and II (COI and COII), leading to impaired function of cytochrome c oxidase. These findings provide a clear molecular linkage between mechanisms of tissue damage in AD and T2D.
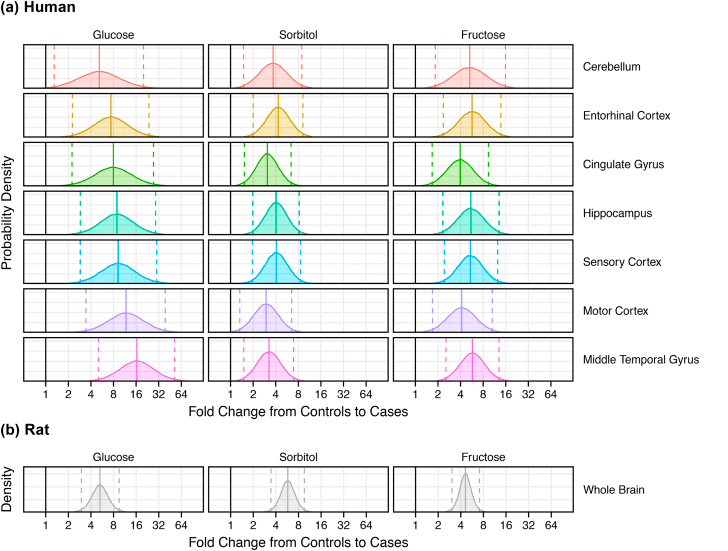
These “fold change” plots compare controls and disease in tissue from (a) each of seven brain regions from patients with AD (n = 9) and controls (n = 9) and (b) whole brain homogenates from diabetic (n = 7) and control (n = 7) rats.
- Complicated methods of analysis are not presented in this post.
- Solid lines are average fold changes.
- Dashed lines are the 95% Confidence intervals.
- The dark line at “1” represents a fold change of 1, that is “no change”
The process by which elevated brain glucose is linked to defective cell-copper uptake and intracellular transport to key copper proteins such as COI, COII, SOD1 and SOD3, may well provide a new target for diagnostic imaging or therapeutic intervention.
A few words of extreme caution
The same authors performed a followup study in post mortem brains of type 2 diabetes patients. Transition metal levels were measured, but glucose, sorbitol, and fructose were not. In contrast to AD patients, copper was found to be elevated in the hippocampus of T2D patients.
Philbert SA, Schönberger SJ, Xu J, Church SJ, Unwin RD, Cooper GJS. Elevated hippocampal copper in cases of type 2 diabetes. EBioMedicine. 2022 Dec;86:104317. PMC free article
This is a direct quote from the discussion of the data
“Despite copper’s key roles in some antioxidant processes (e.g., those catalysed by superoxide dismutase 1 and by complex IV), it can also participate in the production of harmful reactive oxygen species (ROS) via the Fenton and Haber–Weiss reactions. There is evidence that CuII can bind to advanced glycation end-products (AGEs) whilst retaining its redox–active properties. As protein glycation is significantly increased in T2D due to hyperglycaemia and polyol-pathway activation, the elevated hippocampal copper measured in the present study has the potential to cause increased AGE-CuII complex formation. The formation of AGE-CuII complexes could thereby lead to increased CuII-mediated ROS production, and decreased copper bioavailability for antioxidative pathways due to the selective binding of extracellular CuII with AGEs. However, CuII is less abundant than CuI, so the role that AGE-CuII complexes might play in the pathogenesis of T2D remains to be clarified.”
Stay tuned for more on these AGE-CuII complexes.