The purpose of this post is to convince Elysium Health and/or customers that they should consider added BioCu1 to one of their formulations proven to increase NAD+ levels, the topic of this post. What does NAD+ have to do with aging? According to the featured paper, “The maintenance of efficient cellular metabolism has been shown to play a pivotal role in the prevention of age-associated pathologies and in regulating longevity. ” On a philosophical note so much of cellular metabolism involves the shuttling of electrons.
This post will discuss why BioCu1 may add to the NAD+ boosting abilities of the Elysium formulation.
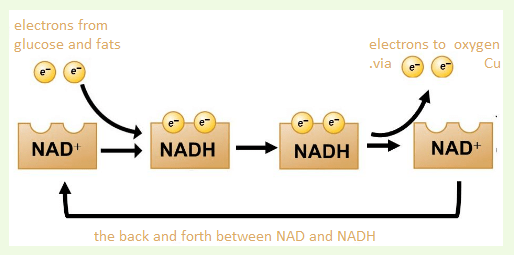
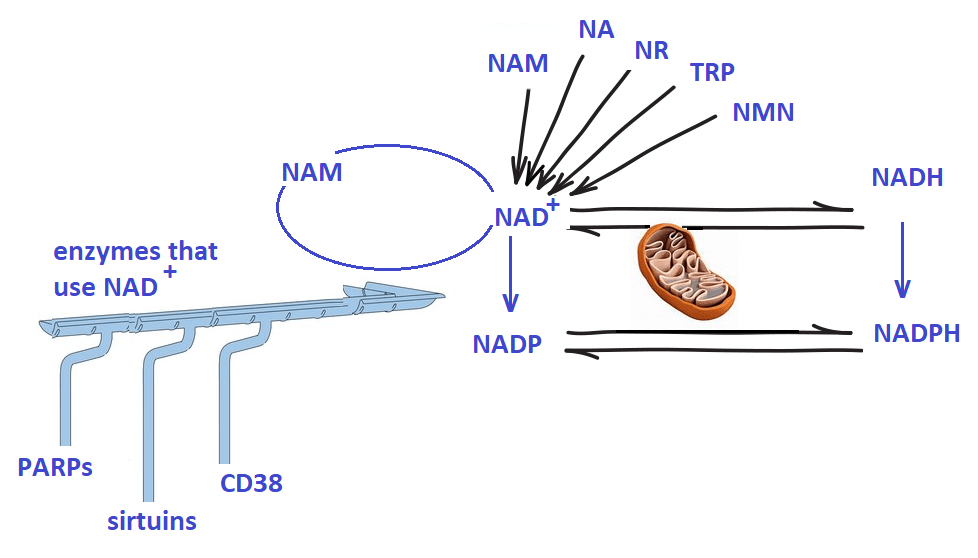
Where do electrons come from again?
Donuts! Connecting fuel to NAD+ and ATP!
Fats and carbohydrates are metabolized into two carbon acetyl units and attached to coenzyme A. Acetyl CoA feeds into the
tricarboxylic acid cycle, or TCA cycle for short
The purpose of the TCA cycle is to take NAD+, add some H+ and electrons and gas off the carbon as carbon dioxide, CO2.

the electron transport chain
NADH feeds into the electron transport chain, also in the mitochondria. Copper is essential to make the final deliver of electrons from NADH (donuts) to oxygen, O2.
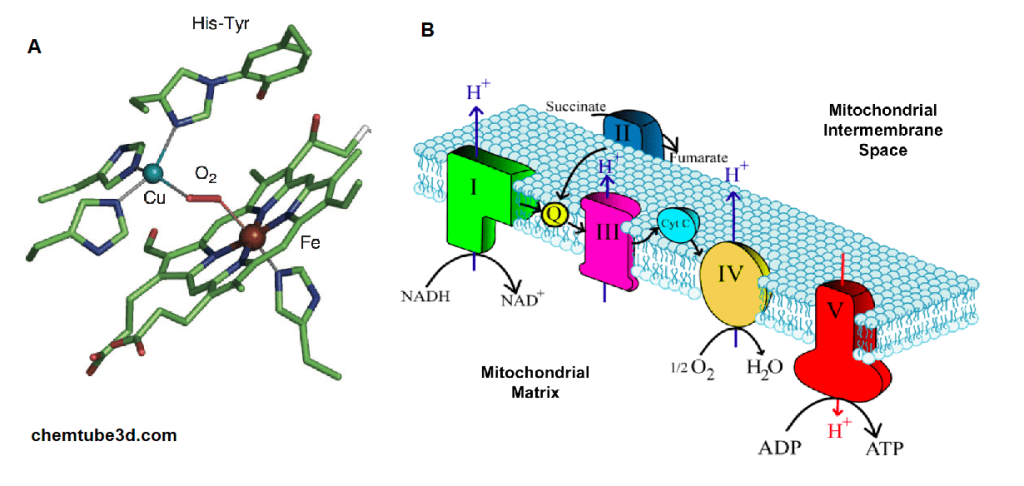
A. The active site of bovine cytochrome C oxidase contains a copper (Cu) and an iron (Fe) Both bind to oxygen, O2. Electrons from NADH flow through the chain to B. An
overview of the electron transport chain and cytochrome C oxidase in complex IV, where ½ O2 is reduced to H2O.
Let’s move to the featured paper
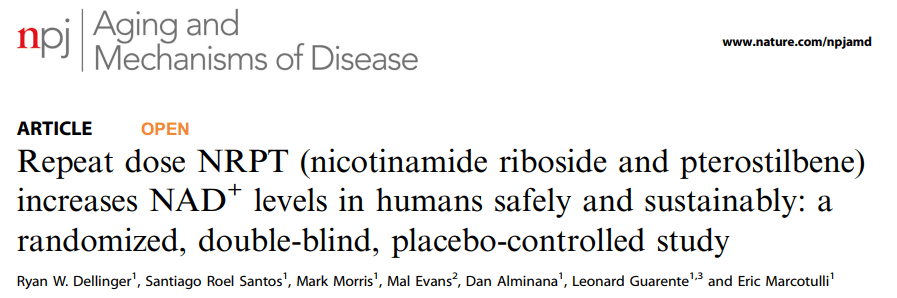
Dellinger RW, Santos SR, Morris M, Evans M, Alminana D, Guarente L, Marcotulli E. Repeat dose NRPT (nicotinamide riboside and pterostilbene) increases NAD+ levels in humans safely and sustainably: a randomized, double-blind, placebo-controlled study. NPJ Aging Mech Dis. 2017 Nov 24;3:17. PMC free article
Elysium Health, Inc, New York, NY USA Clinical trial performed by KGK Science.
Introduction
This clinical trial evaluated the ability of nicotinamide riboside and a polyphenol in blue berries called pterostilbene on their ability to increase NAD+ in plasma. PT is also a naturally occurring analog of resveratrol, a pholyphenol activator of the longevity enzyme sirtuin. Sirtuins are NAD+ consuming enzymes. See the cartoon in the summary. Sirtuins remove regulatory acyl groups from proteins. The authors reasoned that PT should be more bio available than resveratrol owing to more hydroxyl groups. ITT, intention to treat, is intended to avoid certain artifacts, but may introduce other issues.
Figure 1 the study design

Table 1 demographics
This post will not go into these details.
Aside: Measuring ATP levels, could we do better?
This post takes a skeptical approach to measuring just NAD+. We’ve already discussed that the precursor for NAD+, NADH, comes from efficient metabolism of donuts and other foods. Measuring ATP is something a bit more to the point when it comes to activities such as walking around the block.
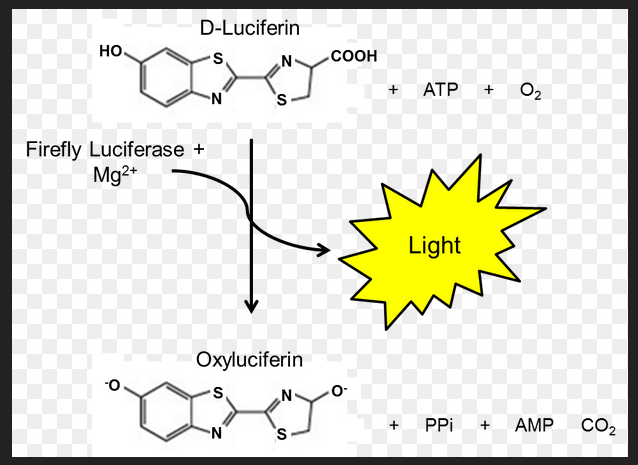
One common way to measure ATP levels is a firefly butt enzyme called luciferase. Luciferase takes D-luciferin, ATP, and oxygen to produce oxyluciferin, AMP, PPi, and carbon dioxide. BioMol.com is one of many companies that sells ATP detection kits. Naturally one also needs a way of measuring the light that is produced. ATP is not the exact same thing as cellular respiration, but it is dang close. 38 ATP from one molecule of glucose. 2 ATP from glycolysis and 36 from the electron transport chain.
Figure 2 NAD+ levels in whole blood
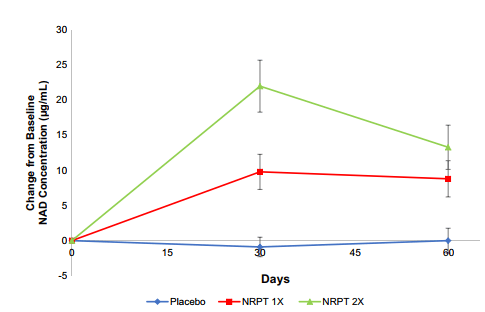
Fig. 2 NRPT increases NAD+ levels. Total NAD+ levels were measured in whole blood from all subjects at day 0 (baseline), day 30, and day 60. Graph depicts change from baseline NAD+ concentration (μg/ml) for Placebo (blue diamonds), NRPT 1X (red
squares) and NRPT 2X (green triangles). Data shown is the mean ±
standard deviation of the mean for each time point
Total NADH and NAD+ would be interesting.
Table 2 results
The patient variability is pretty large just because we are all so different. Some fancy statistics had to b be used to detect affects. The lower the P-value the more confident we are that the observed difference is not due to random chance. Generally the cut off is p<0.05.
| Placebo | NRPT 1X | NRPT 2X | Between Group P-Value | |
| Mean ±SD (n) | Mean ±SD (n) | Mean ±SD (n) | ||
| NAD Concentration (μg/mL) | ||||
| Day 0 Baseline | 22.0 ± 8.1 (40) | 22.5 ± 11.9 (39) | 23.8 ± 9.0 (38) | 0.619λ § |
| Day 30 | 21.1 ± 8.6 (40) | 32.2 ± 13.4 (40) | 45.8 ± 20.8 (38) | <0.001λ § |
| Day 60 End of Study | 22.0 ± 7.8 (40) | 31.5 ± 16.3 (40) | 37.2 ± 16.7 (38) | <0.001λ § |
| Change from Day 0 to Day 30 | -0.9 ± 8.8 (40) | 9.8 ± 15.6 (39) a | 22.0 ± 22.8 (38) a | <0.001λ Δ |
| Change from Day 0 to Day 60 | 0.0 ± 11.2 (40) | 8.8 ± 16.1 (39) a | 13.3 ± 19.4 (38) a | <0.001λ Δ |
Δ Between group comparisons were made using ANCOVA adjusting for baseline.lThe square root transformation was required to achieve normality for all change from Day 0 to Day 30 and Change from Day 0 to Day 60 data.a denotes significant difference compared to placebo as assessed by the Tukey-Kramer post-hoc test.Probability values P≤0.05 are statistically significant.
This is a direct quote from the publication:
“It is not clear why the NRPT 2X group showed the partial decline at 60 days, but it is possible that extraordinarily high levels of NAD+ can induce homeostatic mechanisms to restrain further increases. One possible mechanism is induction of NAD+ degrading enzymes, such as CD38“
It should be noted that sirtuins are also NAD+ degrading enzymes too, hence the PT blueberry extract.
Table 2, liver function
Elysium was looking for liver enzymes in the blood and and other signs of damage to test the hypothesis that the formulation causes hepatocytes to die and release their enzymes into the blood. The product was concluded to be liver safe.
Table 3 Cholesterol stuff, plus introduction
Table 3, Sirt1 and cholesterol blood stuff
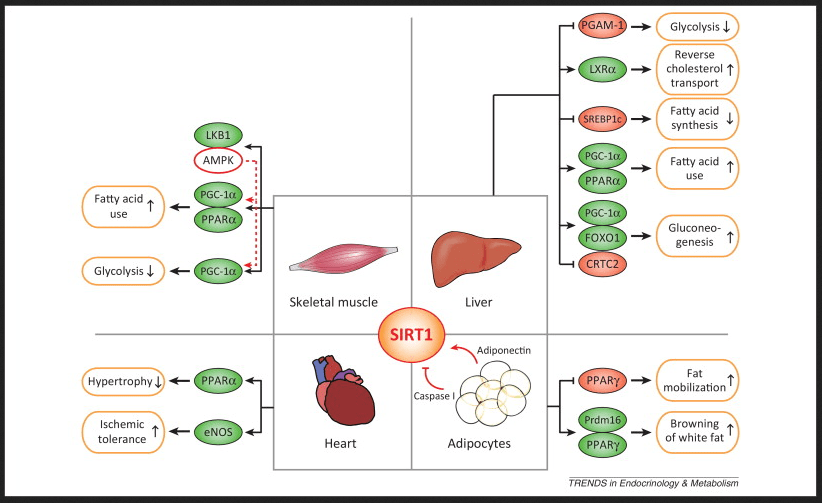
Note that sirtuins promote the metabolism of the fat component of donuts but not so much the carbohydrate portion via glycolysis.
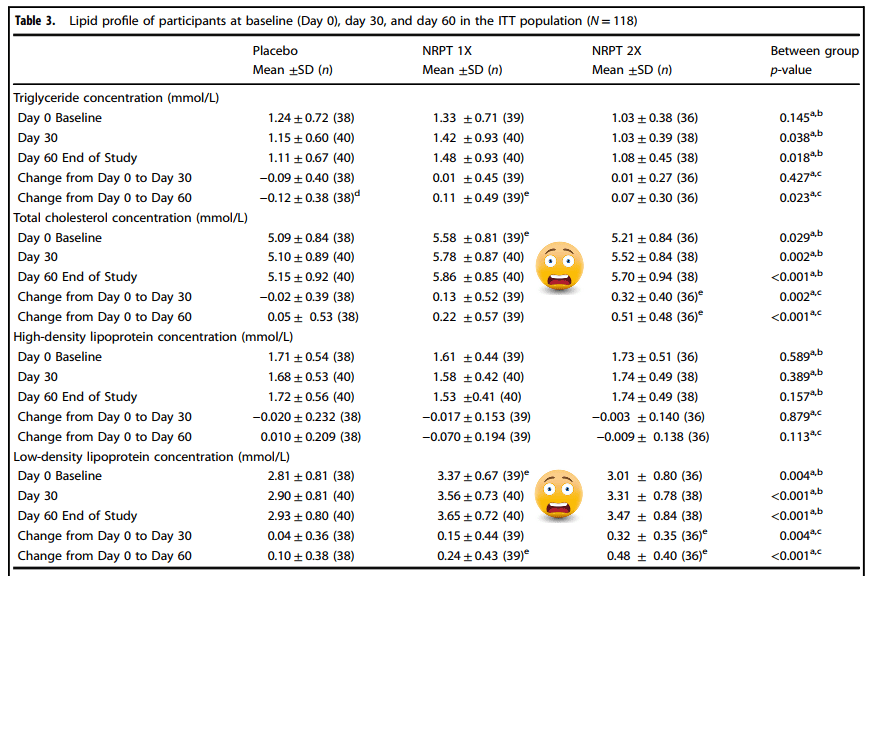
d Denotes significant within-group comparisons were made using the paired Student t-teste Denotes significant difference compared to placebo as assessed by the Tukey-Kramer post-hoc test
Table 4, stratifying for BMI
In very simple terms, the authors thought that perhaps the starting BMI (body mass index) might have an influence on cholesterol index related parameters..
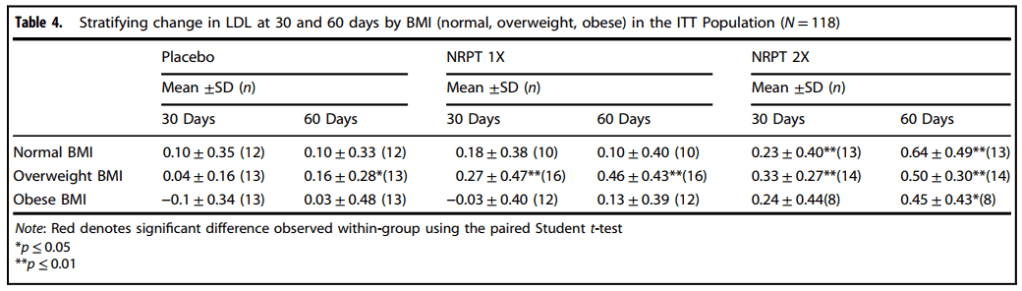
These data are still somewhat of a concern.
Other data not presented in main paper
There were no changes relative to baseline at day 30 or 60 in heart rate or blood pressure in any group except in the NRPT 1X group, where diastolic blood pressure decreased
significantly at day 60 (Table S4, not shown).
NRPT and mobility
To assess mobility in the study, a 30-second chair stand test and 6- minute walk test were employed. Higher numbers in the chair stand test indicate more lower body strength.
| 30 sec chair stand | Placebo | NRPT 1X | NRPT 2X | Between Group P-Value |
| Mean ±SD (n) | Mean ±SD (n) | Mean ±SD (n) | ||
| Number of Stands from Chair in 30 Seconds | ||||
| Day 0 Baseline | 13.2 ± 4.5 (40) | 13.0 ± 3.1 (40) | 13.4 ± 3.5 (33) | 0.896* § |
| Day 30 | 13.5 ± 4.4 (40) | 12.9 ± 3.2 (40) | 14.0 ± 3.8 (33) | 0.612* § |
| Day 60 End of Study | 13.6 ± 5.4 (40) | 13.2 ± 3.4 (40) | 14.4 ± 4.2 (33) | 0.470* § |
| Change from Day 0 to Day 30 | 0.32 ± 2.03 (40) | -0.05 ± 2.28 (40) | 0.64 ± 1.54 (33) | 0.450*∆ |
| Change from Day 0 to Day 60 | 0.50 ± 3.08 (40) | 0.28 ± 2.72 (40) | 1.03 ± 2.14 (33)b | 0.406*∆ |
The 6-minute walk test measures distance (in meters) an individual can walk at a normal pace for 6 min. The NRPT 1x dose was kind of funny with regards to cholesterol and other lipid parameters, The walking test is even more troubling. Why is it that these participants can walk less on the 1x dose?
| walk test with significant results | Placebo | NRPT 1X | NRPT 2X | Between Group P-Value |
| Mean ±SD (n) | Mean ±SD (n) | Mean ±SD (n) | ||
| Distance Walked (m) | ||||
| Day 0 Baseline | 459 ± 79 (40) | 436 ± 96 (40) | 455 ± 69 (33) | 0.422 § |
| Day 30 | 466 ± 87 (40) | 425 ± 103 (40) | 470 ± 73 (33) | 0.053 § |
| Day 60 End of Study | 475 ± 78 (40) | 429 ± 89 (40) | 489 ± 74 (33) | 0.005 § |
| Change from Day 0 to Day 30 | 7 ± 64 (40) | -11 ± 90 (40) | 16 ± 46 (33) | 0.105∆ |
| Change from Day 0 to Day 60 | 16 ± 58 (40) | -7 ± 98 (40) | 34 ± 64 (33)b | 0.007∆ |
In summary
In summary, Sirt1 appears to be metabolically regulated. Elysium seems to be seeing exciting things that may have something to do with their resveratrol analog. We propose that a BioCu1 copper supplement and ATP measurements could be the next step. We’ve discussed the role of cd38, mitochondria function, sirtuins, and NAD+ back when niacin was in the Covid news.
We have not discussed the anti-oxidant enzymes that use NADP/NADPH as a cofactor. Elysium may have seen a greater boost in redox health if the analysis has been expanded.
Leave a Reply