Category: fatty liver disease

  • NAFLD and copper deficiency

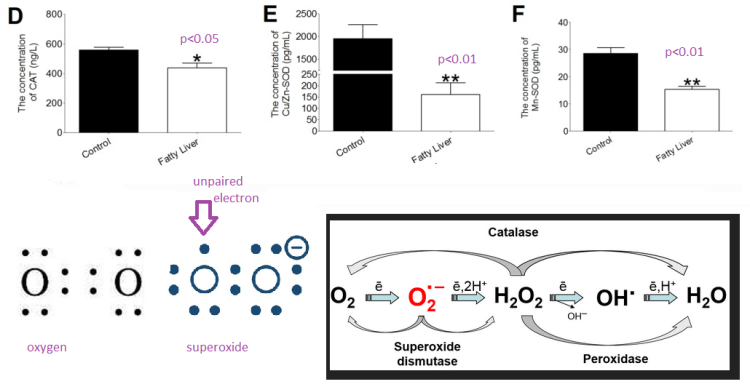
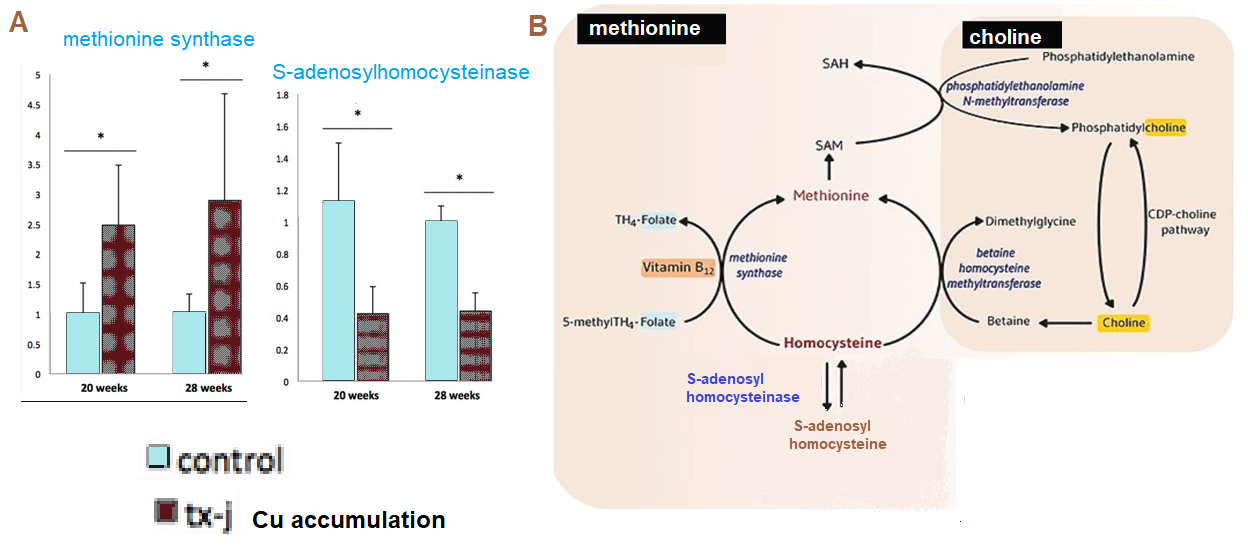
    For you cooks out there, have you ever been cooking a pot of something and and added a second ingredient to compensate for the first? Soon the second ingredient becomes too much and needs to be dealt with. The Harder 2022 study started with the premise that hepatic copper is regulated by fat accumulation.  It makes sense right? If we actually want to burn fat, we must have copper in the cytochrome C oxidase of our mitochondria. Mitochondria tend to be a source of superoxide. We might want to have some Cu/Zn super oxide dismutase (SOD) in addition to the Mn SOD of the mitochondria. When you add one ingredient to the pot, you have to add another…

    Daniel Harder and others in Marie Heffern’s laboratory at UC Davis addressed this problem in a cell culture model of fatty liver disease. These coauthors observed that copper is sequestered in a manner that mimics copper deficiency when we the added too much fat to the hepatocyte pot.  DepG2, liver hepatocarcinoma cells, were fed palmitic acid, a 16 carbon saturated fatty acid. Palm oil is a good source of this fatty acid.Figure 1  small, significant in copper handling proteins. Human hepatic carcinoma cells, HepG2, were grown in a standard medium with growth factor containing fetal bovine serum and antibiotics to control the growth of microorganisms. 

    HepG2 cells were stimulated with

    • 250 µM palmitic (PA)  
    • 200 µM fatty acid free bovine serum albumin (BSA) control media.

    Ctr1 and intercellular Cu, not measured.

    Harder and coworkers included small molecule transport SLC46A3, but not the Cu+ transporter Ctr1 in their studies. They also did not measure intracellular copper in response to the PA. The Ctr1 gene, SLC31A1. This site has covered the selectivity of Ctr1 but not whether or not energy sources that require copper enzymes increase its expression. As a general note, the Harder study also did not examine Cu binding to the transcription factor Sp1 that turns off the transcription of CTR1/SLC31A1.

    Figure 1D pumping out Cu with ATP7B

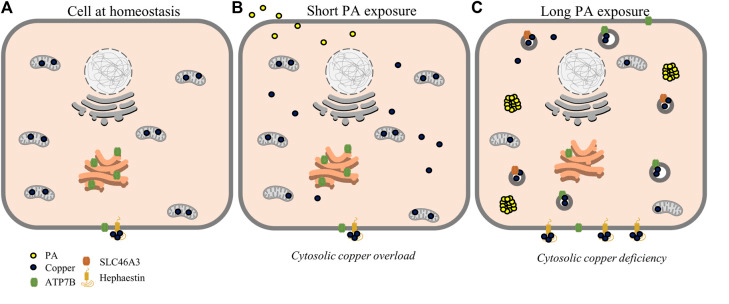
    Let’s take a look at panel D of Figure 1 first. Harder and others used a technique called immunocytochemistry to visualize two proteins at one: Green is ATP7B, a membrane protein that uses ATP to put Cu+ into vesicle that are transported from the trans Golgi network (TGN) to the surface of the cell. Red in 1D is TGN46. a protein maker of Golgi vesicles. The Hepatocyte image on the right was modified from this public access site.

    Figure 1D from Harder 2022 with a diagram of copper trafficking to provide clarity for other graphs in Figure 1.

    Hepatocyte copper handling proteins in response to PA

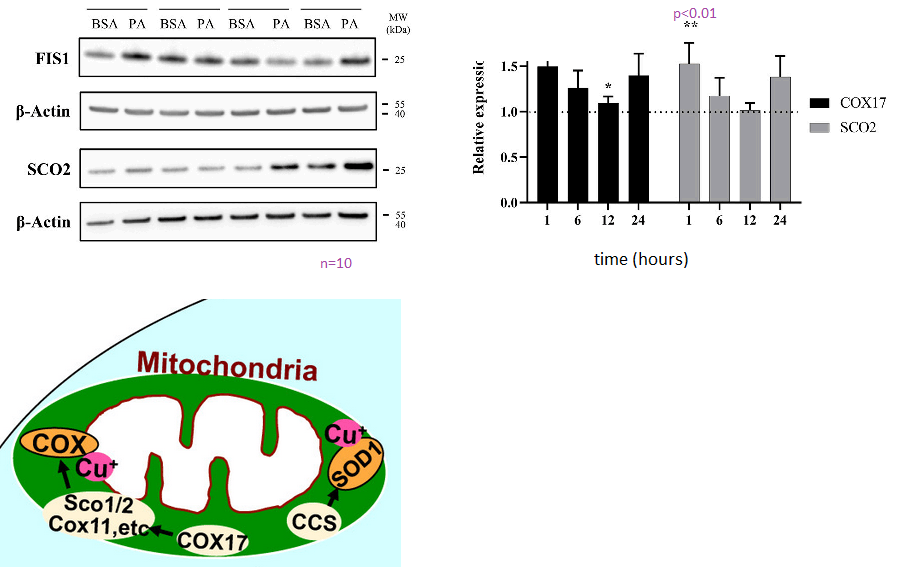
    At the designated time periods cells were lysed and proteins dissolved in a detergent that gives them a negative charge.  The proteins were separated on a “gel” based on their size as they move through the gel in response to a potential difference.  Proteins in the gel were transferred to a membrane that was incubated with primary antibodies against the copper handling proteins of interest.  These antibodies tend to be produced by injecting rabbits with purified proteins.  The rabbit primary antibodies were detected by antibodies against the invariable parts of rabbit antibodies raised in another animal such a goat.  These goat antibodies are tagged with a reporter.  This is what we see here.  Scientists always perform experiments many times.  Nine times is abbreviated as ”n=9”    

    Figure 1A pumping Cu+ out of the cell

    ATP7B is the copper export protein that uses ATP to pump Cu+ out of the cell.  PA in the cell culture medium causes a slight increase in this protein relative to the control.  First protein levels are normalized to a cytoskeletal protein called β-actin.  Then the normalization to the control is computed.

    ATP7B is the copper export protein that uses ATP to pump Cu+ out of the cell.  PA in the cell culture medium causes a slight increase in this protein relative to the control.  First protein levels are normalized to a cytoskeletal protein called β-actin.  Then the normalization to the control is computed.

    Note that transcription factor Atox1 also ferries Cu+ to ATP7B.

    The mean is another word for the average.  The SEM is the standard error of the mean.  It is simply an indicator of how much the replicates resemble each other.  The smaller the SEM, the tighter the data.  The “p” value indicates how confident we are that the results are not due to random chance.  The smaller the p value,the more confident we are in the results.  The general cutoff for “statistical significance” is p<0.05. 

    Figure 1B, copper chaperone superoxide dismutase

    CCS, the copper chaperone for Cu/Zn superoxide dismutase We’ve discussed CCS and Cu/Zn on this site.  If mitochondria are a major source of superoxide, and if they use electrons from fatty acid β-oxidation making more Cu/Zn SOD would sort of be a good idea when taking in more PA.  This is what we see. 

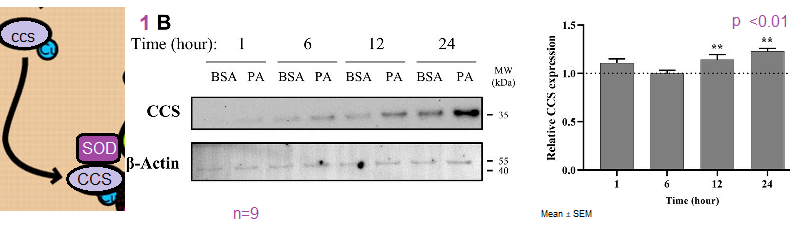
    Figure 1C, a transcription factor for Cu/Zn SOD3

    ATOX1 is next on the list as it is the chaperone for the export pump ATP7B. Note that unlike ATP7B in panel 1A, ATOX1 increases in response to PA. This site has touched on Atox1 as a transcription factor for Cu/Zn SOD3.

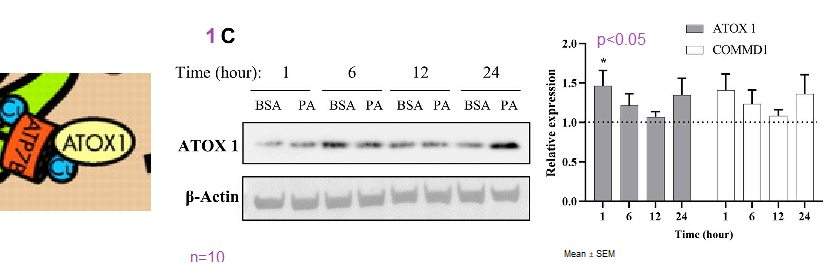
    .  COMMD1 is an accessory protein to ATP7B whose exact function, according to Harder and coauthors, is somewhat obscure.  [1]

    Figure 2 Other ways to export Cu

    The liver makes ceruloplasmin.  Ceruloploasmin is also a protein that transports copper and iron in the blood stream.  Ferroxidase activity happens when ceruloplasmin (Cp) is replete with both copper and iron.  As shown in figure 2, PA has not bearing on Cp secretion and activity.

    Figure 3 binding up excess Cu

    Metallothionein 2A is a putative Cu2+ storage protein.  The level of this protein initially increases with PA and then returns to a level statistically less than the BSA control.

    The rat metallothionein 2 bound to two divalent cations (zinc and cadmium) and a monovalent cation (sodium) came from RCSBhttps://www.rcsb.org/3d-view/ngl/4mt2

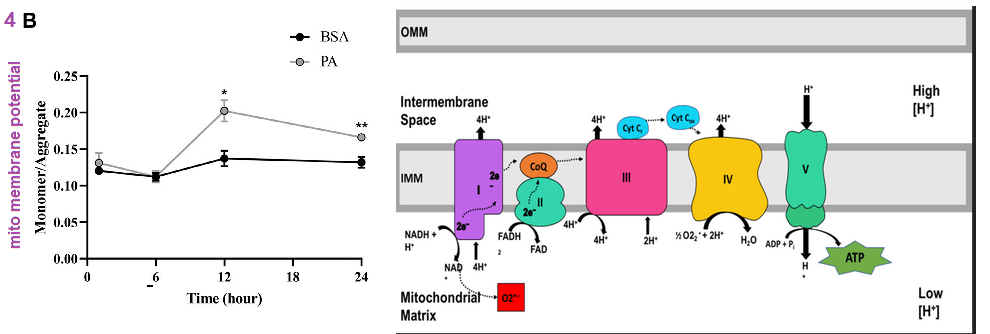
    Figure 3 Redox balance

    The Cu/Zn SOD1 initially increases yet returns to a level indistinguishable from the control.    Figure 3C pertained to the ratio of oxidized to reduced glutathione.  Oxidized glutathione is spent glutathione that can no longer reduced oxidized protein thiols or buffer metal ions like Cu+

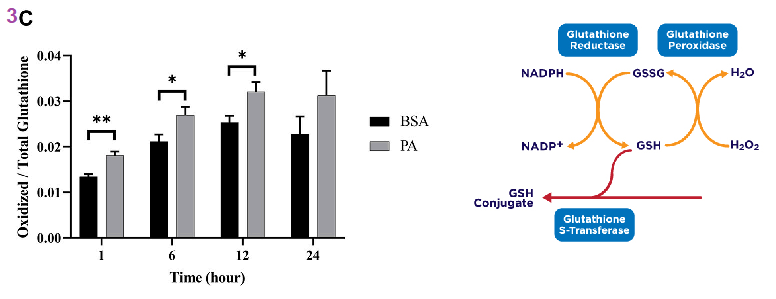
    PA results in an initial loss of redox capacity.

    The mitochondria Cu chaperone image came from this site.
    This post will not go into how the mito membrane potential fluroescent dye works. We see the expected initial increase in membrane potential at 12 hours with PA. A diagrame of the electron transport chain is also included to illustrate the source of the membrane potential difference.

    This is a nice, thought provoking study with a lot of unanswered questions.

    1. Did intracellular Cu ever increase in response to PA?
    2. What about Cu transporter Ctr1?
    3. What energy demands of these HepG2 cells could possibly be driving PA conversion to ATP? In other words, if there are no energy demands, what could possibly drive beta oxidation of PA and hence the need for copper?
    4. Would the same scenario in their summary Figure 5 also exist in cells that actually burn fatty acid to ATP, CO2 and H2O?
    Figure 5 Harder 2022 “Proposed scheme for possible perturbations of copper homeostasis by PA. At homeostasis (A), copper is mostly sequestered in proteins and organelles with a large concentration in the mitochondria. At short time points of PA exposure (B), cytosolic copper levels are increased alongside mitochondrial dysfunction, leading to a state resembling cytosolic copper overload. With longer PA (C), copper is relocalized toward export by ATP7B and sequestering mechanisms by SLC46A3 and hephaestin resulting in a copper-deficient state.”

    It just seems that the end game is to stop the accumulation of excess dietary fats in the liver.

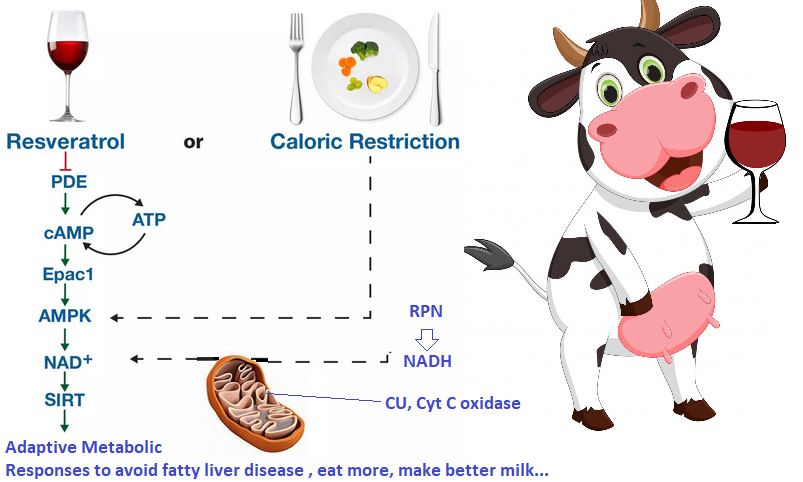
    Copper, niacin, other lifestyle factors, and NAFLD

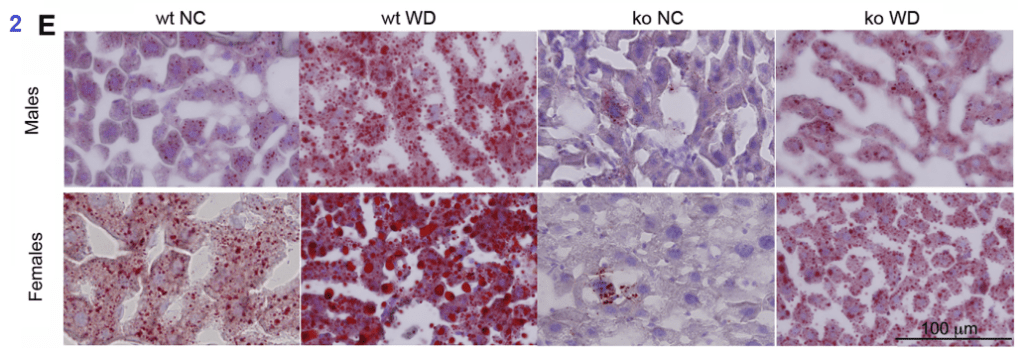
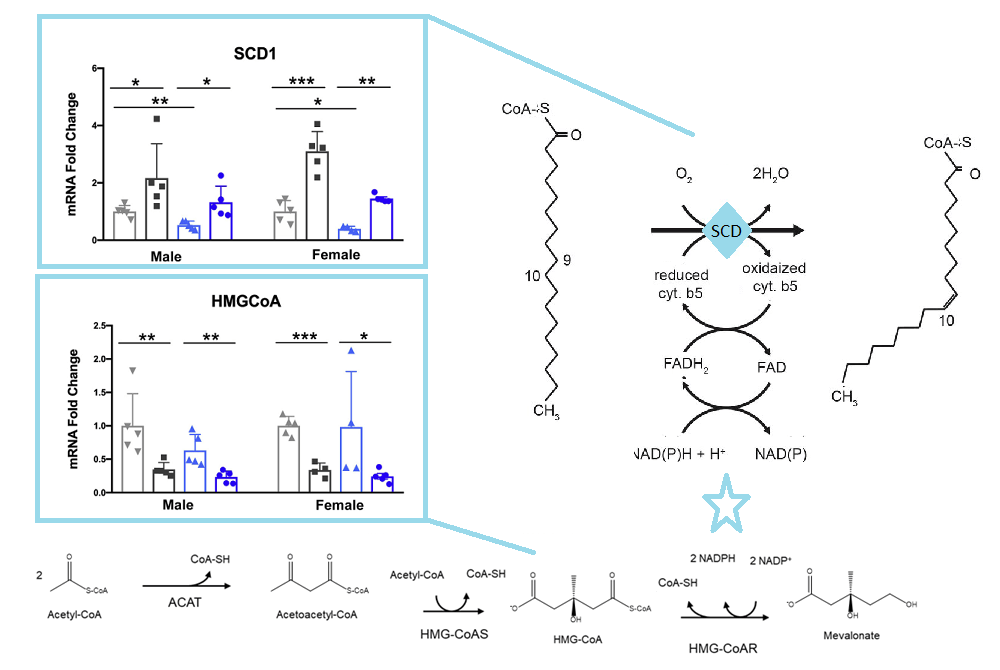
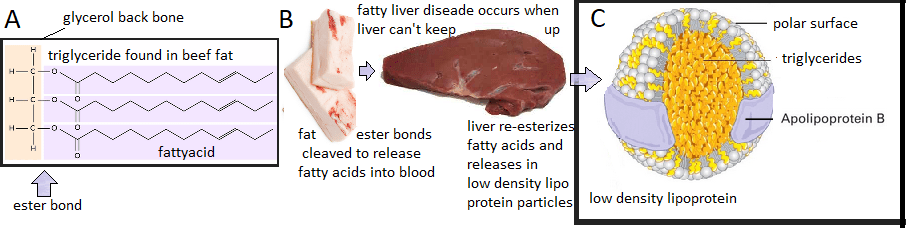
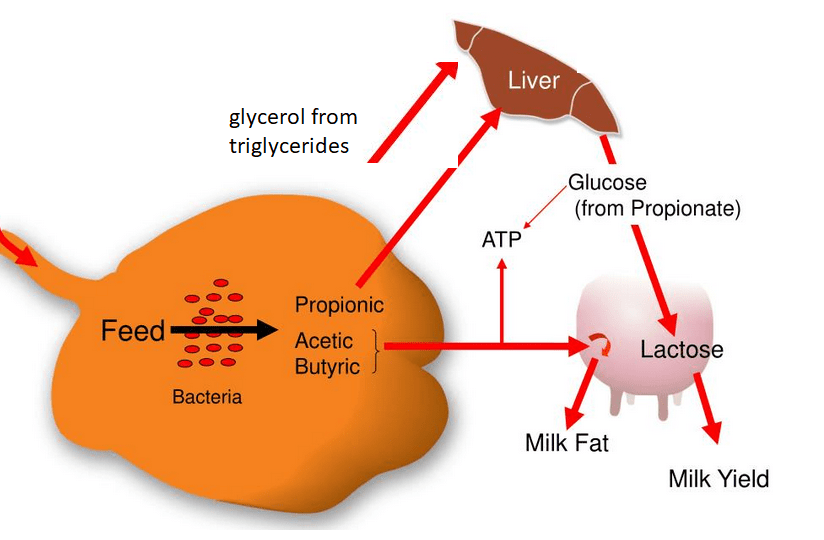
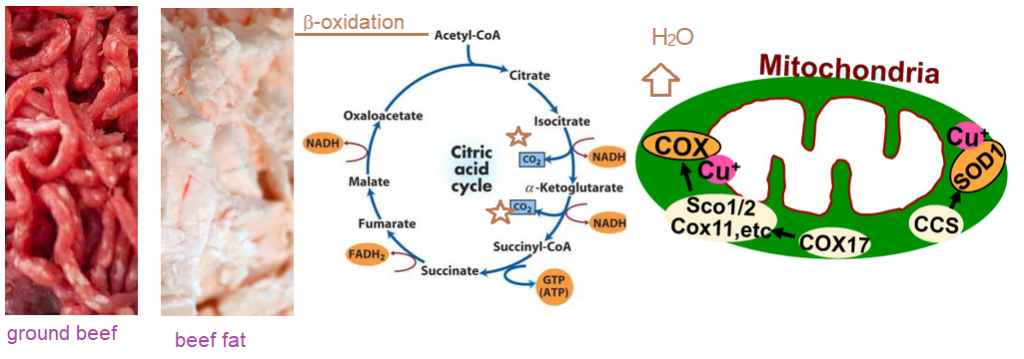
    Perhaps the biggest issue we have is to also be finding a reservoir for dumping fat where it will be turned to CO2, H2O, and ideally, ATP. Brown adipose turns fat into CO2, H2O, and heat instead of ATP. An Iranian study points to exercising muscles. This introduction figure shows some ground beef with obvious fat deposits along with some beef fat. Beta oxidation of fatty acids from the triglycerides will enter the TCA (citric acid) cycle in two carbon units. These are released as CO2, which is starred. Cu+ is essential for completion of burning the fatty acids to CO2 (in the TCA cycle) and H2O.

    What separates healthy eaters from the NAFLD pack?

    This study took place at the  Metabolic Liver Disease Research Center at Isfahan University of Medical Sciences in 2019. [2] The study included 405 controls and 225 newly diagnosed cases of NAFLD.  Participants were given a validated   semi-quantitative food frequency questionnaire (FFQ). The take home study was that these participants were eating wonderful Persian food. Their problem was they were eating too much of it and not getting enough exercise. The food cluster that proved to be protective is counter intuitive for those eating a Western diet.  Four major nutrient patterns. Were identified:

    The first nutrient pattern was high in consumption of lactose, animal protein, vitamin D, riboflavin, pantothenic acid, vitamin B12, calcium, phosphorus, zinc, and potassium.

    Yogurt and beef along with rice and vegetables are a common part of the Persian diet.

    The second nutrient pattern included fiber, plant protein, vitamin A, thiamine,niacin, copper, and selenium, Some images of refined grains more than whole grains belong in this image.
    The third featured plant protein, zinc, copper, magnesium, manganese, chromium, and selenium. According to the table below, whole grains and nuts were key components.

    Persians like to enjoy dried fruits with their nuts. Oddly dried fruits were not part of this group.

    The fourth was characterized by fructose, vitamin A, pyridoxine, vitamin C, and potassium. This group consumed a lot of nuts, fruits, and fruit drinks not sweetened by high fructose corn syrup.

    So what is a healthy diet?

    This is a table of correlation coefficients. A value close to zero means no association. A value close to -1.0 is a strong negative correlation. For example Nutrient pattern 4 were eating large amounts of fruit (R=0.81), drinking their share of natural fruit juices (R=0.385), and kind of avoiding red meat (R= -0.105).

    Nutrient pattern 1Nutrient pattern 2Nutrient pattern 3Nutrient pattern 4
    Whole grain(g/d)−0.0260.141a0.752a−0.087b
    Refined grain(g/d)−0.239a0.427a−0.194a−0.360a
    Legume(g/d)−0.0060.155a0.0710.008
    Nuts(g/d)−0.012−0.152a0.131b0.216a
    Red and processed meat(g/d)−0.017−0.093b−0.011−0.105b
    White meats(g/d)−0.035−0.052−0.0070.07
    Low fat dairy(g/d)0.705a−0.172a−0.099b0.046
    High fat dairy(g/d)0.230a−0.113b−0.113b−0.123b
    Fruits(g/d)0.047−0.073−0.115b0.810a
    Vegetables(g/d)0.097b0.035−0.0510.369a
    Egg (serving/d)0.091b0.0340.002−0.091b
    Fruit juice (serving/d)0.047−0.082b−0.0340.385a
    Snacks (serving/d)−0.129b−0.300a−0.120b−0.080b
    Artificial bevarages (serving/d)−0.111b−0.086b−0.092b0.085b
    Plant oil (serving/d)0.095b−0.0140.0470.101b
    Adjusted for age, sex, and energy intake. aP < 0.001,bP < 0.05.

    After adjusting for confounders, individuals in the highest tertile of NP4 had lower odds of NAFLD (OR: 0.56, 95% CI: 0.32–0.98, P_trend = 0.042) compared to those who were in the lowest tertile. Neither copper nor niacin were different between the healthy controls and those with NAFLD. Physical activity and BMI are the most significant differences between healthy Iranians and those with NAFLD.

    1. BMI is still a very significant predictor of NAFLD. Is there any room to argue that is is possible to kick fat out of the liver to be deposited somewhere more “healthy”? Is there a back and forth between fat in the liver, visceral fat, subcutaneous fat, and intramuscular fat? Certainly the latter two are more healthy than the first two.
    2. Lack of exercise is a predictor of NAFLD. This argues that burning dietary fats to CO2 and H20 may be even more important than not consuming the fats in the first. Copper is absolutely needed to make sure that that exercising muscle is NOT dependent on glycolysis for ATP. For the Iranians participating in this study, access to healthy food was not the problem. Cultural taboos against scantily clade males and females exercising in the heat of the summer might be a factor.

    Perhaps a copper and niacin supplement can be part of transitioning to healthy eating and an exercise plan.

    References

    1. Harder NHO, Lee HP, Flood VJ, San Juan JA, Gillette SK, Heffern MC. Fatty Acid Uptake in Liver Hepatocytes Induces Relocalization and Sequestration of Intracellular Copper. Front Mol Biosci. 2022 Apr 11;9:863296. PMC free article
    2. Salehi-Sahlabadi A, Teymoori F, Ahmadirad H, Mokhtari E, Azadi M, Seraj SS, Hekmatdoost A. Nutrient patterns and non-alcoholic fatty liver disease in Iranian Adul: A case-control study. Front Nutr. 2022 Sep 6;9:977403. PMC free article
  • Fructose copper microbiome

    Song, M., Li, X., Zhang, X., Shi, H., Vos, M. B., Wei, X., Wang, Y., Gao, H., Rouchka, E. C., Yin, X., Zhou, Z., Prough, R. A., Cave, M. C., & McClain, C. J. (2018). Dietary copper-fructose interactions alter gut microbial activity in male rats. American journal of physiology. Gastrointestinal and liver physiology, 314(1), G119–G130. PMC free article

    These authors started with the knowledge that too little and perhaps too much copper can lead to non-alcoholic fatty liver diseae (NAFLD). Fructose was also considered a contributor to NAFLD. What we at CopperOne think is really cool is that these investigators also looked at the intestinal bacteria.

    Male weanling Sprague-Dawley rats (35–45 g) were fed a purified AIN-76 diet with Cu(II)CO3. A purified AIN-76-based diet containing nearly 40% sucrose (wt/wt).

    • 1.6, marginal Cu
    • 6.0 adequate Cu
    • 20 ppm supplemental Cu
    • The mice were given distilled water to drink ± 30% weight/volume fructose.of copper as marginal, adequate, or supplemental doses, respectively, for 4 wk. Control animals

    How much sugar, presumably fructose, is in Coca Cola? This site says that there are 25 g sugar in 7.5 oz. Using the online conversion, this is 213 mL. This comes out to 12% w/v! These little animals were drinking water that had almost 3x as much sugar as Coca Cola. Does this measure the human condition? Humans who are consuming high fructose corn syrup sweetened beverages are probably also consuming foods sweetened with the same.

    Copper and copper proteins

    • Ceruloplasmin…The Cu carrier protein in the plasma saw a big reduction in the Cu marginal rats. Drinking fructose resulted in a ~25% reduction in the Cu adequate rats.
    • Plasma Cu, The plasma is the portion of blood not containing cells and clotting factors. Fructose in the drinking water increased the serum Cu in the Cu supplemented group.
    • Liver Cu, Both marginal and supplemented Cu diets showed liver Cu than the fructose free Cu adequate rats.
    • Duodenal Ctr1 Fructose in the drinking water decreased mRNA levels that code for the protein Ctr1 in Cu marginal and Cu supplemented rats. Fructose has no effect on Ctr1 mRNA in Cu adequate rats
    • Liver Ctr1. All treatments decreased liver Ctr1 mRNA compared to the Cu adequate rats that were not drinking fructose.

    Two liver enzymes and a cytokine

    When liver enzymes end up in the blood, it is a sign of liver damage. These authors looked at ALT and AST. These enzymes did not track each other from one diet to the next. The high fructose/Cu supplement diet seemed to be most consistently associated with liver damge. MCP-1, macrophage chemoattractant protein 1, recruits immune cells to he site of an infection. Cu marginal and supplemented diets tended to increase MCP-1 in their Cu adequate counterparts.

    Bacteria and leaky guts

    Endotoxin/lipopolysaccharide is a lipid component of the cell membranes of Gram negative bacteria. Marginal Cu increased the amount of LPS in the blood. LPS binding protein LBP is produced in the intestine, liver, and adipose tissue. In each of the three diet groups, fructose increased LBP relative to unadulterated drinking water. FD-4, 100uL of FITC-dextran (molecular weight 4,000, FD-4, 40 mg/ml) were injected into the lumen before the gut was ligated to form a sac. The gut sac was then placed in Krebs-Henseleit bicarbonate buffer and incubated at 37°C for 20 min. The FD-4 that penetrated from the lumen into the incubation buffer was measured spectrofluorometrically with an excitation wavelength of 485 nm and an emission wavelength of 530 nm. Only the combination of Cu supplementation and fructose adulterated drinking water caused leaky gut.

    Of mucin secreting goblet cells, tight junctions….

    Goblet cells are mucin secreting cells of the GI tract. The PAS stain, periodic acid is reacting with mucin

    From SOng (2018)

    In copper adequate and copper supplemented, the presence of fructose in the drinking water seems to decrease the length of the villi.

    Counting bugs

    Song and coworkers got quite sophisticated in their counting that we will not get into. Instead we will only present a bar graph in figure 4.

    Part of Fig 1 SOng 2018

    The one thing that stands out is the down sizing of Verrucomicrobia, that Wikipedia authors have little to say about. Given the high sugar content of these rat’s diets, any difference needs to be taken with a certain level of skepticism.

    Table 2 from Song 1018. Non significant values have been edited out. A Y in the Cu column tells us that Cu significantly affects bug counts at p<0.05. A Y in the F column says that fructose significantly affects the bug counts for the genus in the row.

    We’d like to make note of a second time, Cu used in this study was Cu(II)CO3. We at CopperOne would tend to think that the results would have been different with Cu in the +1 oxidation state.

    This is just a reminder that the interior mesenteric vein drains blood from the descending colon. If Cu(II) has deleterious effects on our gut bacteria, it will be felt in our livers. Changing the makeup of intestinal bacteria will change short chain fatty acids, polyamines, metabolites will affect our livers. If Cu(II) makes our guts more permeable, the LPS will be seen by the liver. It would be interesting to repeat this study with a diet that is a bit lower in sucrose.

  • Western Diet and Wilson’s Disease

    Lessons from a Wilson’s Disease mouse model

    Wilson’s Disease is an affliction of not being to export copper due to mutations in the ATP7B Cu+ transporter.  This study asked the question of how copper in the proper oxidation state affect the health hazards of a high fat Western Diet (WD) versus the normal control (NC) diet.  This study utilized wild type mice and those same C57BL/6 mice with the ATP7B gene knocked out (ko)

    The Western Diet from Research Diets (D12079B ) contained, per kg, 350 g sucrose, 50 g corn starch, 200g butter,

    Figure 1A-D

    After 9 weeks on the WD vs NC diet, the mouse weight gain was statistically the same regardless of the diet, ATP7B status.  The male mice gained weight faster.  The percentage body fat was a different matter.  When on the Western Diet, both male and female wildtype mice accumulated more fat than their ATP7B knockout counterparts. 

    From Figure 1 Gottlieb 2022. Note that the ko mice have less fat than their WD wild type counterparts

    Figure 2

    The Western diet increased serum glucose and  cholesterol, but not serum triglycerides.  Liver triglyceride content was increased by the Western diet.  Serum glucose was lower in the TAP7B knockout mice than the wildtypes on the control diet.  The Oil red O staining of fat in the liver was telling.  

    The oil red stains fat. From Gottlieb 2022.

    Stearoyl CoA desaturase (SCD) is an enzyme that uses O2 and electrons from reduced cytochrome b5 to introduce double bonds in the delta-9 of  acyl-CoA substrate.  Β-hydroxy-β-glutaryl CoA is an intermediate in the mevalonate pathway that ultimately leads to cholesterol synthesis. These pathways share NADPH as an intermediate.

    The SCD1 and HMGCoA panels are from Gottleib 2022, the pathways are from open sources

    Data are from Gottleib 2022 Figures 4 and 5 are not shown in this post.  Much of this post is skipping the metabolic pathway ontology of Gottleib 2022 just because it highlights global clusters of enzymes and not ones that specifically use NAD derivatives. We’ve shown one. The take home theme does seem to be that fats accumulate  in the liver because they are not used to produce cholesterol, a process that requires NADH.

    Obviously too much of anything is toxic. While Cu+ entered the cells of the ATP7B knock out (ko) mice in this study via normal pathways, it built up to toxic levels. [1] Int is interesting to note that copper toxicity cancelled Western diet toxicity. How much could Cu+ improve the toxicity of the Western diet with functioning ATP7B?

    References

    1. Gottlieb A, Dev S, DeVine L, Gabrielson KL, Cole RN, Hamilton JP, Lutsenko S. (2022) Hepatic Steatosis in the Mouse Model of Wilson Disease Coincides with a Muted Inflammatory Response. Am J Pathol. 2022 Jan;192(1):146-159.
  • Copper, fructose, and NAFLD

    We at CopperOne are thinking that we should not forget the other pandemic: Non alcoholic fatty liver disease (NAFLD) According to the National Institute of Diabetes and Digestive and Kidney Diseases, about 24% of the US population have NAFLD. From 1.5 to 8.5% of the US population have non alcoholic steatohepatits. NASH exhibits inflammation in addition to the fat accumulation of NAFLD.

    Dong-Mei Zhang, Rui-Qing Jiao, and Ling-Dong Kong of the State Key Laboratory of Pharmaceutical Biotechnology, School of Life Science, Nanjing University in China wrote an interesting review on the topic of fructose [1] that many would consider a poison of the Western diet. This post is devoted to keeping current with the copper and NAFLD literature in 2022. Fructose may be linked to NAFLD [1]

    From Zang review [1] Our comments taken from the review in purple DHAP, dihydroxyacetone phosphate; TG: triglyceride; FFA: free fatty acid; UA: uric acid; MG: methylglyoxal; VLDL-TG: very low-density lipoprotein-TG. DNL: de novo lipogenesis. E1: Serine palmitoyltransferase; E2: 3-ketodihydrosphingosine reductase; E3: Ceramide synthase; E4: Dihydroceramide desaturase.

    Fructose is absorbed by our GI epithelial cells via Glut5, transported into our circulation via Glut2, and absorbed into our livers via Glut5 again. [1] About half of the fructose we consume is metabolized via “frutolysis” by our livers. [1] Fructolysis products dihydroxy acetone and glyceraldehyde, a triglyceride precursor. [1] This process consumes 1 ATP. The Zhang review seemed to focus on reactive oxygen species (ROS), impairment of the electron transport chain, and general mitochondrial dysfunction. [1]

    Normal rats on high fructose [2]

    This study was a collaboration between the University of Alaska, Anchorage and Montana State University.  The study examined biochemical and metabolic parameters in rat chow

    These formulations included diets containing

    • A Copper adequate 12.0 mg/kg Cu,
    • B Copper adequate plus drinking water with 30% w/v fructose
    • C Copper deficient <0.2 mg/kg Cu content, no fructose
    • D Copper deficient, with drinking water with 30% w/v fructose

    Note, the Cu in the adequate diet according to supplemental table 1 contained 21 mg per kg “Cu carbonate” without specifying the oxidation state. Otherwise, minerals were supplied as an AIN salt mix without copper. Copper in the AIN salt mix is supplied as cupric carbonate. We at CopperOne have our disagreements with the oxidation state of the copper. While much can be said for a precise laboratory diet, nothing about this diet resembles how rats would be getting their copper in the wild. Rats were kept on this diet for five weeks. 

    From ref [1]

    In this table summarizing results A♀ is females on diet A, B♂ is males on diet B, and so on…

    parameterA♀B♀C♀D♀A♂B♂C♂D♂
    Serum Cu â†“↓
    Hepatic Cu↑↓↓
    Cp activity, serum↓↓
    SSAO act, serum & liver
    Complex IV, liver amount
    Ctr1 liver
    ATP7A
    ATP7B↑↓
    Summary of data from Morrell 2020 “-” indicates no significant change. Arrows indicate the direction of the significant change.

    These data were extracted from hierarchical clustering data of figure 6.  The treatment groups were arranged to show the top 25 components common to males and females.  Only metabolites of interest of this website are shown.  NAD+ is the first to show a pattern of decreasing in the fructose loaded rats on a copper adequate diet.  Mitochondria going full throttle would be expected to increase NAD+ unless the TCA cycle was keeping up very well.  AMP would also be expected to decrease with an adequate supply of calories, especially with fully functional mitochondria.    

    Note that in both females and males hepatic

    • NAD+ decreases with adequate dietary copper and high fructose.
    • AMP, an indicator of poor energy status, decreases probably because of the calorie load from the fructose, but only in the Cu adequate animals. [2]
    • Fumarate is an intermediate in the TCA cycle that produces NADH reducing equivalents for the electron transport chain.
    • Glucose is split to form pyruvate, prior to entering the TCA cycle as acetylCoA.
    • Pyruvate increases with the high fructose and copper adequate diets but not with the copper deficient high fructose diet.
    And some numbers from the supplemental data section [2]
    Supplemental data figures 9 and 10 highlights [1] with some images of metabolic pathways.

    The above image was started with the most significant metabolic indicators in the female rats, Fig s9. Then the same indicators were selected from Fig s10. NAD was not an indicator in females; lactate was not an indicator n males. The most alarming indicator is the alanine found to be elevated in mice of both genders. Are their muscles being broken down in a vain attempt to generate glucose?

    The Morrell study seemed to indicate that a “copper adequate” diet was worse than a copper deficient diet when it comes to dealing with fructose liver toxicity. It should be remembered that these rats were getting the copper in the form of Cu(II) carbonate. We at CopperOne think of Cu(II) as “toxic copper.” The Zhang review {2] did review papers suggesting the role of electron transport chain defects and the reactive oxygen species super oxide. [2] CopperOne’s response would be that Cu/Zn superoxide dismutase and mitochondrial cytochrome C oxidase receive their Cu from Cu(I) carrying chaperones. We’d like to continue the work of Morrell and others [2] with proper copper. Excess fructose in the diet will perhaps always be considered toxic with or without proper CopperOne.

    References

    1. Zhang DM, Jiao RQ, Kong LD. High Dietary Fructose: Direct or Indirect Dangerous Factors Disturbing Tissue and Organ Functions. Nutrients. 2017;9(4):335. PMC free article
    2. Morrell, A., Tripet, B. P., Eilers, B. J., Tegman, M., Thompson, D., Copié, V., & Burkhead, J. L. (2020). Copper modulates sex-specific fructose hepatoxicity in nonalcoholic fatty liver disease (NALFD) Wistar rat models. The Journal of nutritional biochemistry, 78, 108316. PMC free article
  • FattyLiver in Cows

    FattyLiver in Cows

    Some of the information in the post may be new to the average dairy farmer. Our featured image, adapted from sirtuins for human health, is a good introduction to what this post is about. The dairy farmer may have heard that drinking resveratrol rich red wine is a good way to get the same benefits of caloric restriction as they both activate the longevity enzyme called sirtuin 1, or Sirt1 for short. Why is negative energy balance so bad for cows? Maybe it is not so bad if the cow has the right nutrition. We will argue that the rumen protected niacin and copper supplements you’ve been giving your cows have some interesting science behind them.

    When cows restrict their food calories

    According to the MSD Vet Manual fatty liver disease in cattle occurs during a time of negative energy balance, i.e. when the cow is tapping into triglyceride fat stores to make up for a deficit of food calories.  Calving and going off feed are times when a cow can experience a negative energy balance. 

    Figure 1. Fat shuffling in cows. A. Triglycerides are a glycerol backbone (orange) with three fatty acids (purple). B. Images of bovine triglyceride fat stores from which fatty acids are released into the blood stream to be repackaged into C. triglyceride containing low density lipo protein particles that are released into the cow’s blood stream.

    When a cow is burning more calories than she consumes, she taps into her fat stores by releasing the fatty acids from triglycerides.  The liver takes these fatty acids, puts them back onto glycerol backbones, and then packs them into low density lipoprotein particles to be released into her blood stream.  Sometimes the cow’s liver just cannot keep up.  Cows eating too much does not cause fatty liver disease, but not eating does according to msdvetmanual.com. While some humans might restrict their calorie intake to tap into fat reserves, this is not a common practice of lactating humans. We will discuss what happens in cows when they are supplemented with rumen protected niacin.

    Niacin in fatty liver disease

    In a previous post we reviewed a study showing the ability of Cu(I)NA2 to mitigate fatty liver disease in a rat model. We neglected the potential niacin contribution to the story. Nassir and Ibadh have a nice review on the role of “longevity” enzymes called sirtuins in human fatty liver disease. [1] We have modified a summary figure from this review to illustrate the deacetylation reaction and the players.

    the players

    Niacin, vitamin B3, is the other two thirds of Cu(I)NA2. It is also a component of nicotinamide adenine dinucleotide NADH/NAD+. We have covered reduction of TCA cycle generated NADH to NAD+ in a post in a introducing sirtuins and other NAD+ dependent enzymes.

    Figure 2 Sirtuins in human fatty liver disease adapted from reference [1] . We have added the following images. Players niacin a precursor of NAD+, and the lacerated lysine side chain found in proteins . The reaction Sirtuins, of which Sirt1 is one, remove acetyl groups (Ac) from nitrogen of lysine side chains. High fat diet, HFD; non alcoholic fatty liver disease, NAFLD; fatty acid oxidation, FAO; endoplasmic reticulum, ER;

    The reaction, for the sake of our discussion, is simply the removal of acetyl groups from lysine side chains of proteins. These proteins may be histones, the spools on which chromatin DNA is wound. The acetyl group abrogates the positive charge of the of the lysine group. Make careful note of the role of NAD+ dependent sirtuins in shuttling fats in and out of the liver but also activation of genes involved in anti-oxidant response. [1] Make careful note that human Sirt1 is reduced by high fat diets (HFD) and increased by exercise and caloric restriction. [1] Some Chinese investigators asked,

    “What happens to Sirt1 in peripartum dairy cows with mild fatty liver?”

    Dairy cows were classified based on their hepatic triglyceride content. The fatty liver cows’ triglyceride content was about 2% of the liver weight whereas the control cow’s were slightly under 1%. [2] Let’s simplify this discussion of a very complicated paper by looking at a few panels of Figure 3 at a time. These data are enzyme activities. We are about to learn that enzyme activity of anti oxidant enzymes also takes a hit. From the description in reference [2] liver samples were homogenized. Enzymes from soluble fractions were capture with antibodies in ELISA plates and analyzed for their respective activities.

    Enzymes that control gene tanscription

    Sirt1 gets placed in this category because histone acetylation influences gene transcription.

    Figure3, from referece [2]. Panels A-C of this publicatgion ar te enzymes that influence gene transcription. Note that even when the change is significant, the change is. not that large

    peroxisome proliferator-activated receptor γ coactivator-1 alpha (PGC-1α),in simple terms binds fatty acids and helps regulate gene transcription. Sterol regulatory element binding proteins (SREBP) are also transcription factors that bind to the regulatory elements of genes. SREBP gets its start in membranes as bHLH-Zip. When cleaved, bHLH-Zip/SREBP reports back to the nucleus to regulate cholesterol related gene transcription.

    Anti-oxidant enzymes

    Catalase is an iron containing enzyme that catalyzes the decomposition of hydrogen peroxideH2O2 to water H2O and molecular oxygen, O2. Superoxide dismutases catalyze the dismutation of super oxide to O2 and H2O2. In Cu/Zn SOD the Zn is only structural. Cu2+-SOD + O2 → Cu+-SOD + O2 followed by Cu+-SOD + O−2 + 2H+ → Cu2+-SOD + H2O2 . Manganese cofactor SOD is found in the mitochondria

    Figure 3 cont from reference [2] and embelished with images. These panels tell the story of enzymes that detoxify superoxide, a reactive oxygen species. Note the large decrease in Cu/Zn superoxide dismutase (SOD)

    Four electrons participate in a double bound between the two oxygen molecules in molecular oxygen, O2. Super has only a single bond between the two oxygens. An additional electron completes the eight electron valence shell of one oxygen leaving the other oxygen with an unpaired electron. This unpaired electron makes super oxide a reactive oxygen species. Note the remarkable decrease in Cu/Zn SOD and the break in the Y-axis of panel E needed to document the >10x decrease in Cu/Zn SOD activity in bovine fatty liver disease.

    Thiol redox balance and reactive oxygen species

    Glutathione peroxidases are a family of selenocysteine containing enzymes serve the same function of catalase: conversion of H2O2 to H2O. They also convert lipid peroxides to their corresponding alcohols.

    Figure 3cont. from reference [2] plus acon n overview of redox enzymes.

    These authors saw a significant, but not so large, decrease in Sirt1 activity in cows with mild fatty liver disease. They did see large decreases in the Sirt protein and mRNA (not shown in this post). These authors saw decreases in the following transcripts in fatty livers:

    • Mn SOD, ~20x
    • catalase, ~5x
    • glutathione peroxidase, ~10x
    • Cu/Zn SOD, ~ 3x

    Unlike Cu/Zn SOD activity, the changes in Cu/Zn SOD transcripts did not reach the threshold of significance at p<0.05. This publication was far more focused on changes in transcripts of genes involved in fatty acid metabolismi. Whether the fatty liver condition interfered with Cu/Zn SOD being loaded with metal cofactor was not part of the objectives. [2] A follow up to this study looked at which proteins were acetylated in fatty liver disease in cattle. [3] These authors identified many mitochondrial enzymes involved in fatty acid metabolism. Electron transport enzymes and anti oxidant enzymes were not prominent or even present in this “acetylome.” [3]

    Back to the basics, making milk

    Modifying protein function by placing acetate tags on protein lysines is trendy in biological science.

    Figure 4 Reminder that cows need to be fermenting feed to make milk. They need glucose to fuel their brains too. Mammalian brains do not break down fatty acids for ATP. They use glucose, and in a pinch, they can use beta-hydroxy butryrate.

    This whole discussion of the longevity sirtuin enzymes, them getting enough NAD+ cofactor to deacetylate proteins that somehow get acetylated in the peripartum fatty cow liver seems to be missing the point of making milk! How milk production is responsive to the cow’s energy status will probably continue to keep scientists busy.

    RPN increases dry matter intake and milk yield

    Rumen protected niacin (RPN) has become a popular dietary supplement for milk cows. Chinese dairy farmers observed that cows on RPN simply ate more. [4] Chinese scientists conducted a bovine “clinical” trial of 12 multiparous Holstein dairy cows. The cows were divided into two groups with diet supplemented with either 0 (CON) or 20 g/day RPN (RPN). [4] Each group contained three 3rd parity and three 4th parity cows. Milk production, milk composition, and dry matter intake were the “tried and true” outcome measures in this mini trial. [4] 21st Century outcome measures were appetite stimulating homores neuropeptide Y (NPY), orexin A (OXA), non-esterified fatty acids (NEFA), β-hydroxy butyric acid (BHBA), and rumen bacteria counts.

    eating more and making more milk
    Figure 5 from reference [4] Graphical and tabular data have been combined.
    The neurotransmitter revolt?

    How calorie restricted were these cows? When cows are niacin supplemented, peptide Deeurotransmitters that increase appetite are relased. Going back to the Wikipedia links, orexin and neuropeptide Y secreting neurons depolarize in response to lowered blood glucose. Depolarization translates into increased firing and neuro transmitter release. NPY secreting neurons are inhibited by glucose and leptin, a peptide secreted by fat cells.

    “Brain food” from fatty acids requires NADH

    Non-esterized fatty acids (NEFA) have been covered. Free fatty acids are taken apart two carbons at a time in a process called beta-oxidation. Acetyl-CoA feeds into the TCA cycle that generates NADH to be used by the electron transport chain. Alternatively, two acetyl-CoA may condense to form acetoacylCoA. This compound is further reduced by NADH to form beta-hydroxy butyric acid. BHBA can be used as a fuel for the brain when the cow in a state of negative energy balance.

    Figure 7 Data from refereence [4] Non-esterized fatty acids (NEFA) are converted to acetyl CoA via beta-oxidation. Acetyl CoA is a precursor for beta hydroxy butyrate. Data in the yellow table are from ANOVA analysis that examines interactions between time and treatment, niacin versus control.

    The authors stated that none of their cows reached the threshold of NEFA and BHBA seen in fatty liver disease. Small increases in NEFA and the corresponding BHBA may be a good thing if it keeps the cow’s brain going until it can produce more NPY and/or orexin to stimulate her appetite. If she eats more, her rumen will produce more propionic acid that her liver will use to make glucose, proper brain food and a precursor for lactose for her milk.

    Supplementing cows with copper because our soils are soils are depleted

    Dairy farmers can probably teach us more than a few things about this problem. We have addressed our copper depleted soils on the Copper Electron Thesis page. We have visited company websites that sell copper supplements to rancher. Copper is needed for proper flow of electrons through the electron transport chain to ATP. Remember that these cows go through a spat of eating less so there is less propionate to make glucose. Anaerobic glycolysis is not a favorable option. Their mitochondria may be generating more superoxide than usual. Cow’s need Cu/Zn and Mn SOD to clean up the mess.

    A milk cow supplement containing copper and niacin?

    What are your thoughts on rumen protected copper? Would you be interested in supplementing your cows with rumen protected copper and niacin? Among many other things, copper is needed for proper flow of electrons.

    References

    1. Nassir F, Ibdah JA. (2016) Sirtuins and nonalcoholic fatty liver disease. World J Gastroenterol. 2016 Dec 14;22(46):10084-10092 PMC free article
    2. Li Y, Zou S, Ding H, Hao N, Huang Y, Tang J, Cheng J, Feng S, Li J, Wang X, et al. Low expression of sirtuin 1 in the dairy cows with mild fatty liver alters hepatic lipid metabolism. Animals (Basel) 2020;10(4):560. PMC free article
    3. Le-Tian, Z., Cheng-Zhang, H., Xuan, Z., Zhang, Q., Zhen-Gui, Y., Qing-Qing, W., Sheng-Xuan, W., Zhong-Jin, X., Ran-Ran, L., Ting-Jun, L., Zhong-Qu, S., Zhong-Hua, W., & Ke-Rong, S. (2020). Protein acetylation in mitochondria plays critical functions in the pathogenesis of fatty liver disease. BMC genomics, 21(1), 435. PMC free article
    4. Gaowa, N., Zhang, X., Li, H., Wang, Y., Zhang, J., Hao, Y., Cao, Z., & Li, S. (2021). Effects of Rumen-Protected Niacin on Dry Matter Intake, Milk Production, Apparent Total Tract Digestibility, and Faecal Bacterial Community in Multiparous Holstein Dairy Cow during the Postpartum Period. Animals : an open access journal from MDPI, 11(3), 617.   PMC  free article

  • Fatty Liver Disease

    Fatty Liver Disease

    Please note in readying this report on Cu(I)NA2  and fatty liver disease, the authors did not compare Cu(I)NA2  with another dietary copper supplement such as cupric (+2) citrate.  Therefore the conclusions are not unique to Cu(I)NA2. Do not take anything in this post as medical advice. Feel free to discuss this post with your physician.

    This particular study came out of the Department of Physiology of Aswan University, in Aswan, Egypt [1].  The Liver Foundation estimates that approximately 30% of the U.S. population suffers from non alcoholic fatty liver disease and 5% are afflicted by  its subtype nonalcoholic steatohepatitis.  These numbers translate to about 100 million individuals in the United States living with  nonalcoholic fatty liver disease.  The global prevalence of fatty liver disease is  about as high.  Hegazy and coworkers were not interested in the mechanisms of moving fats out of the liver and into the blood stream.  They simply wanted to know if Cu(I)NA2 might relieve the inflammation associated with fatty liver disease.  Copper might have a role in both.

    Fatty liver disease

    Fatty liver disease is, very simply, the abnormal accumulation of fats in the liver.  Alcoholism is a main cause of fatty liver disease.  Non alcoholic fatty liver disease my be caused dietary deficiencies, metabolic abnormalities, drugs and toxins, and immune responses. These  authors chose to induce FLD in  rats with a methionine- and  choline deficient diet (MCDD).

    What are methionine and choline?

    Methionine is an essential amino acid that participates in many enzymatic reactions as a methyl donor.  DNA methylation is one of many of these reactions.  Note the methyl group in Figure 1c.  Choline (Fig 1c) is the basic constitute of lecithin (phosphatidyl choline), a phospholipid found in plant and animal cells.  Choline may also serve as a methyl donor.  Hydrogens in the structures in Figure 1c are “understood.”  The end of the sticks are understood to be methyl groups (-CH3).  Dietary deficiency choline may result in accumulation of fat in the liver due to lack of very low density lipoprotein (VLDL) needed to transport fats out of the liver.  Methionine deficiency may cause general liver damage that may be clinically measured by the release of the liver enzyme alanine amino transferase (ALT) into the blood.    PubChem tells us that choline may be used to synthesize betaine.

    Choline deficiency in dairy cattle transitioning from being pregnant to being milk producers is an industry concern [2].  One of the industry challenges is protecting the dietary choline from the contents of the rumen.

    FLD_1
    Figure 1 The intersection of a methionine [1] and b choline pathways.  c a structure of methionine and chloine. d In addition to B12, methyl synthase has Mg2+ cofactors.

    Why Copper?

    A 1999 study examined the influence of copper deficiency in rats on folate and homocysteine synthesis.  Hepatic folate, and plasma vitamin B-12 concentrations were similar in both groups [3].  Homocysteine in the blood plasma increased, most likely the result of a decrease in hepatic methionine synthase (MS) activity [3].  The authors speculated that MS might be a cuproenzyme in addition to requiring B12 cofactor.  Twenty years later, we still have no clue.  Rat methionine synthase has three amino acids that interact with  Mg2+ and two that interact with K+ these were found by following the UniProt line to  an X-ray crystal structure of methionine synthase. [4]

    FLD_2
    Figure 2 Interaction of amino acids in methionine synthase with ATP and free methionine , adapted from [4]

    One would think that if Cu2+  can substitute for Mg2+  in methionine synthase, we’d not know it by now.  Mg has only one oxidation state.   Cu has two.  The implications on the catalytic process would be interesting, if such a substitution were the case. The answer may lie in the affect of Cu on gene expression.

    Cu(I)NA2 protects the fatty liver from further damage

    FLD_3
    Figure 3 from [1]  Effect of CNC, Cu(I)NA2, on liver enzyme activity in the serum of rats with fatty liver (mean±standard deviation, n=10).Means with different superscripts in the same row are significantly different at p<0.05. CNC=Copper-nicotinate complex, MCDD=Methionine- and choline-deficient diet, ALT=Alanine aminotransferase, AST=Aspartate aminotransferase, GGT=Gamma glutamyl transferase

    Note that CNC,  Cu(I)NA2, brings the activities of liver in the serum down to control levels even in the presence of methionine and choline deficiency.

    FLD_4
    Figure 4 from [1]  Effect of CNC on oxidative/anti-oxidative markers in liver homogenate of rats with fatty liver (mean±standard deviation, n=10).  Means with different superscripts in the same row are significantly different at p<0.05. CNC=Copper-nicotinate complex, MCDD=Methionine- and choline-deficient diet

    Note that Cu(I)NA2, brings reduced glutathione to control levels in the fatty liver model.    Malondialdehyde, a marker of reactive oxygen species degradation of polyunsaturated fatty acids,   is  decreased to control levels. Cu(I)NA2 almost doubles superoxide dismutase activity [1].  The authors did not distinguish between superoxide mimetic activity of  Cu(I)NA2  alone or in intracellular Cu/Zn SOD1 or extracellular Cu/Zn SOD3 [1].   These authors also looked at expression at various cytokines associated with inflammation.

    Copper regulates gene transcription

    Liver gene expression was examined in a “tx-j” mouse model of Wilson’s Disease caused by a mutation in ATP7B.  ATP7B secretes excess copper into the bile.  Non functional in WD patients have a toxic overload of copper in their livers.  Shibata and  coauthors [5] looked at gene expression (Y-axis, Fig 5A) for many stages of development.  They were particularly interested in genes that regulate DNA methylation.  We will stick to our story line and single out two genes that might impact fatty liver disease.

    FLD_6
    Figure 5 How copper might regulate fatty liver disease A. Relative expression between two select genes in control mice and a mouse model of Wilson’s disease B. Re-visitation of Figure 1 with gene expression data

    We have no way of knowing if dietary copper of any sort mimics the effect of ATP7B defect (tx-j) copper overload.  In such a hypothetical methioinine synthase compensates for reduced dietary methione and possibly even choline.  By most accounts, S-adenosyl homocyetinase merely speeds up the equilibrium between homocysteine and S-adenosyl homocysteine.  The expression of this gene is decreased by copper overload.

    Could Cu(I)NA2  regulate gene expression in the fatty liver in a manner that facilitates fat export?  We do not know! A certain amount of caution needs to be used that genes are over-expressed when there is too much copper are not expressed enough when there is copper deficiency.

    Concluding remarks

    •   This featured Cu(I)NA2 study [1] was not concerned with enzymes involved with fatty liver disease.  The lessened liver damage and positive oxidative status results are the encouraging focus of this report.
    • Dietary deficiency in choline/methionine can impact can lead to fatty liver disease in dairy cattle [2].
    • Earlier rodent studies suggest a link between copper and the methionine cycle [3] .  Twenty years later there is no evidence that copper is a cofactor in methionine synthase.  Considering how magnesium does fit into the structure [4], it would be interesting if it did.
    • The most likely explanation for Reference [3] data is copper regulation of hepatic gene transcription, in particular methione synthase [5].
    • We want to emphasize that we are not making medical claims regarding Cu(I)NA2 in this post.  
    • We do see enough data to support investigative studies.

    References

    1. Hegazy AM, Farid AS, Hafez AS, Eid RM, Nasr SM. (2019) Hepatoprotective and immunomodulatory effects of copper-nicotinate complex against fatty liver in rat model. Vet World. 12(12):1903-1910. [PMC free article]
    2. Abbasi, I.H.R., Abbasi, F., Soomro, R.N. et al. Considering choline as methionine precursor, lipoproteins transporter, hepatic promoter and antioxidant agent in dairy cows.(2017) AMB Expr 7, 214 (2017). [Cross Ref]
    3. Tamura T, Hong KH, Mizuno Y, Johnston KE, Keen CL. (1999) Folate and homocysteine metabolism in copper-deficient rats. Biochim Biophys Acta. 1427(3):351-6.
    4. González B, Pajares MA, Hermoso JA, Guillerm D, Guillerm G, Sanz-Aparicio J (2003) Crystal structures of methionine adenosyltransferase complexed with substrates and products reveal the methionine-ATP recognition and give insights into the catalytic mechanism. J. Mol. Biol. 331 407-16
    5. Le A, Shibata NM, French SW, Kim K, Kharbanda KK, Islam MS, LaSalle JM, Halsted CH, Keen CL, (2014)Characterization of timed changes in hepatic copper concentrations, methionine metabolism, gene expression, and global DNA methylation in the Jackson toxic milk mouse model of Wilson disease. Medici V. Int J Mol Sci. 2014 May 7;15(5):8004-23. [Cross Ref]