Phetsouphanh C, Darley DR, Wilson DB, Howe A, Munier CML, Patel SK, Juno JA, Burrell LM, Kent SJ, Dore GJ, Kelleher AD, Matthews GV. Immunological dysfunction persists for 8 months following initial mild-to-moderate SARS-CoV-2 infection. Nat Immunol. 2022 Feb;23(2):210-216. free article
The previous post featured big data that really got out of hand became unrealistic for a small company to replicate in a clinical trial. Phetsouphanh et al from Feb 2022 really hit an realistic mark. This post features small data that we can use in a clinical trial.
The study population
This is what their population looked like. Long Covid patients are those who experienced symptoms four months after the active infection. UHC are unexpected healthy being those that were exposed but never got sick. The matched controls are patients who developed symptomatic Covid infections but were asymptomatic four months after the active infection.
| Characteristics | Long Covid (LC) | Matched control (MC) | human coronovirus | UHCs (St Vincent’s) | UHCs (University of Melbourne) |
|---|---|---|---|---|---|
| Number of samples | 31 | 31 | 25 | 16 | 30 |
| Age (y), mean ± s.d. | 49.6 ± 14.9 | 48.9 ± 12.8 | 47.4 ± 16.9 | 37.13 ± 10.02 | 48.13 ± 11.89 |
| Male, n (%) | 15 (48) | 15 (48) | 14 (54) | 8 (50) | 15 (50) |
| Median days after positive SARS-CoV-2 PCR (IQR) | 128 (115–142) | 120 (115–142) | N/A | N/A | N/A |
| White, n (% total) | 28 (90) | 26 (84) | 12 (75) | N/A | |
| Severity, n (% total) | |||||
|  Hospitalized | 8 (26) | 2/31 (6) | |||
|  Community | 23 (74) | 29/31 (94) | N/A | N/A | N/A |
| Comorbidities, n (% total) | 12 (39) | 12 (39) | N/A | N/A | N/A |
| Transmission (acquired overseas), n (%) | 13 (42) | 15/31(48) | N/A | N/A | N/A |
| Phenotyping (n) | 14 | 14 | N/A | 7 | – |
| HCoV positive (n) | – | – | 26 | – | – |
| HKU-1 | 1 | ||||
| 229E | 14 | ||||
| NL63 | 14 | ||||
| OC43 | 10 | ||||
| ACE2 assay (n) | 26 | – | 30 | ||
| Month 3 | 26 | 29 | – | – | |
| Month 5 | 25 | 24 | – | – | |
| Month 8 | 27 | 29 | – | – |
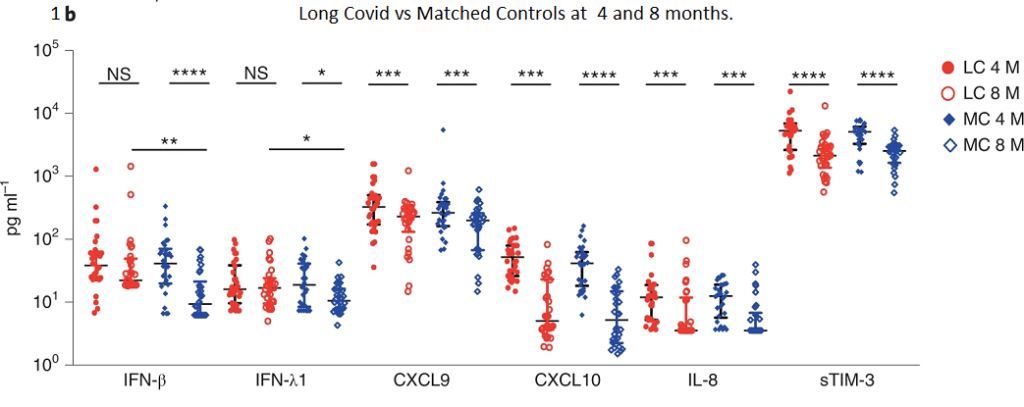
1. Interferon β is the cytokine to watch
An immediate surprise is that the IL-8 profiles in UHC that were different from the matched controls.

Interferon beta balances the expression of pro- and anti-inflammatory agents in the brain. ??? This one could be interesting in light of neurological symptoms in Long Covid. Interferon lambda are anti-viral and first line of defense of epithelial cells.
CXCL9 promotes leukocyte differentiation and chemotaxis. CXCL10 is a chemotaxis factor for dendritic cells and macrophage. IL-8 us a neutrophil chemotaxic factor. sTIM-3 soluble T cell immunoglobulin mucin domain 3. The interferons were elevated in the Long Covid patients at 8 months compared to the matched controls.
1b there’s something LC about the interferons
Note the bars connecting the LC 8M and MC 8M showing that they are different at the p<0.01 or p<0.05 level of significance. We don’t see these differences for the other cytokines.
Soluble ACE2 enzyme activity was also measured but will not be reported in this post.
2. What features define Long Covid?
Because of the modest small sample size of 58 participants at month 8,
the authors performed a technique called “bootstrapping” to randomly sample new samples from the population of 58 with replacement. The sampled population was then
split 29:29 into test and train datasets. This seems to be some sort of machine learning thing we should consider learning. It seems to be a powerful way of sorting through big data diarrhea.
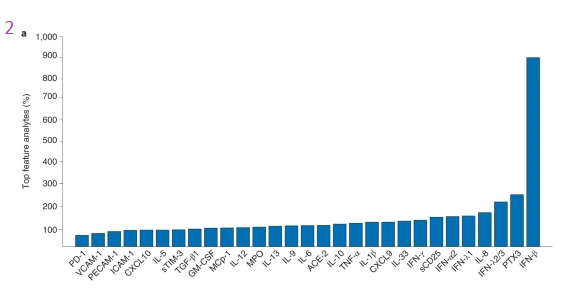
IFN-β again comes out on top. When it comes to defining Long Covid, less (four features) is more (29 features).
| Number of features | Best features | Accuracy | Confidence interval | F1 score | Confidence interval |
|---|---|---|---|---|---|
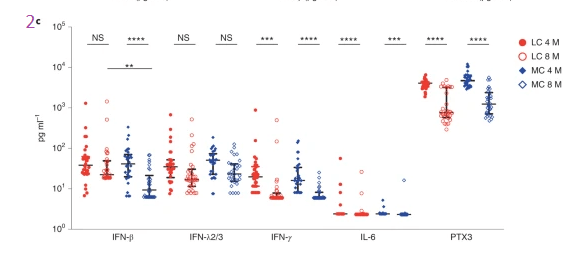
| 2 | IFN-β, PTX3 | 0.7854 | ±0.0019 | 0.7736 | ±0.0025 |
| 3 | IFN-β, PTX3, IFN-λ | 0.7968 | ±0.0019 | 0.7852 | ±0.0024 |
| 4 | IFN-β, PTX3, IFN-λ2/3, IL-6 | 0.8159 | ±0.0017 | 0.8053 | ±0.0021 |
| 29 | All | 0.7740 | ±0.0018 | 0.7588 | ±0.0084 |
The next step was to ask how well do the other features predict the amount of the top feature IFN-β?
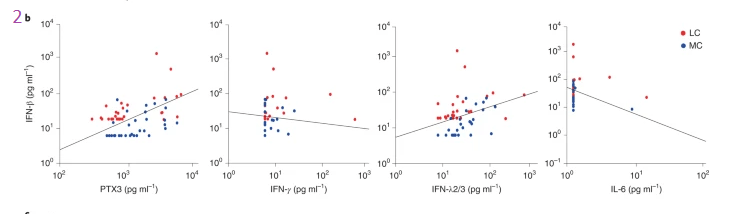
These lines look like regression lines, but evidentially are not. It is interesting that IL-6 and INFγ are inversely related to the top Long Covid cytokine IFN-β. PTX3 and IFN-λ2/3 are directly related to IFN-β. This brings us back to comparing the four and eight month time frames. While all the cytokines go down in this period, only one remains elevated eight months post infection.
3 from cytokines to T cell surface proteins
These are the “clusters” of surface proteins on immune cells as defined by the figure legend for 3b.
- CD127lowGzmB-CCR7+CD45RA+CD27+ naive CD8+ T cells
- CD57+ highly cytotoxic (GPR56 + GzmB+) CD8+ T cells
- CD127lowTIM-3-CCR7+CD45RA+CD27+ naive CD4+ T cells
- CD3+CD4-CD8- innate-like T cells (may comprise natural killer T cells and γδ-T cells) and
- naïve CD127 low TIM-3-CD38 lowCD27-IgD+ B cells
The color codes were not defined in the publication. Each of these cell surface markers is recognized by an antibody with a fluorescent tag.
at 3 months
Note that there are no representatives of any of these five populations at three months in the Long Covid population compared to the matched controls who got symptomatic Covid but were well at four months. Long Covid and Matched Control bars are the same at three months, before LC officially sets in, or something?
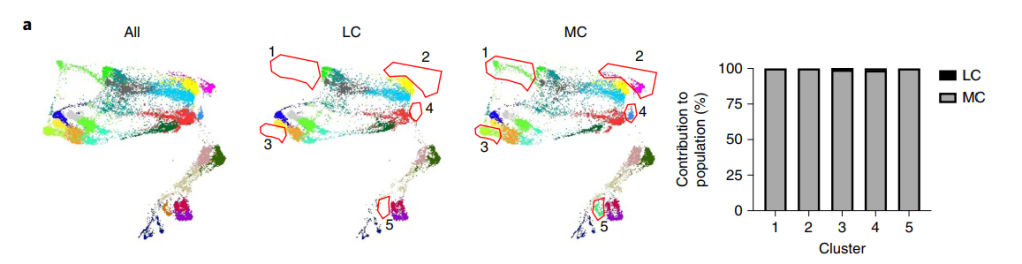
TriMap and clustering with phenograph was used to visualize immune cell phenotypes. Five populations consisting of unactivated naive and cytotoxic
phenotypes were absent in the LC group when compared to MCs at 3 months (n = 14, seven samples per group). Absent populations are outlined in red
(middle and right panel), with median percentages of the LC and MC contribution to each cluster population shown in the bar graph.
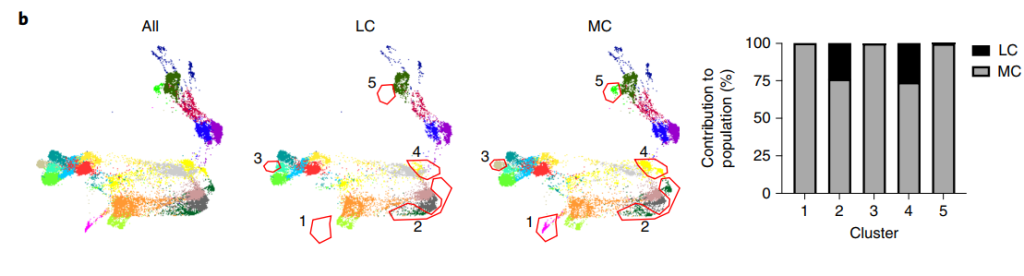
at 8 months
By eight months clusters 2 and 4 are returning in the Long Covid patients.
Sorting out cell sub types
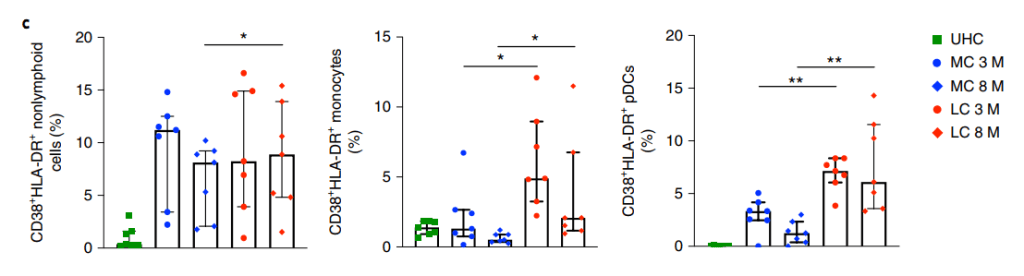
CD38+ non lymphoid cells, monocytes, and peripheral dendritic cells are all elevated at 3 and 8 months post infection. The scholars on Wikipedia have posted some excellent information on CD38.
- As a receptor, CD38 can attach to CD31 on the surface of T cells, thereby activating those cells to produce a variety of cytokines. CD38 in some circles, perhaps the authors of this publication are one.
- CD38 “catalyzes the synthesis of ADP ribose (ADPR) (97%) and cyclic ADP-ribose (cADPR) (3%) from NAD+. CD38 is thought to be a major regulator of NAD+ levels, its NADase activity is much higher than its function as an ADP-rybosyl-cyclase: for every 100 molecules of NAD+ converted to ADP ribose it generates one molecule of cADPR. When nicotinic acid is present under acidic conditions, CD38 can hydrolyze nicotinamide adenine dinucleotide phosphate (NADP+) to NAADP.” The peer reviewed references on this Wikipedia post will be explore in greater detail as this is how Cu(I)NA2 must be working.
CD4 is a glyco protein on the surface of T helper cells. It is a co-receptor for the T cell receptor that recognizes antigens in the MHC II complex of antigen presenting cells. There is no Long Covid action associated with this receptor. CD8 is like CD4 only it interacts with viral or cancer cell antigens in the MHC class I complex. MHC I is present in most nucleated cells. Presentation of antigens marks them for death by activating CD8+ cytotoxic T cells. MHC II is produced by professional antigen presenting cells, which may sometimes be lymphocytes. The CD4+ cells don’t matter in Long Covid. It is the CD8+ cells that matter.
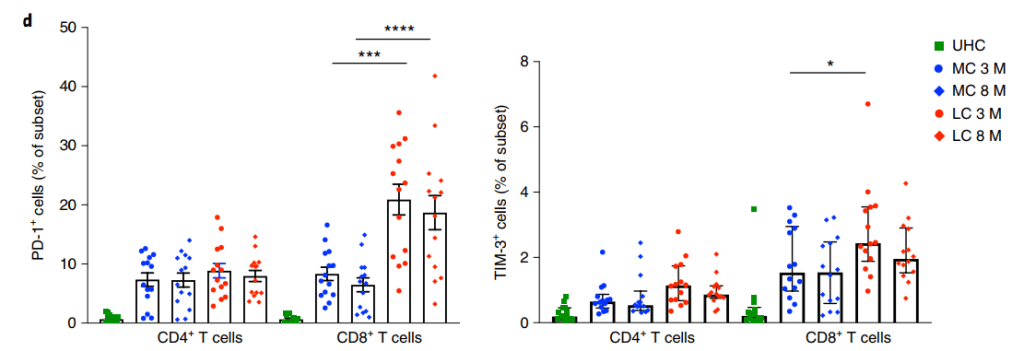
CD4+ T cells, but higher expression by CD8+ T cells was found in the LC group at both time points. Higher TIM-3 expression on CD8+ T cells was observed
in the LC group at 3 months. Data are shown as median with IQR. Two-tailed P values <0.05 (*), <0.01 (**), <0.001 (***) and <0.0001 (****) were considered significant. A Wilcoxon t test was used for paired samples, and a Mann–Whitney t test was used for unpaired samples
Tim-3, aka HAVCR2, is a binding partner of galectin. It may be present on the same T cell as the PD-1 programmed cell death receptor.
This is in keeping with a mouse model of a chronic CMV infection study” In this study, we found that, although Tim-3 was transiently expressed by CD8 T cells after acute LCMV infection, it was rapidly down-regulated, whereas CD8 T cells retained high Tim-3 expression throughout chronic LCMV infection. Moreover, Tim-3 was mainly coexpressed with PD-1 on virus-specific CD8 T cells during chronic infections. Importantly, this subset of CD8 T cells coexpressing Tim-3 and PD-1 (Tim3+PD1+) showed the phenotypic and functional characteristics of more severely exhausted CD8 T cells than did those expressing only PD-1 (Tim3−PD1+). Finally, simultaneous in vivo blockade of Tim-3 and PD-1 pathways had synergistic effects in restoring antiviral immunity and viral control compared with blockade of either pathway alone. Collectively, these results indicate that Tim-3 and PD-1 pathways may cooperate and independently contribute to negatively regulate CD8 T cell responses during chronic viral infections. ” Jin et al 2010
Where to go next...
Things are starting to come into focus as to where we can go in this study. Here are some areas for more reading.
- INFβ is important in the nervous system. Could this cytokine explain some of the nervous system symptoms of Long Covid? Lot’s on PubMed to followup on
- CD38 in non lymphoid cells may or may not fit the Cu+ half of Cu(I)NA2, but it fits the niacin and NAD+ aspect of things.
- This research has backed up previous reports that PD-1 and CD8+ cytotoxicT cell exhaustion is important. We know from previous studies that Cu is important in preventing this. Even more exciting, PD-1/Tim-2 have been associated with T cell exhaustion with chronic viral infections.
Leave a Reply