Category: infections
-
Copper and Borrelia
This post is a continuation of the Cu+ binding protein BicA in Borrelia killing.
[1] The Bondarczuk and Piotrowska-Sege Review
These Polish authors introduce their review by telling us that copper is an essential cofactor for enzymes like cytochrome C oxidase and Cu/Zn superoxide dismutase. The we are told that too much copper can be toxic. What may be new to some of our readers on this site is the concept of an operon and environmental regulation of gene expression. Something happens and the bug not only starts transcribing blue prints for one protein but a whole bloody lot of related proteins to solve a certain environmental challenge. Let’s take ourselves a little tour of this concept that might be new to some of us. Lactose is a disaccharide of glucose and galactose. Bacteria have to produce enzymes to properly digest it.
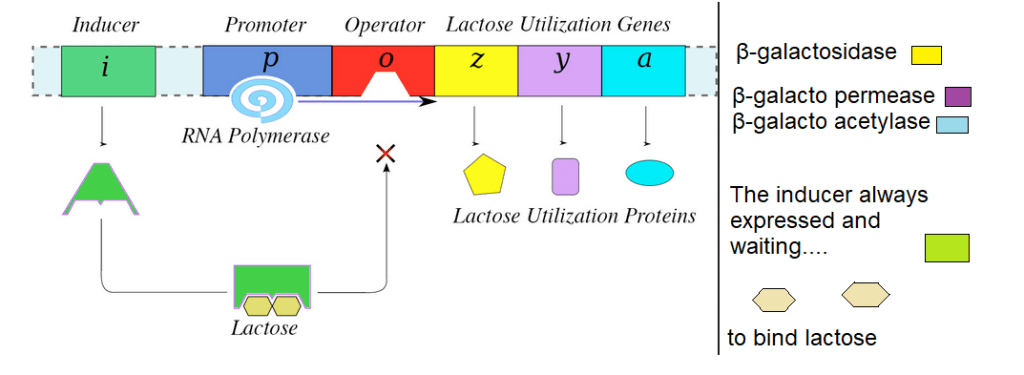
LacI, the inducer, is always expressed. It is waiting to bind lactose. The LacI gene sits upstream of the promoter, the place where RNA polymerase attaches and starts transcribing messenger RNAs for the genes LacZ, LacY and LacA. When these mRNA are translated into proteins the cell can bring in lactose. LacI binds to lactose and undergoes a shape change that allows it to bind to the operator. This blocks transcription of the lactose utilization genes so that the bug does not waste energy making more proteins to bring in lactose that it already has enough of.
The Cus operon, dealing with copper
The cus system codes for four proteins.
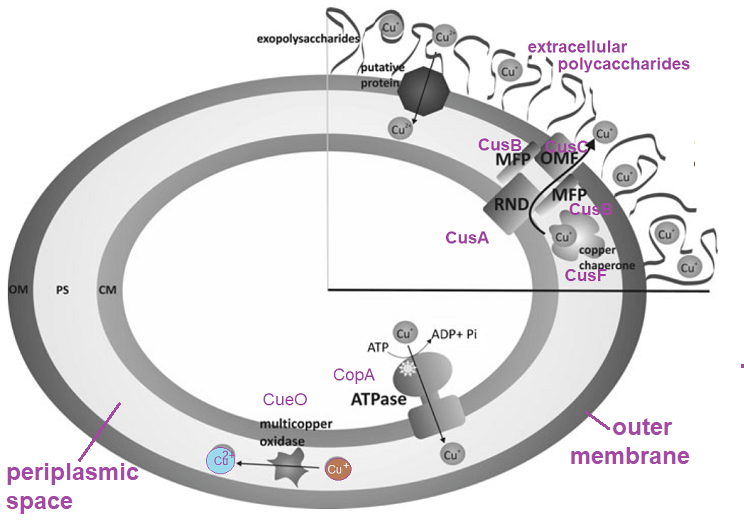
- CusA is thought to transport Cu+ from the periplasm.
- CusB is thought to be an adapter protein that interacts with CusA.
- CusC, a member of is anchored into the outer membrane
- CusF is a periplasmic chaperone that may interact with CusB. It may be able to bind Cu+ and Cu2+.

These are some images of the Cus proteins from the rcsb.org database. The interesting thing to note is that CusF has a small domain that can bind mono and divalent metal ions.
the cop operon of E coli
The authors introduced the CueR regulates the expression of two genes: cueO and copA . CueO is a periplasmic multi copper oxidase. This enzyme oxidizes Cu (I) to a less toxic Cu (II) and reduces dioxygen to water through four single-electron transfer steps. The CueO activity is oxygen dependent. This post is going to skip the Cue family of proteins and go directly to the Cop proteins.
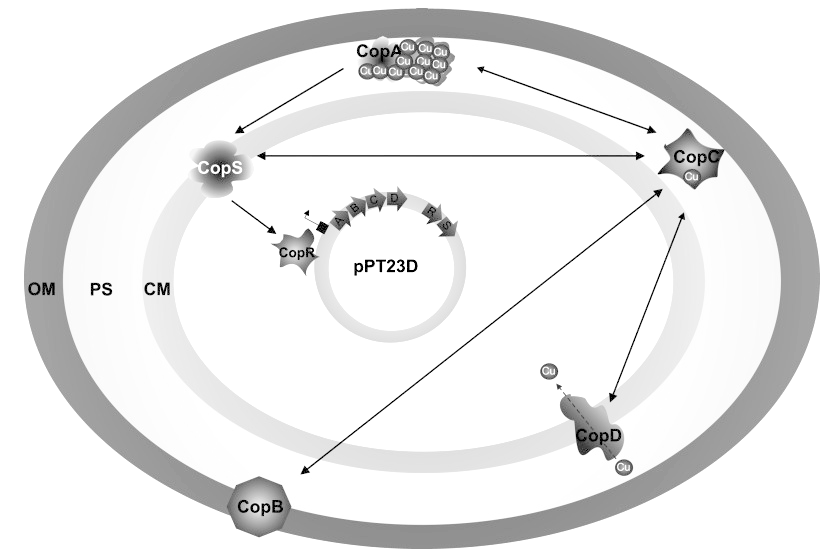
- CopA transports Cu+ out of the cytoplasm at the cost of ATP.
- CopB is an outer membrane protein with dubious copper binding properties.
- CopC is a soluble periplasmic chaperone folded into a Greek key β barrel with two distinct but interdependent binding sites for Cu+ and Cu2+.
- CopD may transport may with CopC and deliver essential copper through the inner membrane to the cytoplasm.
- CopS is the copper sensor. Like LacI it is constantly expressed regardless of the copper in the environment. CopS may interact with CopA or CopC.
- CopR interacts with the copper sensor CopS and controls the transcription of genes of the cop operon.
So many of these E coli proteins are partial to Cu+. Do similar operons exist in Borrelia? The sequence of the E coli CopC protein was used to search the Borrelia database on ncbi and nothing came up.
Copper operons in Borrelia, they are not the same
BmtA getting metals in the spirochete [2]
We have a focus on Borrelia and Lyme disease. A recent review discusses all of the moving parts of transporting the metals needed for growth while keeping them from becoming toxic in the life cycle of Borrelia.
This review just did not seem to be that concerned with copper. There are some interesting philosophical points in going from a rod to a spirochete.
E coli vs B burgdorferi [3]
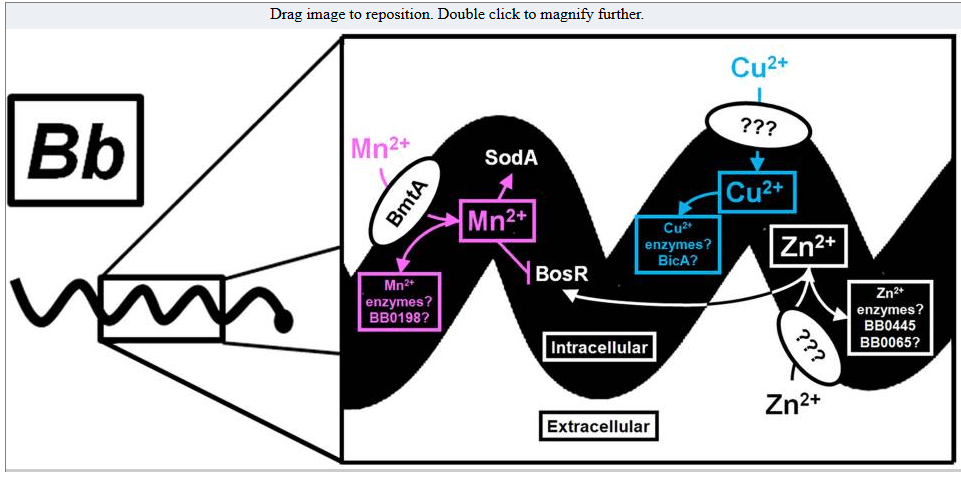
The Borrelia burgdorferi Fur homologue, also known as Borrelia oxidative stress regulator (BosR), promotes spirochetal adaptation to the mammalian host by directly repressing the lipoproteins required for tick colonization and indirectly activating those required for establishing infection in the mammal. Here, we examined whether the DNA-binding activity of BosR was regulated by any of the four most prevalent transition metal ions in B. burgdorferi, Mn, Fe, Cu, and Zn.
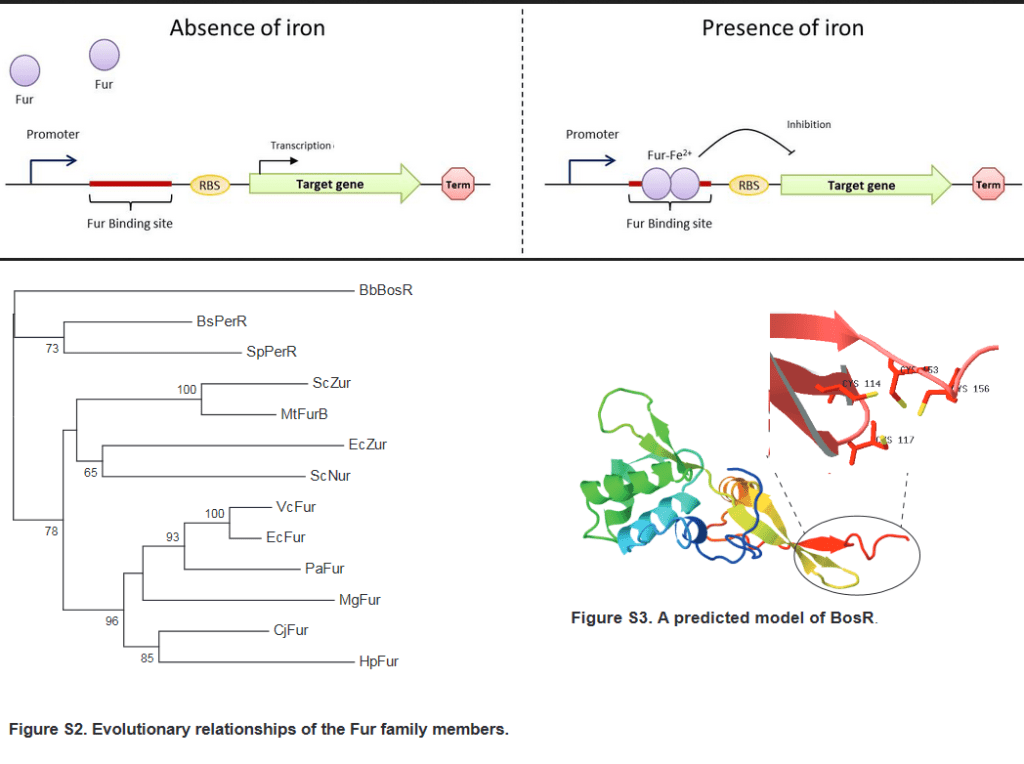
Fur acts as a dimer transcription repressor in the presence of iron. The supplemental data shows the family tree of Fur transcription repressors along with the Borellia homologue BosA. BosA is proposed to bind metals via for conserved cysteines. A twist to the dominant paradigm of Fur is that i may also act as a transcription activator of very different genes whose transcription is repressed. [3] BosA has a “structural” Zn2+ that does not contribute to turning on or off its transcription repression. It does bind about four iron or coppers per dimer. [3] The addition of up to 10 μM Fe2+ and Mn2+ had no effect on the ability of BosA to bind to DNA. Cu2+ and Zn2+ caused a dose dependent decrease in DNA binding. When the reducing agent TCEP was added to the binding reactions, Cu+ failed to inhibit binding. These cations could also displace BosA already bound to DNA. Cu2+ was found to bind to BosA with higher affinity than Zn2+
Outer surface protein A, OspA, is thought to promote survival in the tick between blood meals. Simultaneous with the disappearance of OspA, the spirochete population in the midgut begins to express an OspC and migrates to the salivary gland. Upregulation of OspC begins during the first day of feeding and peaks 48 hours after attachment.
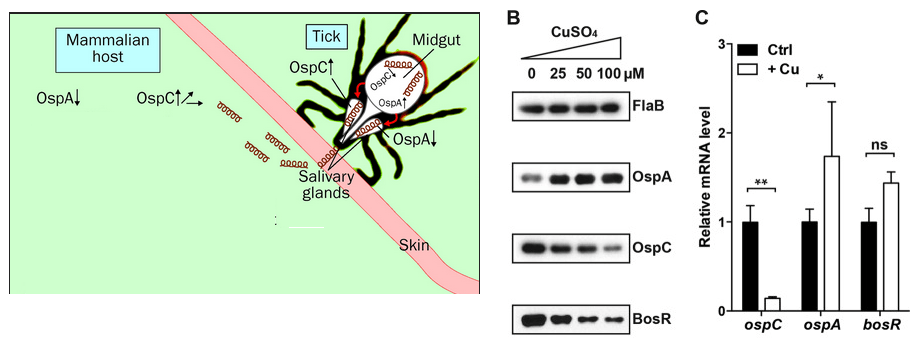
In the above image OspA is high in the midgut while OspC expression is low. Note that copper is taking OspA and OspC in opposite directions of what happens to them when they jump to the mammalian host.
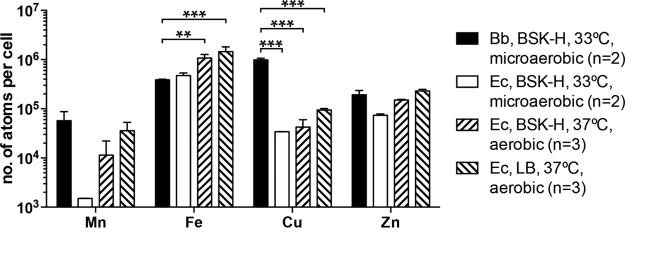
Cellular Cu level is much higher in B. burgdorferi (Bb) than in the model organism E. coli (Ec). The Mn, Fe, Cu, and Zn levels in the B. burgdorferi type strain B31 and the E. coli K-12 strain TOP10 were determined by ICP-SFMS. Both were cultivated microaerobically at 33°C to early stationary phase in the BSK-H medium (Sigma-Aldrich). In addition, TOP10 was cultivated aerobically at 37°C in the BSK-H medium and in LB. Data represent means (plus SD) of two or three biological replicates. P values are derived from a two-way ANOVA, followed by Bonferroni post test. For clarity, only P values for comparisons between B. burgdorferi and E. coli are shown: **, P < 0.01; ***, P < 0.001. [3]
Conclusions
We covered the Lac Operon, the textbook example of how gene transcription responds to environmental changes. We’ve covered two operons in E coli that help this bug respond to potentially toxic amounts of copper. Even though Borrelia is also a Gram Negative bacterium, it seems to have slightly different ways of dealing with copper as it moves from tick to mammal.
References
- Bondarczuk K, Piotrowska-Seget Z. Molecular basis of active copper resistance mechanisms in Gram-negative bacteria. Cell Biol Toxicol. 2013 Dec;29(6):397-405. PMC free article
- Troxell B, Yang XF. Metal-dependent gene regulation in the causative agent of Lyme disease. Front Cell Infect Microbiol. 2013 Nov 15;3:79. PMC free article
- Wang P, Yu Z, Santangelo TJ, Olesik J, Wang Y, Heldwein E, Li X. BosR Is A Novel Fur Family Member Responsive to Copper and Regulating Copper Homeostasis in Borrelia burgdorferi. J Bacteriol. 2017 Jul 25;199(16):e00276-17. PMC free article
- Neubert MJ, Dahlmann EA, Ambrose A, Johnson MDL. Copper Chaperone CupA and Zinc Control CopY Regulation of the Pneumococcal cop Operon. mSphere. 2017 Oct 18;2(5):e00372-17. PMC free article
-

BicA and Borrelia
Introduction
The featured image was adapted from a cartoon on the CreativeBioLabs website. This company is trying to develop a Lyme Disease vaccine. Two Borrelia proteins will be discussed. BmtA is the Borrelia metal transporter. We are not sure if it transports metal ions across the inner or outer membranes. We are also not entirely sure if BicA is in the periplasmic space or in the interior of the spirochete.
Metals inside Borrelia
Na+, K+, and Mg2+ are abundant metal cations in the environment and in all living cells. Trace elements in the environment may be cofactors in structural proteins and enzymes that catalyze reactions essential for life. A group of investigators from
- the Divisions of Geographic Medicine and Infectious Diseases at Tufts University
- Geographic Medicine at Tufts University
- the Trace Element Research Laboratory at Ohio State University
used a technique called Inductively Coupled Plasma-Sector Field Mass Spectrometry (ICP-MS) to measure the transition metal content of Borrelia burgdorferi. ICP-SFMS is simply more sensitive than the traditional ICP-MS. These authors discovered that manganese, iron, copper, and zinc are the most abundance trace minerals in Borrelia burgdorferi. [1] All of these metals are important cofactors in proteins needed to sustain life.
When essential Fe and Cu go bad
Iron and copper are particularly notorious for transferring electrons from one place to another. When these elements transfer electrons to molecular oxygen, reactive oxygen species are generated. Sometimes this superoxide generating reaction happens unintentionally in the electron transport chain. The two oxygen in O2 are generally linked together by a double bond. When two of those electrons “switch” to a vacant “spot”, these unpaired electrons are available to form pairs with incoming electrons. Once this pairing takes place, there is no going back to the double bond O2. A rule in chemistry prevents oxygen atoms from being surrounded by more than eight valence electrons. We are left with an unpaired electron, something Nature does not tolerate for too long.

Our friendly, neighborhood superoxide radical finds a suitable place to dump that extra electron: Cu2+. These are the Fenton and Haber Weiss reactions.

O2â—- is superoxide. The “â—” is the unpaired electron. â—OH is the hydroxyl radical. Wikipedia authors have a lot to say about how damaging this radical is to macromolecules in both the pathogen and the host. This, good readers, is how copper kills. Make careful note of hydrogen peroxide, H2O2. We will encounter this reactive oxygen in the next section. How does this Lyme Disease spirochete keep these essential trace elements from doing it harm?
Introducing BicA
This study follows in the footsteps of a previous study showing that BicA, an iron binding protein that is a member of the DNA binding Proteins of Starved bacteria. [2] BicA was found to be required for Borrelia survival in the tick as well as transmission to the host. Because Borrelia can grow without iron, Wang and coauthors hypothesized that the purpose of BicA was to detoxify iron and other transition metals. They used two infectious strains of Borrelia: B31 and 297. Wang and coauthors genetically engineered BicA (the putative heavy metal chaperone) and bmtA out of Borrelia.
Fig 1 BicA concentrates Cu and Fe in Borrelia.
In panel A we see that the wild type B31 spirochete has more Fe and Cu atoms per cell than the spirochetes lacking the gene that codes for the BicA protein. In panel B we are looking at the role of bmtA. Not having it increases the number of Fe atoms per cell and almost totally eliminates Cu from the spirochetes. That Cu content was decreased more than Fe content in the BicA lacking bugs was most unexpected as dps family members are generally thought of as Fe binding proteins.
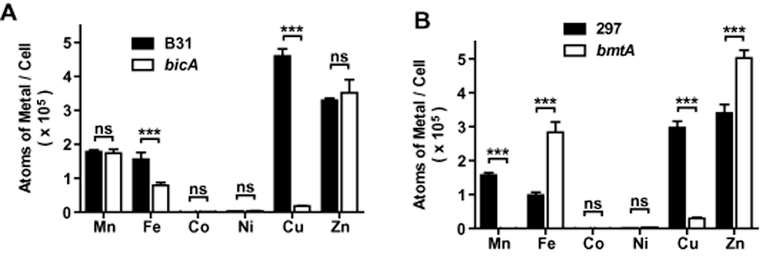
Spirochetes were grown at 33°C to early stationary phase in the BSK-H media. ICP-FSMS was used to measure the metal ion content of the bugs. Data represent mean (± s.e.m.) of three independent samples. P-values are derived from a two-way anova followed by Bonferroni post-test: ***P < 0.001; ns, P > 0.05. bmtA is also known for its transport of manganese.
Figure 2. Concentrating metals in Borrelia
What is the concentration of these transitions metals in BSK-H medium and what is the concentration in the bugs… assuming they are shaped liked cylinders. Panel A just shows the BSK-H medium concentration of these metals in micromolar. Panel B, the fold concentration of our two pathogenic strains.

For the non-scientist, concentrating over “103 ” is a 1000x concentration. A 101 concentration is just 10x.
Figure 3. The Cu+ binding domain of BicA
Figure 3 is a followup on Figure 1. This post will not present all of this figure to the lay reader. To make a long story short, the cysteine concentrated region (CCR) has been shown in similar proteins to become fluorescent when it binds to Cu+. The authors were able to show a similar fluorescence with purified BicA protein. Some site directed mutagenesis was also performed. Fe likes to bind to acidic amino acids glutamate (E) and aspartate (D) in the ferritin like Dps core. These amino acids were mutated to similar amino acids with neutral side chains. In this case the positive charge (blue) neutralizes the negative (red) charge. The Fe binding sites are starred. Likewise the 6 cysteines were mutated to alanines. Alanines are cyteines without the thiol (SH) group.

Note that the wild type BicA protein binds seven coppers. Get rid of the six cysteines and the ratio goes down to only one Cu per BicA molecule. Get rid of the aspartate and the glutamate as well and the ratio is still one. Perhaps that one Cu is binding to the histidines. At any rate, this protein is most remarkable. Purified BicA seems to bind more Cu (7 atoms) than what is seen per spirochete cell (Figure 1A, 4-5 per cell). Is BicA doing anything to protect this Borrelia spirochete against the reactive oxygen species discussed in the introduction?
Figure 4 BicA, Borrelia growth in Fe and Cu
Wang and coauthors grew Borrelia in BSK-H media in the presence of indicated amounts of copper and iron. The Medscape reference range for free copper in our blood serum is 1.6-2.4 μmol/L. The Medscape reference range for free iron in males is 14-32 μmol/L. Note that 14-32 μmol/L is the same as 14-32 μM.
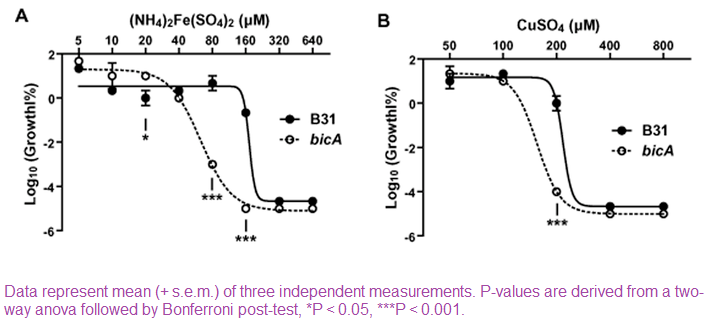
The “Log10 (Growth %)” units on the Y -axis requires a pause to understand. Log10 of 100% is 2. At the lowest concentrations of Cu and Fe tested the bugs are lumbering along at close to 100% of normal growth. A -4 Log10 Growth % is growth at 0.0001% of normal growth. There is a ± BicA tipping point. For Fe that point occurs at about 80μM. For Cu the tipping point is between 100-200 μM. Not having BicA â—‹ leads to less % normal growth. Recall the trouble that is generated when Cu mixes H2O2.
Figure 5, Enter H2O2
Panels 5A-5B compare Wild type (WT) and BicA knock out Borrelia in the presence of H2O2 with or without Cu and Fe. We can get the story with just these three panels.
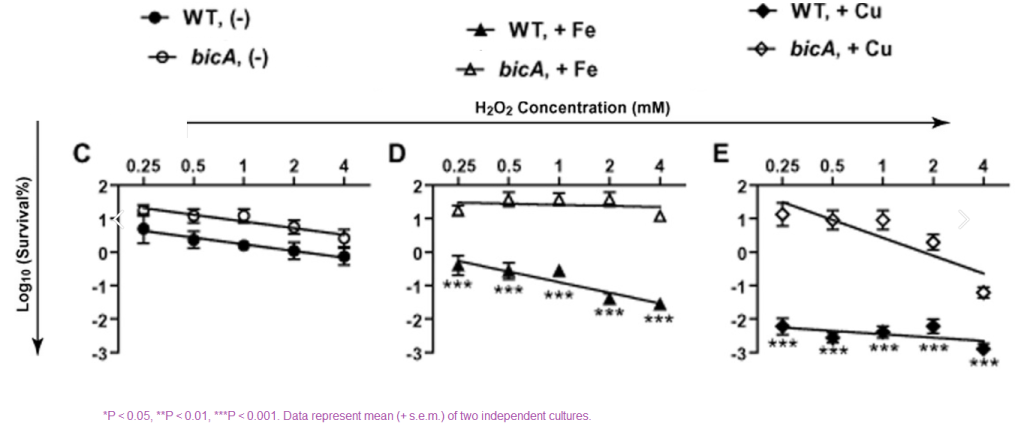
Panel C tells us that H2O2 kills Borrelia. Having BicA does not make much difference as long as there is no extra Fe or Cu present. Note that “survival” is not the same thing as % normal growth in Figure 4. It is possible to be alive, just not growing. When we start adding Fe or Cu, the killing starts. Having BicA â— really drops the survival.
What does this mean?
The working hypothesis is that having this Cu+ around is a good thing until an immune cell starts releasing H2O2.
References
- Li X, Wang P, Lutton A, Olesik J. Trace Element Analysis of Borrelia burgdorferi by Inductively Coupled Plasma-Sector Field Mass Spectrometry. Methods Mol Biol. 2018;1690:83-94.
- Wang P, Lutton A, Olesik J, Vali H, Li X. A novel iron- and copper-binding protein in the Lyme disease spirochaete. Mol Microbiol. 2012 Dec;86(6):1441-51. PMC free article
-
Is Lyme Disease in my brain?
This post is a retrospective look back at 2022 publications regarding Lyme Disease and what it might mean for those taking CopperOne for Lyme like symptoms. The blood based tests still fail to deliver. Clinics all over the U.S. offer tests for antibodies in the CSF. Antibody producing centers called tertiary lymphoid organs are introduced.
finding evidence of Borrelia antibodies in the blood
Back in 2019 a Dutch group of scientists published the design of a clinical trial to test a better method to detect chronic Lyme Disease. Some of the short comings of traditional tests include:
- Production of antibody takes time and may decrease if antibiotic treatment clears the Borrelia in the circulation. [1]
- ELISAs and immunoblots used in Europe may be up to 95% for late manifestations, but as low as 50% for early localized disease (EM)
- IgM to IgG-sero conversion antibodies oftentimes remain present in the blood for many years. [1]
The authors used four tests. The desired outcome was for the lymphocyte assay to successfully respond to Borrelia antigens. The outcome of the clinical trial some three years later was that it did not live up to expectations. [2]
- Spirofind Revised (Oxford Immunotec)
- QuantiFERON-LB (QIAGEN Sciences)
- the Lyme iSpot (Autoimmun Diagnostika / Genome Identication Diagnostics), and
- the Lymphocyte Transformation Test-Memory Lymphocyte Immunostimulation Assay (LTT-MELISA, InVitaLab).
While some may think that fibromyalgia is really chronic Lyme Disease, T-lymphocyte reactivity to Borrelia burgdorferi sensu stricto (full antigen), outer surface protein (Osp) did not difer between fibromyalgia and healthy controls. [3]
Chronic Lyme, it really is in your head
This post is not going to waste any more time going over details of blood tests that have failed to detect PTLD. There are plenty of clinics that are testing for this but and antibodies against this bug in the cerebral spinal fluid (CSF). The University of Michigan , University Hospitals, and University of Rochester Medical Center test for LD antibodies in the CSF. Most of these websites have almots the same information regarding other tests that may be ordered as well as the risks of lumbar punctures.
How does Borrelia get from the blood into the CSF. This is covered in the Thompson review. Here are a few images from the review. This review has little to say about Borrelia because we really don’t know that much. [4] The review is a nice way of coming to an understanding to this important barrier.

The reader is invited to visit the previous post brain copper transport. The ATP7A Cu+ transporter is responsible for getting Cu+ into the brain. Failure to do so in Menke’s Disease results in neurological deficits. Perhaps this transporter is also a way to kill Borrelia in the CSF. This post covers transporters in the choroid plexus that might transport niacin as well.
Why are Borrelia antibodies in the CSF?
Even though the Mitsdoerffer and Peters review [5] is focused on the autoimmune disease multiple sclerosis, they have some interesting things to say about tertiary lymph organs in the brain. Antibody producing plasma cells may reside in these organs as well as in the bone marrow.
In the panel on the left, an image of the meninges has been inserted to convey the notion that these layers constitute a place for B cells to take up residence. In the context of this image, the parenchyma is the neurons and glia of the brain proper. Plasma cells are the produces of antibodies we see in the CSF in MS patients and perhaps in LD patients. The image on the right is of more developed structures with more, chemokines, T cells, and a few dendritic cells in the center.
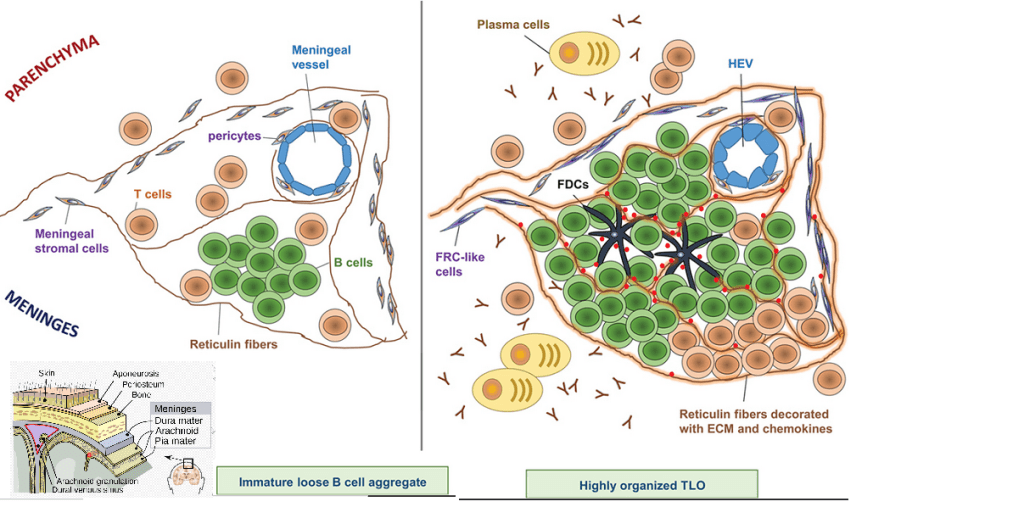
“Further characteristics are a T-cell zone populated by naïve T cells and central memory T cells recruited from the blood; high endothelial venules (HEV); and a network of stromal cells that provide chemokines and extracellular matrix (ECM) for cellular migration and structural integrity” Wikipedia has a good page on tertiary lymph organs that goes beyond LD to tumors, but still does not discuss neuroborreliosis.
Does this search for “the latest” mean anything?
A recent study of neuroborreliosis patients in the Netherlands revealed that many of them and antibodies in their CSF but not their serum. [6] The authors speculated that their results might mean lowering the thresh hold for a lumbar puncture…. which seem to be available in the U.S. at multiple locations. If CopperOne is helping patients with neuroborreliosis, perhaps we need to look to the CSF rather than the blood to see evidence. The Mitsdoerffer and Peters review discussing chemokines and so on associated with tertiary lymph organs that we can speculate exist in LD. The perplexing part is that LD antibodies in the CSF as a measure of killing won’t work for the same reasons why antibodies in the serum don’t always predict bacterial loads.
References
- van de Schoor FR, Baarsma ME, Gauw SA, Joosten LAB, Kullberg BJ, van den Wijngaard CC, Hovius JW. Validation of cellular tests for Lyme borreliosis (VICTORY) study. BMC Infect Dis. 2019 Aug 20;19(1):732. PMC free article
- Baarsma ME, van de Schoor FR, Gauw SA, Vrijmoeth HD, Ursinus J, Goudriaan N, Popa CD, Ter Hofstede HJ, Leeflang MM, Kremer K, van den Wijngaard CC, Kullberg BJ, Joosten LA, Hovius JW. Diagnostic parameters of cellular tests for Lyme borreliosis in Europe (VICTORY study): a case-control study. Lancet Infect Dis. 2022 Sep;22(9):1388-1396.
- Puri BK, Lee GS, Schwarzbach A. Is Fibromyalgia Associated with Borrelia-specific T Lymphocytes? Curr Rheumatol Rev. 2022;18(2):157-159.
- Thompson D, Brissette CA, Watt JA. The choroid plexus and its role in the pathogenesis of neurological infections. Fluids Barriers CNS. 2022 Sep 10;19(1):75. PMC free article
- Mitsdoerffer M, Peters A. Tertiary Lymphoid Organs in Central Nervous System Autoimmunity. Front Immunol. 2016 Oct 25;7:451. PMC free paper
- Zomer TP, Bruinsma R, van Samkar A, Vermeeren YM, Wieberdink RG, van Kooten B, van Bemmel T. Lyme neuroborreliosis with antibodies in cerebrospinal fluid but not in serum. Eur J Neurol. 2022 Nov 12.
-
Bacteria Surface Charge
Wilhelm MJ, Sharifian Gh M, Wu T, Li Y, Chang CM, Ma J, Dai HL. Determination of bacterial surface charge density via saturation of adsorbed ions. Biophys J. 2021 Jun 15;120(12):2461-2470. PMC free article
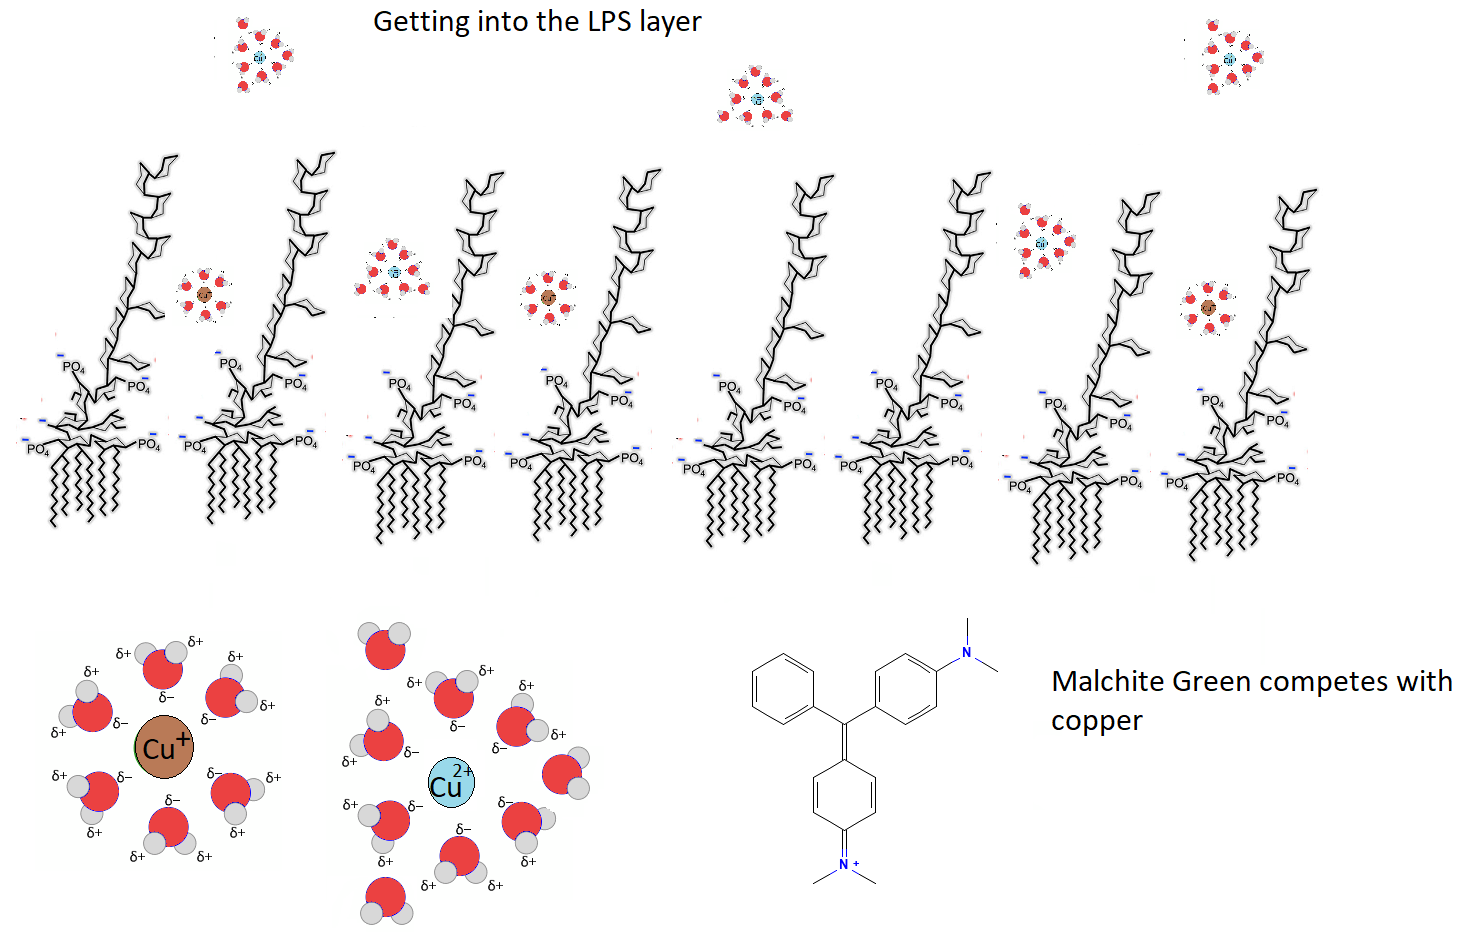
The goal of this post is to introduce lay people to the work of the Michael Wilhelm and colleagues at Temple University in Philadelphia, Pennsylvania. The question has been asked if Cu+ or Cu2+ changes the surface of bacteria more than the other.This report is full of insights and one tidbit as to why Cu+ might be the better biocide.
The feature image tells the hypothesis this paper inspired. Malachite green is a reporter probe that binds to negative charges on bacteria cell walls just like Cu+ and Cu2+ do. The hydrated radius of Cu+ is predicted to be smaller than that of Cu2+and can more easily diffuse into the cell wall. Neutralization of phosphate negative charges should prevent binding of the MG reporter.
 Structures of bacteria cell walls
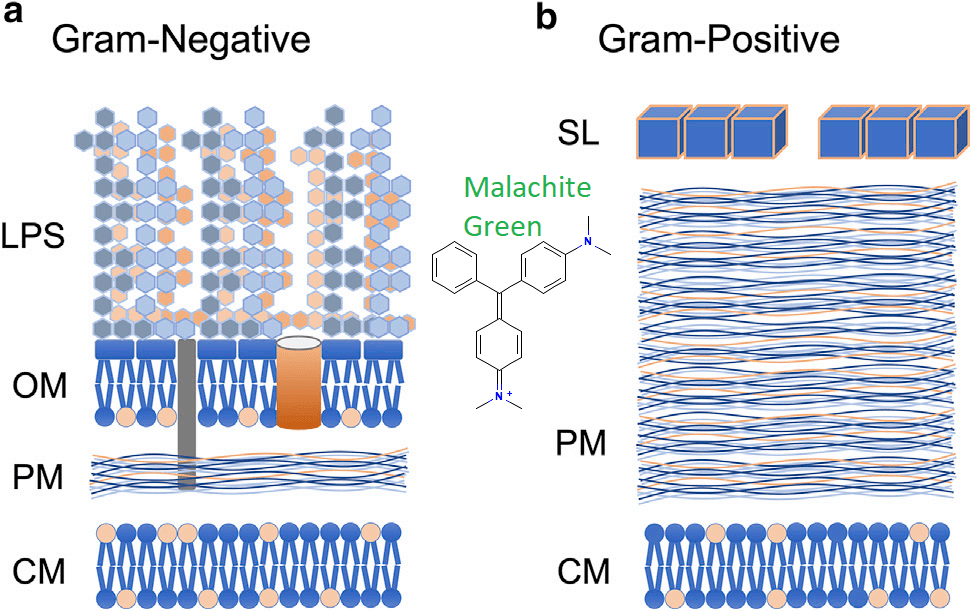
- OM The outer membrane of phospholipids. In gram negative bacteria, lipopolysaccharide, LPS is part of this layer. The authors estimated 2-8nm wide water channels in this layer.
- PM Gram positive bacteria have comparatively more piptidoglyan mesh (PM) Both have an inner cytoplasmic membrane (CM). Note the comparative thickness of PM in Gram positive bacteria. Pores in these structures are 7-12nm wide.
- CM Gram-positive cells have only a single phospholipid membrane, the inner cell membraneCM. The PM layer is much thicker. which is surrounded by a substantially thicker PM. Gram-positive bacteria also have an S-layer of crystalized proteins on their surface. All of these substances have the potential to bind copper and other antimicrobial compounds.
- SL is a shell of crystallized proteins on the surface layer of Gram positive bacteria. The bacterial S-layer is a homogeneous protein wall, self-assembled into a crystalline lattice with regularly spaced pores of distinct symmetry (e.g., oblique, square, hexagonal) Negatively charged amino acids predominate this protein layer.
- MG, malachite green, a 1nm wide hydrophobic dye that is 5-% in the +1 charge state at pH 6.9. This makes it small enough to diffuse to the cell membrane. The MG cation has an electronic absorption band near 400 nm and consequently its second order nonlinear polarizability is resonantly enhanced when exposed to fundamental light of 800 nm. Neutral MG lacks these electronic transitions. Only surface bound MG cations can be observed. MG may diffuse across lipid bilayers. These appear to be SHG.
All of these layers tend to have a negative charge and therefore the potential of binding mono and divalent cations and the malachite green probe used in these experiments. There is a time component of diffusion through these layers too. In these experiments Lactobacillus, L. rhamnosus was the representative Gram-positive bacterium and Escherichia, E. coli the representative Gram-negative bacterium.
Three techniques were used
- SGS/SHG Second Harmonic Light Scattering occurs when a portion of an incident light of frequency ω is converted to 2ω after interacting with a material. This is a two photon process by which two photons of the same initial energy interact with a nonlinear material and combine to produce a single photon of twice the energy, twice the frequency, and half the wavelength… s new color that is blue shifted from the initial incident light. Probes that generate such signals are SHG.
- Light phase microscopy to estimate cell surface area
- Zeta potential was used to measure total charge absorption
On MG binding to cell membranes
Adsorption of MG cations onto bacterial surfaces occurs primarily through an attractive electrostatic interactions with the OM of LPS or the S layer of Gram positive L rhamnosus. Then it migrates inward with the final destination of the cell membrane. It was not if the peptidoglycan layer is electronically silent. In Figure 7 we see that there are multiple components of LPS.
The concentration dependent signal response at each interface allowed the authors to construct Langmuir adsorption isotherms, which allowed for the calculation of charge density. Brightfield transmission microscopy was used to estimate the surface area that would ultimately be used to determine the charge density.
Both cell types exhibit an outer layer responsible for rapid binding. Diffusion through water filled channels to the cell membrane might represent the drop in the SHS signal.
Saturating negatively charged groups with MG+
Once saturation is achieved and no more can be absorbed, there is no further increase in the SHS signal. The authors noted that any SHG-active cation, not just MG ion, can be used as the surface charge probe. Crystal violet, the basis of staining Gram positive, is SHG active as is propidium.

To determine the saturation density of MG cations adsorbed on the external surface of the bacteria, the authors measured Langmuir adsorption isotherms by plotting the SHS peak intensities (deduced from data in Figure 4,
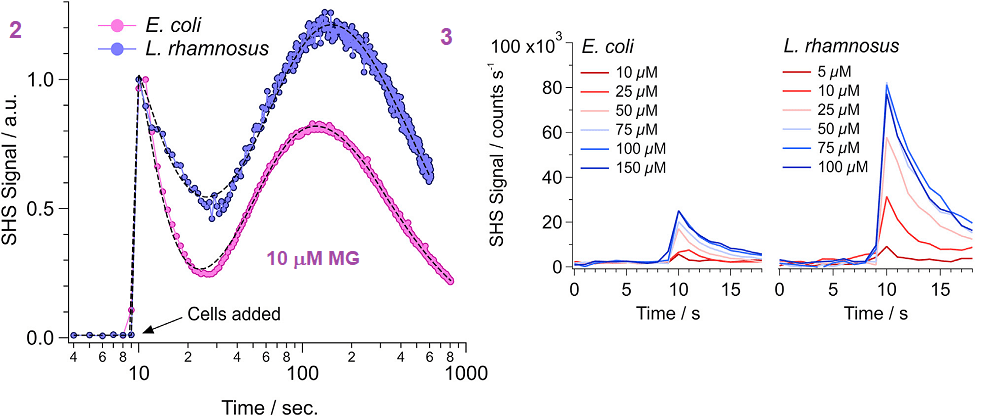
Figure 4 Each point is the average of three experiments ± the standard deviation of the mean. Note that Gram negative E coli requires significantly more MG to saturate the outer layer of the surface. These experiments were performed at the pKa of MG, pH 6.9 at which half the MG will be by definition carry a charge of +1. As the MG cation concentration increases, the magnitude of the measured SHS signal likewise increases.
- The flat portion of this curve represents all accessible negatively charged sites being occupied by MG. If Cu+ were present, this saturation would be predicted to occur at a lower MG concentration. For L. rhamnosus, saturation occurs at 5.8 mM, whereas and70.3 mM for E coli.
- At saturation, four times more SHS signal is measured for MG cations interacting with L. rhamnosus (~80,000 counts/s) than E. coli (~20,000 counts/s).
Unlike SHG, zeta potential measures the total charge and is not specific to the outermost bacterial surface (e.g., the outer surface of the OM). Zeta-potential results from the cumulative charge of the entire bacterial cell wall complex, including contributions from both sides of both the OM and inner membrane, as well as the peptidoglycan. Cationic MG has access to all anionic-binding sites within the bacterial cell wall complex and is able to neutralize them all.
Calculating charge density
This process was repeated for more than 325 cells of each strain. E. coli and L. rhamnosus are very similar in size: 2.8 mm long by 1 mm wide. E. coli has a slightly larger average surface area of 11.0 ± 1.5 mm2 compared with 10.1 ± 1.4 mm2 for L. rhamnosus. Mathematical analysis took into consideration the total quantity of MG in the solution and on the bacterial surfaces is constant thus  permitting the  determination of surface density (Nmax) as well as the equilibrium adsorption constant These parameters allowed for the calculation of the free energy of adsorption (ΔGads).

Discussion
In Gram Pos bacteria MG” is restricted to the surface layer of proteins with a lot of negatively charged amino acids, 7b. Gram Neg surface charge is really a 3D matter of vertically packed phosphates on LPS that can bind multiple MG+ cations. In panel 7b MG+ is binding to multiple phosphate groups on one small plot of surface area.

MG cation saturation density of 6.6 ±1.3 nm-2 suggests an average net anionic charge of q = 5.5 ± 1.6 for each of the LPS in the strain of E. coli used in this study. This agree with results of previous studies that the authors cited.
This value is reasonably consistent with previously deduced
- Salmonella minnesota (q ≥≥ 5),
- Chromobacterium violaceum (q ≥ 4),
- Rhodobacter capsulatus (q ≥ 4.5),
- Paracoccus denitrificans (q ≥ 5)
- E. coli (q ≥ 5)
Apparent contradictions in these data
- MG bond on the surface of L. rhamnosus yields ~4x the SHS signal compared with E. coli.
- 7x more MG binds to E coli
MG may simply be more aligned and a better SHG in the Gram positive bacterium. Â This adsorption geometry is expected to yield a larger coherent nonlinear polarization from the adsorbed ensemble of MG cations through constructive interference. MG cations are predicted to be more tilted toward the surface plane when bound to LPS resulting in partial cancellation of the nonlinear polarizability and hence a smaller SHS signal.
Surface charge
- Gram positive, one cation per nanometer squared
- Gram negative, seven cations per nanometer squared
The SHS observations also allowed the measurement of Langmuir adsorption isotherms of MG cations on the outer surfaces of the two bacteria were strikingly different. The S-layer of Gram + has a small charge density compared to Gram negative:  ~1.0 ± 0.2 nm-2 vs   ~6.6 ± 1.3 nm-2 .    Mathematical analysis on a biophysical level indicate that charge-charge interaction based on charge density is the driving force for binding.
The inspired hypothesis
The makers of CopperOne claim that in spite of having only one +1 charge, Cu+ is more bactericidal than Cu2+. The former is predicted to have a smaller radius of hydration and perhaps more able to navigate the water channels of the cell surface and into the cell membrane where damage may be the most severe. Can SHS detect changes in the geometry of Gram Pos and Gram Neg bacteria cell walls upon binding to Cu+ and Cu2+?
-
Conidia charge and basal lamina binding
Wasylnka JA, Moore MM. Adhesion of Aspergillus species to extracellular matrix proteins: evidence for involvement of negatively charged carbohydrates on the conidial surface. Infect Immun. 2000 Jun;68(6):3377-84. PMC free article
This study came out of Simon Fraser University in Burnaby, BC, Canada.
Those of us in the desert southwestern U.S. are very familiar with fungal lung infections. Wasylnka and Moore mention in their introduction that cytotoxic chemotherapy patients and those with AIDS are immunocompromised and more susceptible to fungal infections. Here in the United States where advertising drugs on prime time t.v. is legal, immunosuppressive therapies for autoimmune diseases are advised not to be taken by patients who visit areas where “certain fungal infections are prevalent.” Indeed, most countries require testing for Aspergillis species on marijuana used for both medical and recreational purposes. Wasylnka and Moore followed the literature suggesting that conidia of Aspergillis species may adhere to components of the extracellular matrix of our airways. They tested the hypothesis that the conidia adhere to our airways via electrostatic interactions of negatively charged glycosaminoglycans to positively charged regions of these matrix proteins

Panels A and B came from the CDC. Panel C is from an extensive blog on medical mycology and shows conidia of A fumagatis. MATERIALS AND METHODS
Aspergillus strains and growth conditions.
The Aspergillus strains were purchased from the American Type Culture Collection, ATTC, or isolated from patients in B.C. The fungi were grown on a standard fungal agar until the spores/conidia were ready to harvest and enumerate.
Preparation of basal lamina from cultured lung cells.
The type II pneumocyte cell line A549 was also obtained from ATCC. These cells were gown in culture dishes in a a standard medium. The cells were removed with 0.1 M NH4OH (ammonium hydroxide) and then rinsed. The protein remaining consisted of what is called the basal lamina.Â
Peroxidase labeling of A. fumigatus conidia
Biotin is a small molecule that can be attached to large molecules like proteins while still exposing the Vidin site. Avidin can be attached to other molecules like peroxidases that make the whole assemble easy to detect. Peroxidase labeling of conidia was determined by previous work to not interfere with adhesion of the conidia to fibronectin, laminin, or type IV collagen….proteins of the basal lamina.
Adherence assays on glass slides.
Non specific sites on the fibronectin or authentic cell culture basal lamina were blocked with albumin, a major blood protein which was subsequently rinsed off. Conidia were allowed to adhere to the protein in PBS, phosphate buffered saline, a solution that buffers the mix to the same pH as blood using the same major buffering salts. After giving the conidia a time to bind, the slides were rinsed with a mild detergent to remove nonspecific, weakly bound conidia.
The strategy in images
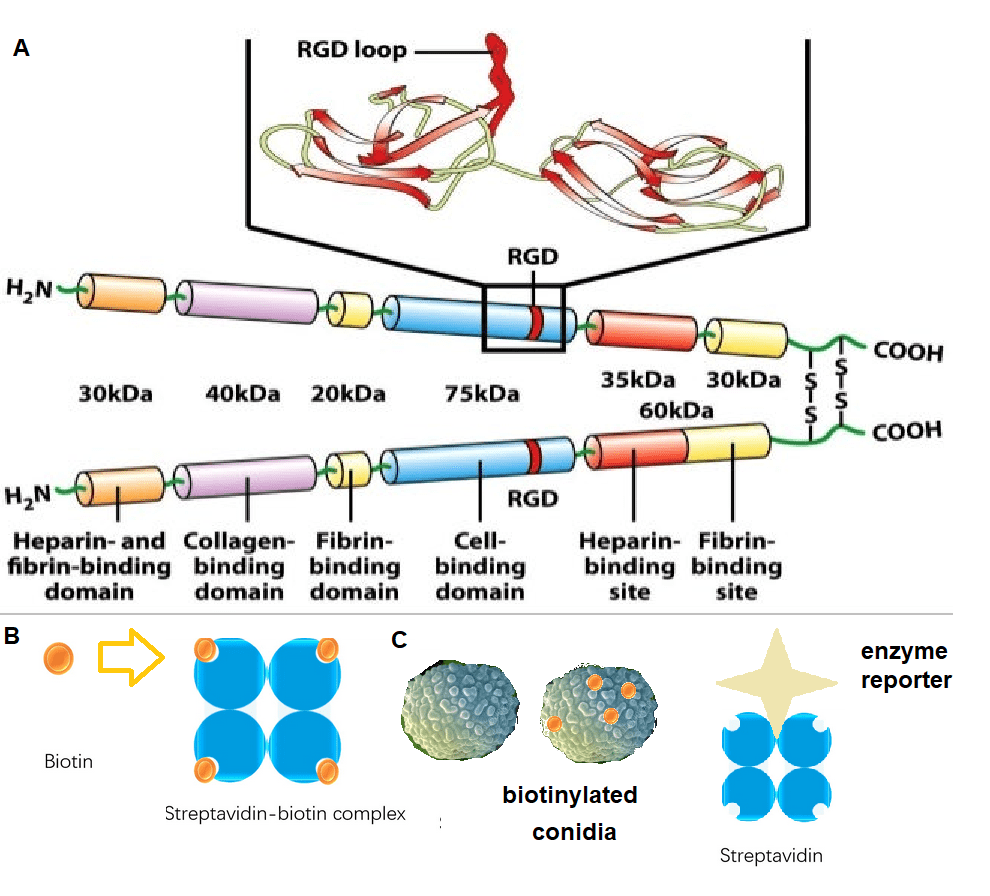
The basic experimental strategy. A. Domains of a fibronectin dimer. Image can be found at this link to a slideshare presentation of the extracellular matrix.. Summary of results
The bar graphs of Figures 1-4 illustrate These findings also available PMC free article in full form.
- This site has discussed the D614G mutation in the Covid spike protein giving it the ability to bind to integrins on the surface of many cells, that recognize the RGD peptide sequence. A slightly longer version of this sequence, GRGDS, failed to result in statistically significant less binding of the conidia to fibronectin compared to a sequence SGGDR. In simple lay terms, the conidia are not pretending to be endothelial cells binding to RGD motifs on the fibronectin.
- The ability of three fragments of fibronectin were tested for their ability to bind spores. Only the glycosamino glycan binding domain was able to bind the spores, albeit at a lower affinity than full length fibonectin. Neither the 45-kDa gelatin-binding domain nor the 120-kDa cell binding domain were able to bind conidia.
- Removal of glycosylation of fibronectin did not affect conidia binding. Denaturization (unfolding) of the fibronectin did affect binding.
- Removal of sialic acid glycosylation had no effect on conidia binding.
- We must remember that the conidia also have glycosylation. Three different polysaccharides were used to complete with conidia for sites of fibronectin and the cell culture grown basal lamina: dextran sulfate, chondroitin sulfate, keratan sulfate, and dextran. All four inhibited conidia from binding to fibronectin and cell culture basal lamina. High concentrations of NaCl also inhibited binding further implicating ion-ion interactions.

While electrostatic interactions were claimed to be part of the interaction, charges of strong binders versus weak binders were not measured.
Discussion highlights
The Wasylnka and Moore study presents evidence that negatively charged carbohydrates on the surface of A. fumigatus conidia may mediate adherence to fibronectin and intact basal lamina. These are some highlights of the discussion and some comments on possible copper binding:
- Alveolar basal lamina is a specialized ECM composed of laminin, type IV and V collagen, entactin, chondroitin sulfate proteoglycan, heparan sulfate proteoglycan, and fibronectin that might originate from the circulation and therefore be absent from the cell culture produced substrate.
- Extracellular matrix damage is thought to predispose a patient to aspirgilliosis. CopperOne and lysyl oxidase
- Diseased lungs were thought to have more fibronectin than healthy lungs.
- In the damaged lung, inhaled conidia may have increased access to fibronectin and other ECM proteins as a result of detached epithelial cells.
- The finding that A. fumigatus binds to fibronectin correlates with the observation that A. fumigatus infections account for over 90% of all cases of invasive aspirgiliosis
-
Neuro-PASC
Neuro PASC, after three weeks
It was common for patients hospitalized to develop encephalitis, an inflammation of the brain. It makes sense that these patients would develop long term neurological symptoms of what is now being called post acute sequelae of Covid-19. (PASC) Some Covid-19 patients who were never hospitalized, and who only experienced mild symptoms, have gone on to develop nuero-PASC as well.
Methods
A multi-center group of investigators recruited hospitalized, post hospitalized, and non-hospitalized patients with confirmed diagnosis of COVID-19 with neurologic symptoms in addition to healthy control (HC) subjects. Their blood plasma was assayed for three proteins- neurofilament light chain (pNfL), a marker for injured neurons
- plasma glial fibrillary acidic protein (pGFAP), a marker for astrocytes, nurse cells of neurons
- SARS-CoV-2 Nucleocapsid antigen (pN Ag)
Neurofilament (neurons), GFAP (astrocytes), and the ratio
This figure looks at two proteins from dead brain cells in the blood. Naturally there are more of these brain cell proteins in older individuals than in the young. When the ratio of GFAP to neurofilament is high, the pathology is more on the astrocyte side of things.
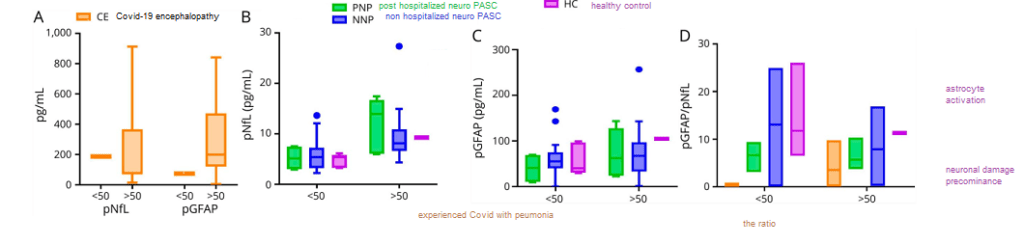
Figure 1 from Hanson 2020 [1] These data indicate the noise due to the age of the patient that will contribute to any serum protein or the ratio thereof.
A Covid protein in the blood three weeks after the first sign of symptoms

Figure 2 and Table 2 from Hanson 2020 [1] Age notwithstanding, the Covid-19 nucleocapsid was only seen in one of the PASC patients, and that patient was was never hospitalized. The really perplexing thing about these data is (1) the percentage of neuro-PASC patients that experienced most of the symptoms and (2) when there was a difference between the post hospitalized and never hospitalized patients, the never hospitalized patients fared the worse.
Neurological tests three weeks later
The patients were given these tests three weeks after the onset of acute Covid-19 symptoms. They are still impaired compared to the US average. This post is not getting into the analysis controls used to guarantee the integrity of the data.
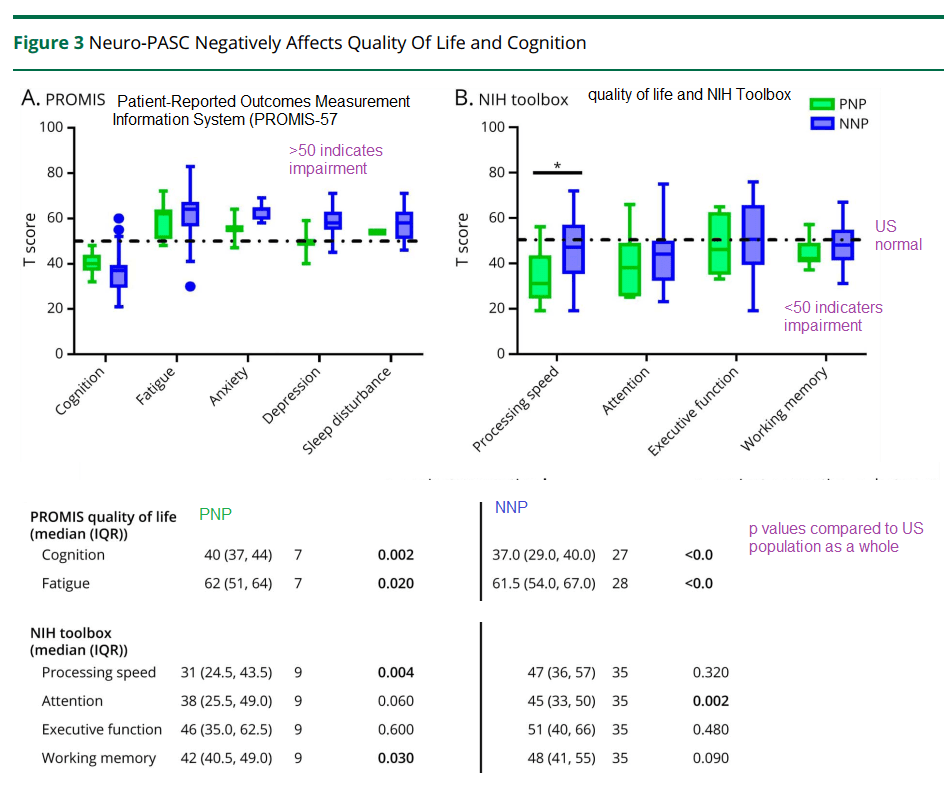
Hanson and coworkers also performed some regression analysis of depression and anxiety symptoms as a function of the ratio of GFAP to neurofilament…
- When stratified by age, those patients with depression/anxiety were more likely to have a high GFAP/neurofilament ratio. This was true for both those over 50 years old and those less than 50 years old. (p<0.05)
- A positive correlation was seen in the Promis T score for anxiety as a function of the GFAP/neurofilament immuno reactivity in the plasma. (p=0.03) R2 was only 0.041.
- There was no correlation between the Promis T score for depression and the plasma immuno reactivity GFAP/neurofilament ratio.
The amazing thing in this study is how many patients are compromised three weeks after the initial onset of Covid-19 symptoms. The hints of astrocyte dysfunction are in keeping with the Goetzl findings described in another post.
A yet to be peer reviewed study from Brazil:
A Brazilian group has demonstrated the presentation of the SARS-Cov2 virus in astrocytes in the brains of deceased Covid-19 patients. They further demonstrated the ability of SARS-Cov2 to infect astrocytes using NRP1 as an alternative receptor to ACE2. [1] The Brazilians produced astrocytes from neuronal stem cells, infected them with SARS-CoV2, and used mass spectrometry to measure the levels of key neurotransmitters,
Figure 7 Sea Horse and related metabolic data

High resolution mass spectrometry was used to compute the violin plots shown of the end product of terminal glycolysis, lactate, and the intermediate before entry into the TCA cycle, pyruvate. TCA cycle intermediates were not different between mock and CoV2 infected astrocytes. (Figure 10 supp, not shown)

Cellular respiration of mock and CoV2 infected astrocytes was measured in a Sea Horse respirometer. Basal respiration, ATP production, and the reserve capacity were not significantly different in the infected astrocytes compared to the mock infected astrocytes. The proton leak, maximum respiration, and non-mitochondrial oxygen consumption were, however, greater in the CoV2 infected astrocytes. We’ve discussed Covid proteins binding to Complex I proteins in a previous post. Complex I might be the source of non (normal) mitochondrial oxygen consumption the Brazilians referred to.
In summary..
These data support astrocyte involvement in Long Coivd/ PASC. How do we address this in a clinical trial? Do monocytes and CD8+ cytotoxic T cells migrate into the brain?
References
- Hanson, B. A., Visvabharathy, L., Ali, S. T., Kang, A. K., Patel, T. R., Clark, J. R., Lim, P. H., Orban, Z. S., Hwang, S. S., Mattoon, D., Batra, A., Liotta, E. M., & Koralnik, I. J. (2022). Plasma Biomarkers of Neuropathogenesis in Hospitalized Patients With COVID-19 and Those With Postacute Sequelae of SARS-CoV-2 Infection. Neurology(R) neuroimmunology & neuroinflammation, 9(3), e1151. PMC free article
- https://www.medrxiv.org/content/10.1101/2020.10.09.20207464v5
-
PD-1 and Tim-3
This post was initiated as an effort to better understand a previous post showing association of CD8 cytotoxic T cell surface proteins PD-1 and Tim-3 with Long Covid. A 2010 study documented coregulation of CD8 T cell exhaustion by Tim-3 and PD-1 during chronic lymphocytic choriomeningitis virus infection (LCM) [1] Could Long Coivd be a chronic infection enabled by exhausted T cells? PD-1/Tim-3 play a role in T cell exhaustion in cancer. A study has used H2 gas to bolster the mitochondria in human cancer patients. [2] Cuprous niacin could have an even greater potential as an immunomodulator for more than just Long Covid! For now, Long Covid is where the FDA interest seems to be. This study [1] tells us that anti viral CD8+ T cell surface receptors PD-1 and Tim-3 are something we should include in the clinical trial. Ref [2] that PD-1 has a strong mitochondrial and NAD+ connection. PD-1
During chronic viral infections such as HIV, hepatitis B virus, and hepatitis C virus
(HCV) , CD8 T cells become “exhausted†as characterized by [1]- Inability to produce cytokines
- Inability to lyse virus infected cells
- Inability to proliferate
Materials and Methods [1]
- Six-week-old female C57BL/6 mice were were intraperitoneally
infected with 2 × 10⁵ pfu of LCMV - Lymphocytes were isolated from tissue including spleen, liver, lung, and blood as previously described.
- To detect degranulation, splenocytes were stimulated with individual LCMV peptides or a pool of eight LCMV epitopes for 5 h in the presence of brefeldin, monensin, anti–CD107a-FITC, and anti–CD107b-FITC. Cells were then analyzed on by flow cytometry to determine surface markers.
- CD8 T cells were purified to more than 90% purity using magnetic beads.
- Tim3+PD1+ and Tim3-PD1+ CD8 T and cocultured with splenocytes from Thy1.1+ C57BL/6 mice in the presence of LCMV peptides for 3 d. Proliferation was measured suing flow cytometry.
- For blockade of PD-1 pathway, 200 μg of rat antimouse PD-L1 antibody were administered intraperitoneally every 3 d for 2 wk.
- For blockade of Tim-3 pathway, 100 μg of Tim-3-Ig fusion protein were injected intraperitoneally every 2 d for 2 wk.
- Titers of virus from serum or homogenized tissue sample were determined by plaque assay on Vero cells.
Fig 1 Intro to flow cytometry and acute vs chronic viral infections
Figure 1 Panels B and D showed flow cytometry quadrant plots for all data points. [1] The antibodies that recognize the surface markers are conjugated with different colored fluorescent tags. Cells that are negative for both surface marker are in the lower left quadrant. Those that are positive for both, in this case GP33 and Tim3 appear in the upper right quadrant. Panel 1A is a series of histogram plots. The X-axis is bins of signal intensity for the CD33 antibody. The Y-axis is the counts, or number of cells with a given signal intensity. GP33 appears to be a LCMV peptide. These T cells in acute and/or chronic infections should recognize peptides from the surface of LCMV.
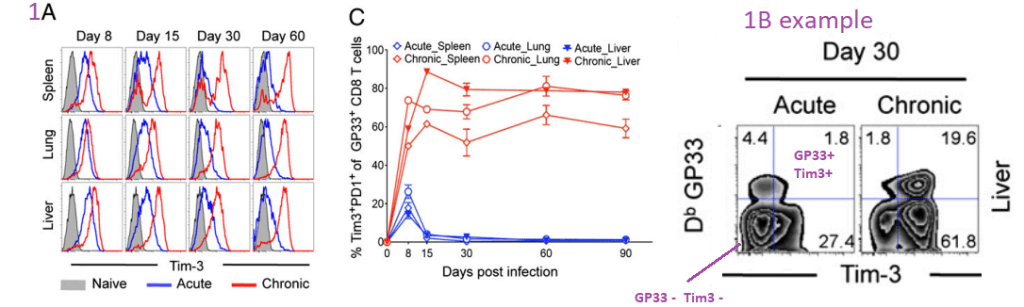
Of all of the T tells that have receptors that bind to GP33, the majority also express Tim3 and PD1 receptors in chronic, but not acute infections.
Fig. 2 Co-expression of Tim-3 and PD-1 correlates with …
more severe exhaustion of LCMV-specific CD8 T cells during chronic infection. Functions of
Tim3+PD1+ or Tim3-PD1+ CD8 T cells were analyzed using splenocytes at day 50 after infection. [1](A) This post is omitting panel on that demonstrates the isolation protocol.
(B) Frequency of GP33- or GP276-specific CD8 T cells producing cytokine after
stimulation for 5 h with GP33-41 or GP276-286 peptides.  These cytokines seem to be in secretory granules or something. Their synthesis and/or secretion is dependent on binding of peptides from the LCMV to the T cell receptors. These panels examine the ratio of cells expressing producing cytokines to those T cells with receptors receptors that recognize LCMV peptides. Having Tim3 and PD1 on the cell surface tends to correlate with low inflammatory cytokine(C) Frequency of Tim3+PD1+, Tim3-PD1+, or Tim3-PD1- CD8 T cells producing IL-10 was analyzed after stimulation for 5 h with the LCMV peptide. Data are representative of three independent experiments. Error bars represent SEM. LCMV pool consists of GP33-41, GP276-2. Note the lavender arrow that emphasizes the Tim3 negative status of the empty circles. These T cells do not produce the inhibitory cytokine IL10.
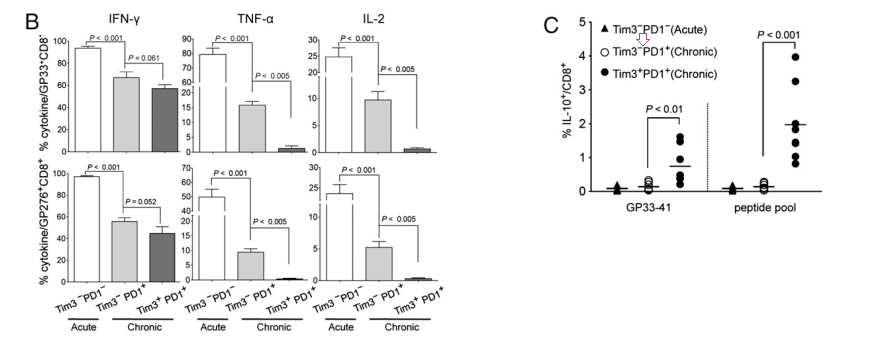
Fig. 3. In vivo blockade of Tim-3 and PD-1 pathways…
enhances virus-specific CD8 T-cell responses during chronic viral infection. [1]
Chronically infected C57BL/6 mice (80 d after infection) were treated every third day or every eeks other day for 2 wk with αPDL1 or Tim3Ig, respectively. Frequency of GP33-specific CD8 T cells before and after treatment of individual mouse is shown in the blood. Total number of GP33-specific CD8 T cells in the indicated
tissues at 2 wk after treatment. Data are representative of three independent experiments with five to six mice per group in each experiment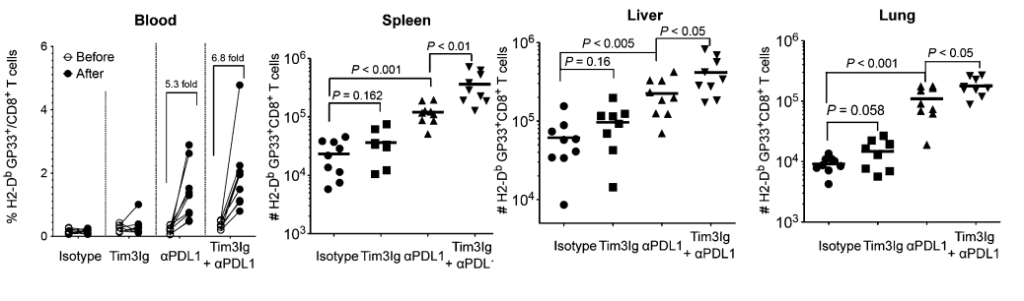
In the three tissues but not the blood, just knocking down PDL1 increases the proportion of all CD8+ cytotoxic T cells that express the GP33+ receptors that recognize the LCMV peptides.
Fig. 4. Dual blockade of Tim-3 and PD-1 pathways…
enhances function in exhausted virus-specific CD8 T cells. [1]
(A) IFN-γ production and degranulation by CD8 T cells in treated mice at 2 wk after therapy. The percentage of IFN-γ+CD107+ CD8 T cells specific for each of the LCMV peptides are summarized.
(B) Polyfunctional (TNF-α+IFN-γ+) CD8 T cells in treated mice at 2 wk after therapy.
(C) The proliferation of antigen specific CD8 T cell after dual blockade is shown as the percentage of Ki67+ on LCMV GP33-specific CD8 T cells. Data are representative of three independent experiments with five to six mice per group in each experiment.
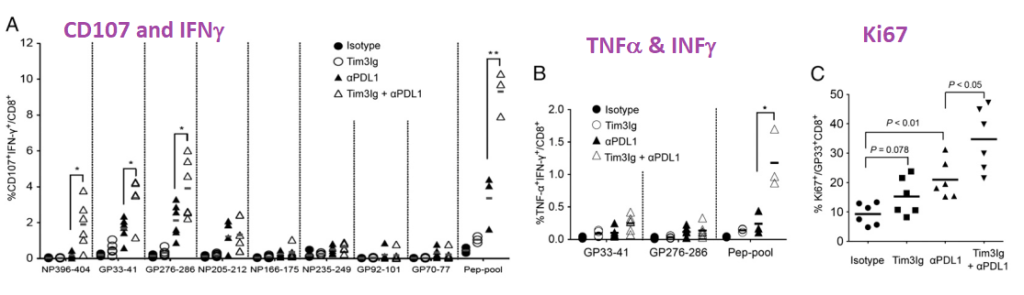
*P < 0.05; **P < 0.01 While it takes the peptide pool to really get the T cells to crank out TNFα and INFγ, just peptides restricted to smaller regions of LCMV are effective in increasing T cell proliferation as measured by Ki67.
Fig. 5. Dual blockade of Tim-3 and PD-1 pathways…
enhances viral control. [1]
Viral titer was determined by plaque assay in the blood before and after treatment. Viral load in spleen, liver, and lung at 2 wk after treatment is shown. Data are representative of three independent experiments with five to six mice per group in each experiment. Error bars represent standard error of the means.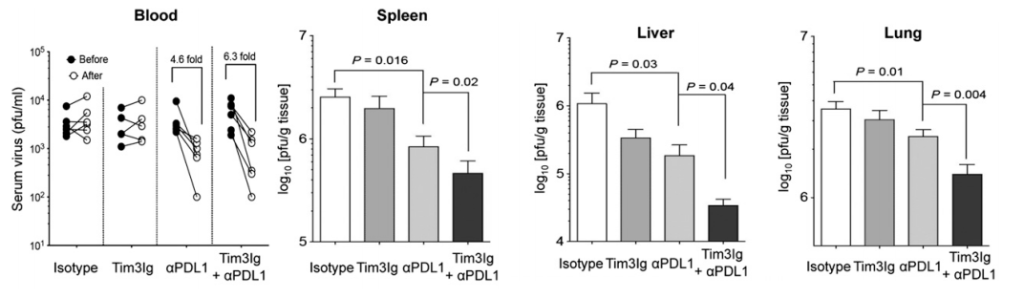
Never mind the decreased proliferation and cytokine production by exhausted CD8+ T cells, inhibiting PD-1 and Tim-3 reduces the LCMV viral load in this mouse study. What if Long Covid really is a chronic infection that escapes the immune system? This site has covered the role of copper deficiency in T cell exhaustion. What if bolstering the mitochondria can prevent PD-1 from being expressed in the first place?
It should also be noted that the PD1/PD-L1/Tim3 system plays a role in cancer and tuberculosis infections as well as transplanted organ tolerance and autoimmunity. [2] The Wolf review did not mention chronic Lyme Disease infections. These authors did go into the many ligands of Tim3 and the possible benefits of Tim3 ligand binding blockage.
And on to the mitochondria [3]
This story [1] is all very interesting, but what is the connection to the mitochondria? This question was addressed by a human study of cancer patients with colorectal carcinoma on the PD1 antibody chemotherapy agent Nivolumab. [2] Specifically, these patients had issues with CD8+ T cells that also expressed PD-1 and Tim3. [3] Akagi and Baba covered many important points as to why they thought there was mitochondrial dysfunction and that the patients would benefit form H2 gas therapy.
- Nivolumab cure rate of 20‑30% and needs a biomarker to distinguish responders from non-responders. ,
- These T cell dysfunctions of exhausted T cells are inversely correlated with decreased
mitochondrial function (3), - which is caused by progressive loss of peroxisome proliferator‑activated receptor‑γ coactivator 1α (PGC1α), a regulator of mitochondrial replication that is controlled by a variety of signaling pathways
- (Akt, p38‑MARK, AMPK, SIRT1, PRMT1… Note that AMPK and SIRT1 pathways are connected with NAD+, ADP/ATP, and overall mitochondrial function.
- The authors reported that the proportion of PD‑1+terminal CD8+ T cells containing PDT+ and PDT‑ (exhausted CD8+T cells) in the peripheral blood of colorectal cancer patients was reduced by hydrogen gas, an activator of PGC1‑α,
- They used serum coenzyme Q as a marker of mitochondrial function. CoQ10 was in the serum was highly associated with patient prognosis. [2]
Note the role of both NAD+ and ATP. Not in this diagram is CoQ10 between comploexes II and IIi. The bottom line is no Cu, no NAD+. The authors found that some patients responded to hydrogen gas and that others did not. The PD1/Tim3 + T cells (PDT+) decreased with the H2 therapy. PDT+ was inversely correlated with serum CoQ10. The authors claimed no appropriate method to easily measure mitochondrial function. They argued that CoQ10 is part of the electron transport chain. If so, what is it doing in the serum? The Seahorse respirometer is a not so easy way to measure cellular respiration as is cellular ATP content. Akagi and Baba discussed NAD+ pathways and gene transcription. They also discussed the putative role of H2 in turning components of NAD+ and ADP/ATP ration gene transcription. So H2 has some benefit. It does not address the possibility that the antiviral cytotoxic T cell does not have enough nutrients to do its duty so it is expressing PD-1 so that it may be turned off.
Aging
Onorati 2022 introduced the concept that the senescent associated secretory phenotype (SASP) upregulates PD-L1 expression.

The Tchkonia review [4] discussed signaling pathways like p53/p21..
Triggers may include DNA damage, reactive oxygen species, and protein aggregation. They introduced an interesting concept of “sterile inflammation” as opposed to inflammation that results from a pathogen infection.
The role of copper deficiency and mitochondria dysfunction was not discussed, but we think this may be relevant in aging. . The role of Cu/Zn superoxide dismutase was also not discussed in terms of reactive oxygen species.
- PD-L1 was increased in human diploid lung fibroblasts induced to undergo senescence.
- This induction requires the SASP
- The SASP “fires” through second messenger protein kinases called JAK-STAT
- mTOR, the nutrient sensing master regulator, is involved.
- PD-L1 is upregulated in interstitial lung disease.
References
- Jin, H. T., Anderson, A. C., Tan, W. G., West, E. E., Ha, S. J., Araki, K., Freeman, G. J., Kuchroo, V. K., & Ahmed, R. (2010). Cooperation of Tim-3 and PD-1 in CD8 T-cell exhaustion during chronic viral infection. Proceedings of the National Academy of Sciences of the United States of America, 107(33), 14733–14738. PMC free article
- Wolf Y, Anderson AC, Kuchroo VK. TIM3 comes of age as an inhibitory receptor. Nat Rev Immunol. 2020 Mar;20(3):173-185. PMC free article
- Akagi J, Baba H. Hydrogen gas activates coenzyme Q10 to restore exhausted CD8+ T cells, especially PD-1+Tim3+terminal CD8+ T cells, leading to better nivolumab outcomes in patients with lung cancer. Oncol Lett. 2020 Nov;20(5):258 PMC free article
- Onorati A, Havas AP, Lin B, Rajagopal J, Sen P, Adams PD, Dou Z. Upregulation of PD-L1 in Senescence and Aging. Mol Cell Biol. 2022 Oct 20;42(10):e0017122. PMC free article
- Tchkonia T, Zhu Y, van Deursen J, Campisi J, Kirkland JL. Cellular senescence and the senescent secretory phenotype: therapeutic opportunities. J Clin Invest. 2013 Mar;123(3):966-72. PMC free article
-
Long Covid Immune Dysfunction
Phetsouphanh C, Darley DR, Wilson DB, Howe A, Munier CML, Patel SK, Juno JA, Burrell LM, Kent SJ, Dore GJ, Kelleher AD, Matthews GV. Immunological dysfunction persists for 8 months following initial mild-to-moderate SARS-CoV-2 infection. Nat Immunol. 2022 Feb;23(2):210-216. free article
The previous post featured big data that really got out of hand became unrealistic for a small company to replicate in a clinical trial. Phetsouphanh et al from Feb 2022 really hit an realistic mark. This post features small data that we can use in a clinical trial.
The study population
This is what their population looked like. Long Covid patients are those who experienced symptoms four months after the active infection. UHC are unexpected healthy being those that were exposed but never got sick. The matched controls are patients who developed symptomatic Covid infections but were asymptomatic four months after the active infection.
Characteristics Long Covid (LC) Matched control (MC) human coronovirus UHCs (St Vincent’s) UHCs (University of Melbourne) Number of samples 31 31 25 16 30 Age (y), mean ± s.d. 49.6 ± 14.9 48.9 ± 12.8 47.4 ± 16.9 37.13 ± 10.02 48.13 ± 11.89 Male, n (%) 15 (48) 15 (48) 14 (54) 8 (50) 15 (50) Median days after positive SARS-CoV-2 PCR (IQR) 128 (115–142) 120 (115–142) N/A N/A N/A White, n (% total) 28 (90) 26 (84) 12 (75) N/A Severity, n (% total)  Hospitalized 8 (26) 2/31 (6)  Community 23 (74) 29/31 (94) N/A N/A N/A Comorbidities, n (% total) 12 (39) 12 (39) N/A N/A N/A Transmission (acquired overseas), n (%) 13 (42) 15/31(48) N/A N/A N/A Phenotyping (n) 14 14 N/A 7 – HCoV positive (n) – – 26 – – HKU-1 1 229E 14 NL63 14 OC43 10 ACE2 assay (n) 26 – 30 Month 3 26 29 – – Month 5 25 24 – – Month 8 27 29 – – Age, gender, ethnicity and comorbidities within the cohorts sampled. Patients infected with HCoV who were PCR positive for 229E were also positive for NL63. N/A not applicable. 1. Interferon β is the cytokine to watch
An immediate surprise is that the IL-8 profiles in UHC that were different from the matched controls.

two-tailed P values <0.05 (*), <0.01 (**), <0.001 (***) and<0.0001 (****) Interferon beta balances the expression of pro- and anti-inflammatory agents in the brain. ??? This one could be interesting in light of neurological symptoms in Long Covid. Interferon lambda are anti-viral and first line of defense of epithelial cells.
CXCL9 promotes leukocyte differentiation and chemotaxis. CXCL10 is a chemotaxis factor for dendritic cells and macrophage. IL-8 us a neutrophil chemotaxic factor. sTIM-3 soluble T cell immunoglobulin mucin domain 3. The interferons were elevated in the Long Covid patients at 8 months compared to the matched controls.
1b there’s something LC about the interferons
Note the bars connecting the LC 8M and MC 8M showing that they are different at the p<0.01 or p<0.05 level of significance. We don’t see these differences for the other cytokines.
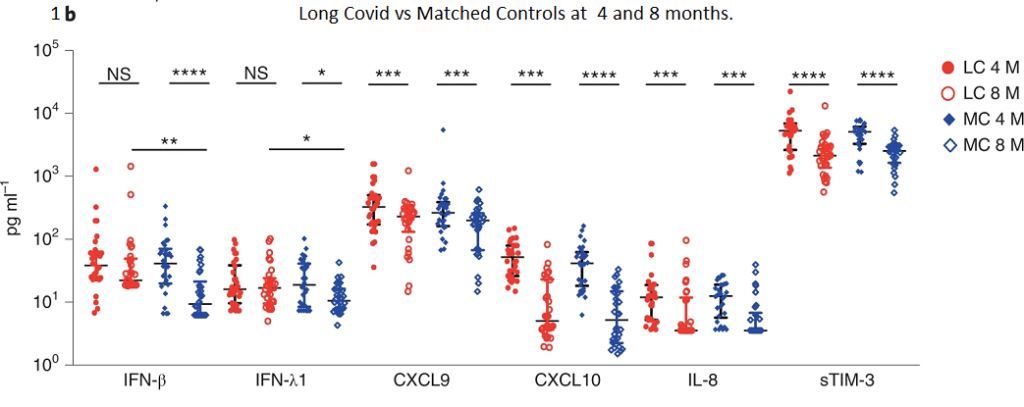
two-tailed P values <0.05 (*), <0.01 (**), <0.001 (***) and<0.0001 (****) Soluble ACE2 enzyme activity was also measured but will not be reported in this post.
2. What features define Long Covid?
Because of the modest small sample size of 58 participants at month 8,
the authors performed a technique called “bootstrapping” to randomly sample new samples from the population of 58 with replacement. The sampled population was then
split 29:29 into test and train datasets. This seems to be some sort of machine learning thing we should consider learning. It seems to be a powerful way of sorting through big data diarrhea.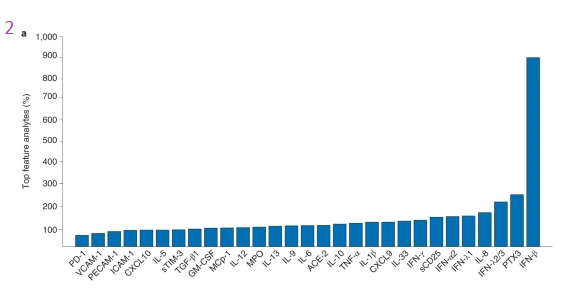
IFN-β again comes out on top. When it comes to defining Long Covid, less (four features) is more (29 features).
Number of features Best features Accuracy Confidence interval F1 score Confidence interval 2 IFN-β, PTX3 0.7854 ±0.0019 0.7736 ±0.0025 3 IFN-β, PTX3, IFN-λ 0.7968 ±0.0019 0.7852 ±0.0024 4 IFN-β, PTX3, IFN-λ2/3, IL-6 0.8159 ±0.0017 0.8053 ±0.0021 29 All 0.7740 ±0.0018 0.7588 ±0.0084 Table 2 Petsouphanh 2022. The next step was to ask how well do the other features predict the amount of the top feature IFN-β?
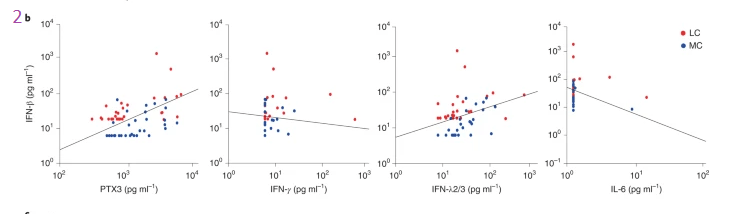
Two-dimensional scatterplot separating LC (red dots) and MCs (blue dots) with a decision boundary (straight light) based on the concentrations of IFN-β and PTX3, IFN-β versus IFN-ð›¾, IFN-β versus IFN-λ2/3 and IFN-β versus IL-6. Data points found above the decision boundary have a strong association with LC. These lines look like regression lines, but evidentially are not. It is interesting that IL-6 and INFγ are inversely related to the top Long Covid cytokine IFN-β. PTX3 and IFN-λ2/3 are directly related to IFN-β. This brings us back to comparing the four and eight month time frames. While all the cytokines go down in this period, only one remains elevated eight months post infection.
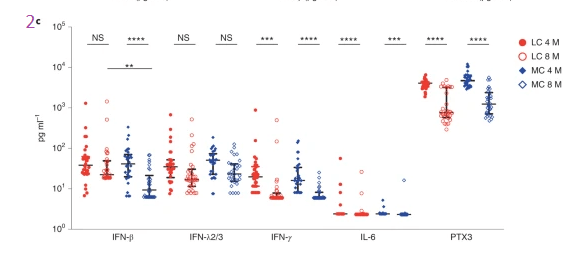
Representation of the longitudinal levels of the five key cytokines. Data are shown as medians with error bars representing interquartile ranges (IQRs). Two-tailed P values <0.01 (**), <0.001 (***) and<0.0001 (****) were considered significant. A Wilcoxon t test was used for paired samples, and a Mann–Whitney t test was used for unpaired samples. 3 from cytokines to T cell surface proteins
These are the “clusters” of surface proteins on immune cells as defined by the figure legend for 3b.
- CD127lowGzmB-CCR7+CD45RA+CD27+ naive CD8+ T cells
- CD57+ highly cytotoxic (GPR56 + GzmB+) CD8+ T cells
- CD127lowTIM-3-CCR7+CD45RA+CD27+ naive CD4+ T cells
- CD3+CD4-CD8- innate-like T cells (may comprise natural killer T cells and γδ-T cells) and
- naïve CD127 low TIM-3-CD38 lowCD27-IgD+ B cells
The color codes were not defined in the publication. Each of these cell surface markers is recognized by an antibody with a fluorescent tag.
at 3 months
Note that there are no representatives of any of these five populations at three months in the Long Covid population compared to the matched controls who got symptomatic Covid but were well at four months. Long Covid and Matched Control bars are the same at three months, before LC officially sets in, or something?
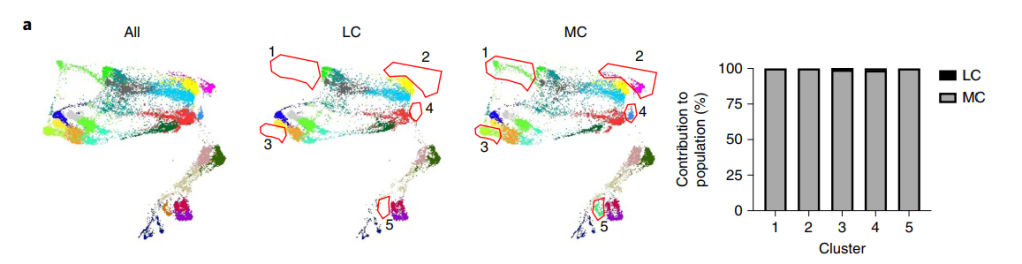
a, Dimensional reduction utilizing
TriMap and clustering with phenograph was used to visualize immune cell phenotypes. Five populations consisting of unactivated naive and cytotoxic
phenotypes were absent in the LC group when compared to MCs at 3 months (n = 14, seven samples per group). Absent populations are outlined in red
(middle and right panel), with median percentages of the LC and MC contribution to each cluster population shown in the bar graph.at 8 months
By eight months clusters 2 and 4 are returning in the Long Covid patients.
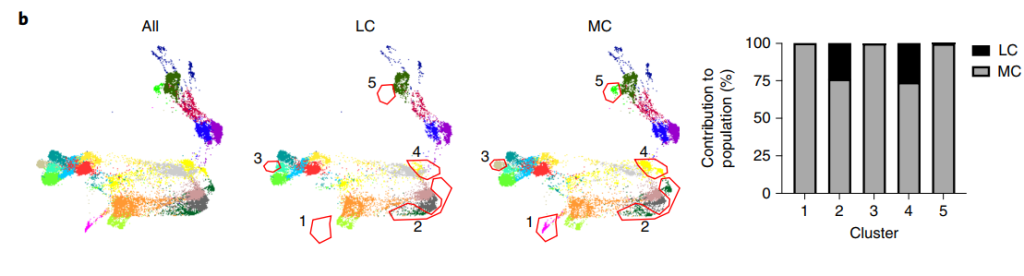
Unactivated naive T and B cell populations with low expression of CD127 and no TIM-3 expression remained absent in peripheral blood at 8 months in the LC group (clusters1, 3 and 5). Sorting out cell sub types
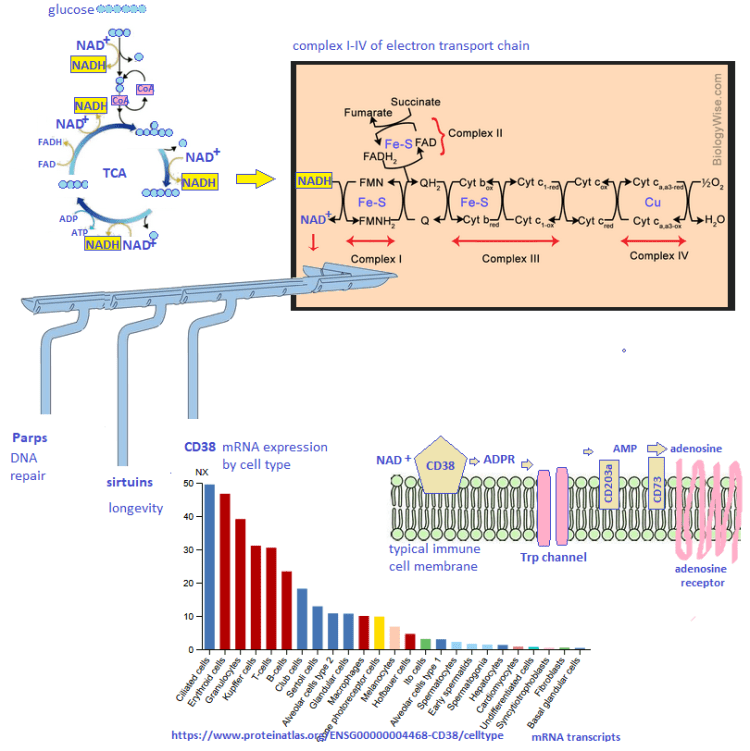
CD38+ non lymphoid cells, monocytes, and peripheral dendritic cells are all elevated at 3 and 8 months post infection. The scholars on Wikipedia have posted some excellent information on CD38.
- As a receptor, CD38 can attach to CD31 on the surface of T cells, thereby activating those cells to produce a variety of cytokines. CD38 in some circles, perhaps the authors of this publication are one.
- CD38 “catalyzes the synthesis of ADP ribose (ADPR) (97%) and cyclic ADP-ribose (cADPR) (3%) from NAD+. CD38 is thought to be a major regulator of NAD+ levels, its NADase activity is much higher than its function as an ADP-rybosyl-cyclase: for every 100 molecules of NAD+ converted to ADP ribose it generates one molecule of cADPR. When nicotinic acid is present under acidic conditions, CD38 can hydrolyze nicotinamide adenine dinucleotide phosphate (NADP+) to NAADP.” The peer reviewed references on this Wikipedia post will be explore in greater detail as this is how Cu(I)NA2 must be working.
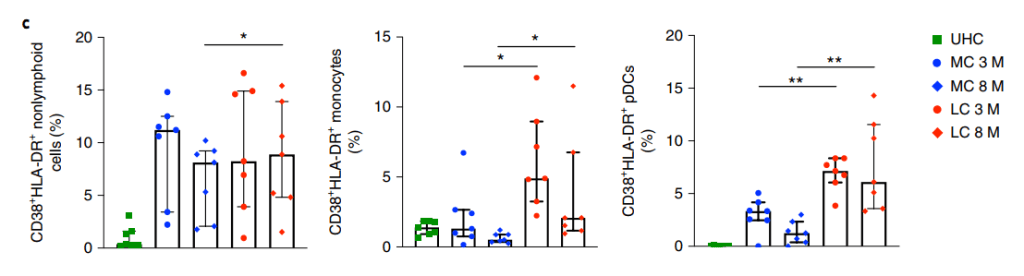
Activated nonlymphoid (myeloid) cells with combined expression of CD38 and HLA-DR in the LC and MC groups at 3 months; levels were not significantly reduced at 8 months in the LC group. elevated levels of activated monocytes and pDCs were found in the LC group when compared to MCs at 3 and 8 months. CD4 is a glyco protein on the surface of T helper cells. It is a co-receptor for the T cell receptor that recognizes antigens in the MHC II complex of antigen presenting cells. There is no Long Covid action associated with this receptor. CD8 is like CD4 only it interacts with viral or cancer cell antigens in the MHC class I complex. MHC I is present in most nucleated cells. Presentation of antigens marks them for death by activating CD8+ cytotoxic T cells. MHC II is produced by professional antigen presenting cells, which may sometimes be lymphocytes. The CD4+ cells don’t matter in Long Covid. It is the CD8+ cells that matter.
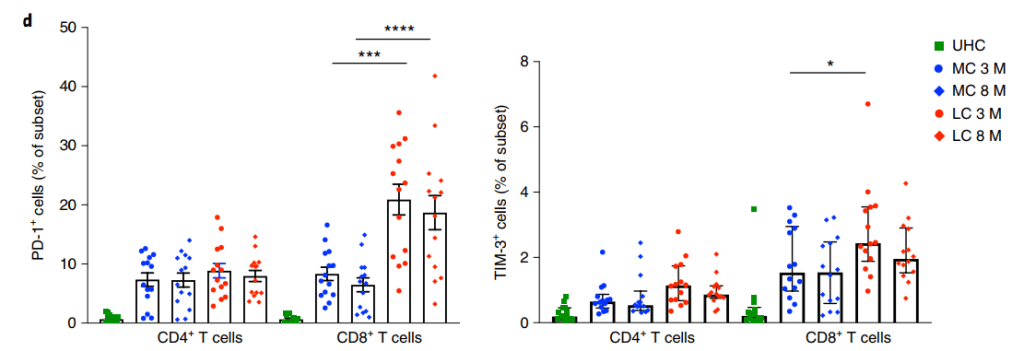
No difference in PD-1 levels was found on
CD4+ T cells, but higher expression by CD8+ T cells was found in the LC group at both time points. Higher TIM-3 expression on CD8+ T cells was observed
in the LC group at 3 months. Data are shown as median with IQR. Two-tailed P values <0.05 (*), <0.01 (**), <0.001 (***) and <0.0001 (****) were considered significant. A Wilcoxon t test was used for paired samples, and a Mann–Whitney t test was used for unpaired samplesTim-3, aka HAVCR2, is a binding partner of galectin. It may be present on the same T cell as the PD-1 programmed cell death receptor.
This is in keeping with a mouse model of a chronic CMV infection study” In this study, we found that, although Tim-3 was transiently expressed by CD8 T cells after acute LCMV infection, it was rapidly down-regulated, whereas CD8 T cells retained high Tim-3 expression throughout chronic LCMV infection. Moreover, Tim-3 was mainly coexpressed with PD-1 on virus-specific CD8 T cells during chronic infections. Importantly, this subset of CD8 T cells coexpressing Tim-3 and PD-1 (Tim3+PD1+) showed the phenotypic and functional characteristics of more severely exhausted CD8 T cells than did those expressing only PD-1 (Tim3−PD1+). Finally, simultaneous in vivo blockade of Tim-3 and PD-1 pathways had synergistic effects in restoring antiviral immunity and viral control compared with blockade of either pathway alone. Collectively, these results indicate that Tim-3 and PD-1 pathways may cooperate and independently contribute to negatively regulate CD8 T cell responses during chronic viral infections. ” Jin et al 2010
Where to go next...
Things are starting to come into focus as to where we can go in this study. Here are some areas for more reading.
- INFβ is important in the nervous system. Could this cytokine explain some of the nervous system symptoms of Long Covid? Lot’s on PubMed to followup on
- CD38 in non lymphoid cells may or may not fit the Cu+ half of Cu(I)NA2, but it fits the niacin and NAD+ aspect of things.
- This research has backed up previous reports that PD-1 and CD8+ cytotoxicT cell exhaustion is important. We know from previous studies that Cu is important in preventing this. Even more exciting, PD-1/Tim-2 have been associated with T cell exhaustion with chronic viral infections.
-
Covid and serum copper
Here is the latest on the subject:
- A Russian group found that increases in serum copper as well as Cu/Zn serum ratios correlated with covid-19 severity [1]
- A Chinese group looked at urinary trace element Levels in 210 urine specimens from the 138 severe and non-severe patients with COVID-19. [2] The reference range for Cu is [4.00–21.42] μg/L. Urine Cu was 15.84 (10.48–20.68) in mid Covid cases and 32.14 (17.22–75.43) in severe Covid cases. Urine Cu was significantly elevated in severe Covid (p <0.001). [2] When the trace elements in the urine were adjusted for creatinine, even more copper was being lost in the urine in severe Covid-19 cases. Accounting for glomerular filtration, Cu amounts were reported relative to creatinine. [2] The reference range is [4.39–13.37] μg/g creatinine. Average Cu (and range) in mid versus severe Covid were 15.55 (12.41–20.45) and 77.71 (32.04–248.28) μg/g creatine, respectively. (p < 0.001). Urinary creatinine-adjusted copper of ≥25.57 μg/g and ≥99.32 μg/g were associated with significantly increased risk of severe illness and fatal outcome in COVID-19, respectively.
- A German group found that serum copper was higher in patients who were released from the hospital versus those that died. [3] No change was seen in ceruloplasmin. A caveat is that the ceruloplasmin activity was not measured.
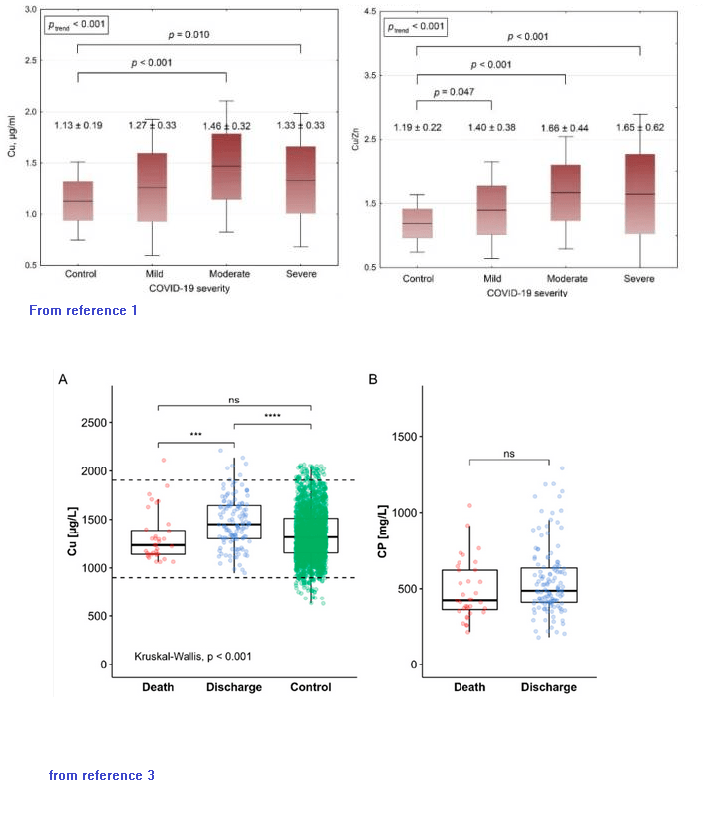
The German [3] and Russian [1] groups reported different control ranges for serum copper. The Chinese report suggests that large amounts of copper may be lost in the urine in severe Covid. [2] Could copper loading of ceruloplasmin be compromised in severe Covid?
References
- Skalny, A. V., Timashev, P. S., Aschner, M., Aaseth, J., Chernova, L. N., Belyaev, V. E., Grabeklis, A. R., Notova, S. V., Lobinski, R., Tsatsakis, A., Svistunov, A. A., Fomin, V. V., Tinkov, A. A., & Glybochko, P. V. (2021). Serum Zinc, Copper, and Other Biometals Are Associated with COVID-19 Severity Markers. Metabolites, 11(4), 244. PMC free article
- Zeng, H. L., Zhang, B., Wang, X., Yang, Q., & Cheng, L. (2021). Urinary trace elements in association with disease severity and outcome in patients with COVID-19. Environmental research, 194, 110670. PMC free article
- Hackler J, Heller RA, Sun Q, Schwarzer M, Diegmann J, Bachmann M, Moghaddam A, Schomburg L. Relation of Serum Copper Status to Survival in COVID-19. Nutrients. 2021 May 31;13(6):1898. free article