This post is a continuation of a previous post covering a hot paper saying that Cu binding to DLAD, a pyruvate dehydrogenase complex enzyme, causes a regulated form of cell death. The Chinese are very interested in exploiting this “regulated cell death” to treat renal cancers. They explored U.S.renal cancer databases to determine if these cuproptosis proteins correlate with renal cancer prognosis. They found that these cuproptosis proteins are associated with favorable prognoses. Each time a protein is mentioned that has something to do with Cu(II), pyruvate, or lipoic acid, a ⶠwill appear in the text.
Renal cancer databases mined
- The first study came out of Zhejiang University in China. These authors were interested in clear cell renal cell carcinoma. [1] They mined a U.S. database (https://portal.gdc.cancer.gov//, accessed on 15 March 2022). A total of 524 ccRCC patients and 72 adjunct non tumor samples.
- The second study came from Changzhi, China. These investigators mined these databases: GEO (GSE12606, GSE53000, and GSE53757) and the TCGA-KIRC dataset. Among them, the GSE12606 dataset contains 3 cancer samples and 3 paired normal samples, the GSE53000 dataset contains 53 cancer samples and 6 normal samples, the GSE53757 dataset contains 72 cancer samples and 72 paired normal samples.
1. A Novel Apoptosis-Related Prognostic Gene Signature and Validation of Differential Expression in Clear Cell Renal Cell Carcinoma
Here we go with the 1st Chinese renal cancer data mining study.
Fig 1 RCC vs normal cuproposis gene expression
This bullet list was copied from the text. It goes along with Panel A of Figure 1. Log2 fold changes were converted to simple fold changes at this site. Log2 =0 is a 1x, or no change. The converted values are in orange. Only CDKN2A transcript, which codes two proteins, went up. The other TCA cycle related transcripts went down.
- CDKN2A (log2(fold change) = 2.12, p = 1.50 × 10−155) 4.3x
- â¶DLAT (log2(fold change) = −0.73, p = 5.12 × 10⁻²⁶) 0.503x
- DLD (log2 (fold change) = −0.97, p = 5.99 × 10−47), 0.51x
- FDX1 (log2 (fold change) = −1.07, p = 9.21 × 10−54), 0.476
- GLS (log2 (fold change) = −0.94, p = 2.85 × 10⁻²²), 0.521
- PDHA1(log2 (fold change) = −1.14, p = 7.17 × 10⁻³²) 0.454
- PDHB(log2 (fold change) = −1.12, p = 2.59 × 10−46) 0.460
The emerging story is that it is bad to to lose some of these pyruvate metabolism related gene transcripts.
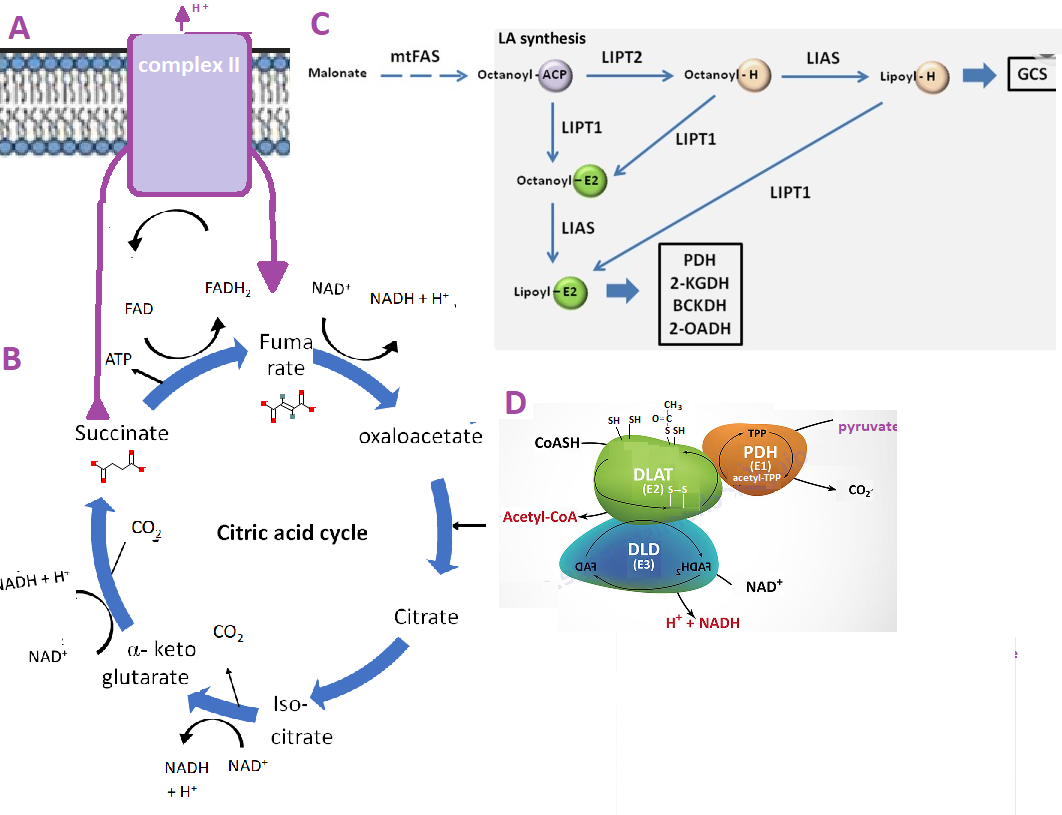
Bian 2022 Figure 2 is not being presented in this post. The biological processes of the 10 CRGs mainly involved in the GO analysis and KEGG analysis were related to aerobic production of ATP. This included Fe-S centers of the mitochondria to lipoic acid related genes.[1]
Figure 3 Survival curves
Bian and coworkers used a lot of fancy techniques to examine survival with renal cell carcinoma with over the course of months. They also looked at progression free survival. Patients who had high expression of these cuproptosis gene transcripts survived longer. For lay readers, each time there is a step down going from left to right, someone(s) dies.

These cuproptosis genes are associated with regulated cell death, yet these patients are living longer when they produce transcripts that code for pathways leading to the TCA cycle. Would lipoic acid be good to add with cuprous nicotinic acid or cuprous pyruvate?
Bian Figure 4 examined the multivariate analysis factors involved in overall survival and progression free survival. CDKN2A, FDX1, â¶DLAT, age, and gender were important predictors of the former while CDKN2A, FDX1, â¶LIAS, age, and gender were important predictors of the latter. [1]
Fig. 5 Two different datasets, the same answer
Blue is normal red is the tumor. Recall that â¶DLAT is Pyruvate dehydrogenase (acetyl-transferring)] kinase isozyme 3. This is the same enzyme that might be aggregated by the Cu when it is reduced by mitochondrial ferriredoxin FDX1. See previous post . Note that these “death” proteins are associated with health.

Bian Figure 6 explored whether the cancer related genes correlated with immune cell recruitment to the tumor. It is uncertain whether CRGs would influence immune cell recruitment in the tumorCDKN2A, DLAT, FDX1 and LIAS were the gene transcripts examined.
| CDKN2A | â¶DLAT | FDX1 | â¶LIAS | |
| CD8+ T cell | ↑ p = 2.89 × 10⁻² | |||
| Macrophage | ↓ p = 2.89 × 10⁻² | ↑ p = 2.93 × 10⁻¹³ | ↑1.73 × 10⁻² | ↑ p = 1.12 × 10⁻⁵ |
| neutrophil | ↑ p = 1.89 × 10⁻⁶ | ↑ p = 1.15 × 10⁻³ | ||
| B cell | ↑p=1.40 × 10⁻⁶ | ↑ p = 2.33 × 10⁻³ | ||
| Dendritic cells | ↑ p = 1.02 × 10⁻⁴ |
What we really do not now is what sorts of small molecules are in the tumor micro environment that might be recruiting immune cells and/or inactivating them. A general hunch is that reliance on the TCA cycle and an active electron transport chain is crucial to prevent generation of lactic acid that will do things to immune cells that is beyond the scope of this post to discuss.
Fig 8 Less expression means more disease

CCRC, clear cell renal carcinoma. This post will not examine the difference between pathologic stage and the histological grade. CDKN2A is a protein involved in cell cycle regulation that seems less important than ⶠDLD, DLAT, and LIAS that are involved in getting pyruvate into the TCA cycle.
2. Molecular Subtyping Based on Cuproptosis-Related Genes and Characterization of Tumor Micro environment Infiltration in Kidney Renal Clear Cell Carcinoma
Ji and coworkers started their clear cell renal carcinoma (CCRC) database mining with the 12 cuproptosis proteins â¶. They did their comparison with adjacent normal tissue. 1C is kind of tricky to look at because the normal and tumor tissue transcripts are connected by a black line…. all stacked together. 1B gives the ability of the reductase FDX1 to predict cancer. 1D is another survival curve. Recall that â¶SLC31A1 is the Cu+ transporter Crt1.
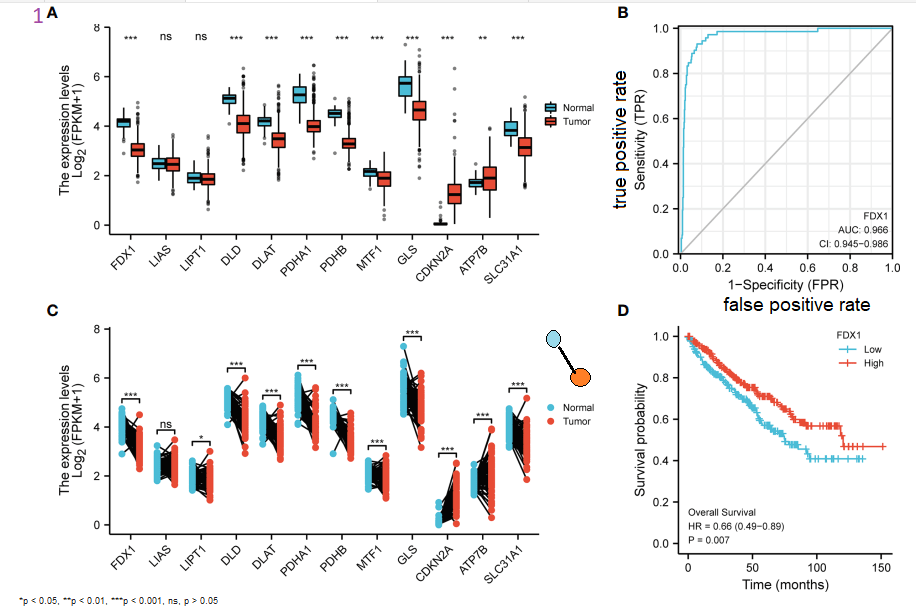
Panel 1C is an interesting way to present tumor and adjacent normal gene transcripts from the same patient. With the Cu+ exporter ATP7B, sometimes there is more in the tumor, sometimes less. With ⶠCtr1 (SLC31A1) it sort of looks like there is a decrease in tumors (red) compared with adjacent normal (blue). The authors claim that all of these differences are significant. Panel 1D is a survival curve. Downward dips with time mean patients dying. High FDX1 producers are less likely to die. [2]
Ji Figure 2, outcomes based on cuproptosis proteins…
Ji 2022 attempted to break CCRC into different categories based on cuproptosis gene expression. Each row in panel 2D represents one of the 12 cuproptosis genes. Group 3, G3, is composed of patients with high levels of some of the cuproptosis genes (2D. below orange bar, red lines) In panel 2E we see that these high expressing individuals are not dropping off the survival curve (2E) as fast.
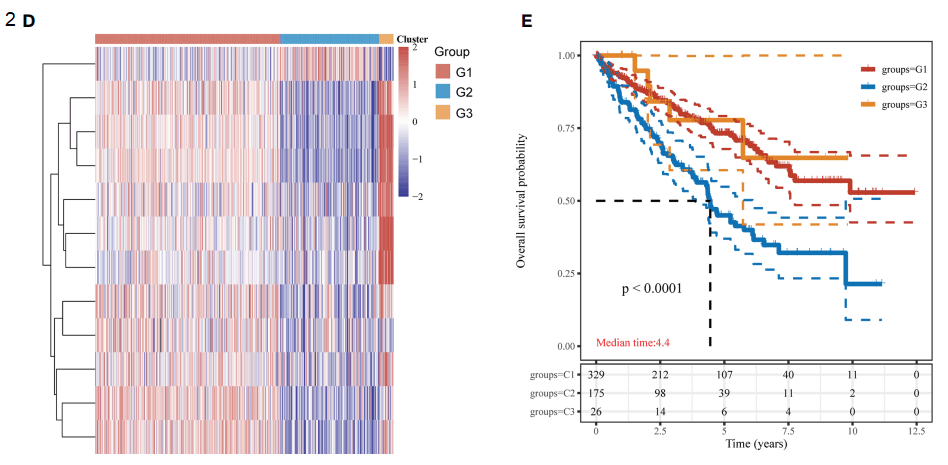
The identities of these rows was searched for in the supplemental data, but not found.
Ji Figure 3, immune cell recruitment
The investigators were able to estimate the immune cells present in the tumors based n the unique gene transcripts found in these cells.

The aspect of this interesting figure that prevents us at CopperOne from taking this too seriously is that we have no tumor microenvironment info and what role Warburg effect and the lactic acid that comes with it might have on the immune cell infiltration. Does more Ctr1 allow for more Cu+ transport and reliance on the electron transport chain?
Figure 4 of the Ji 2022 publication compared the sensitivity of the three groups to various chemotherapy agents. It was difficult to determine just how these data were curated. The data are avaible in reference [2]. Trying to correlate the mechanism of these treatments to the cuproptosis genes is beyond the scope of this post.
Ji Figure 5 cancer immunosuppression and escape from it
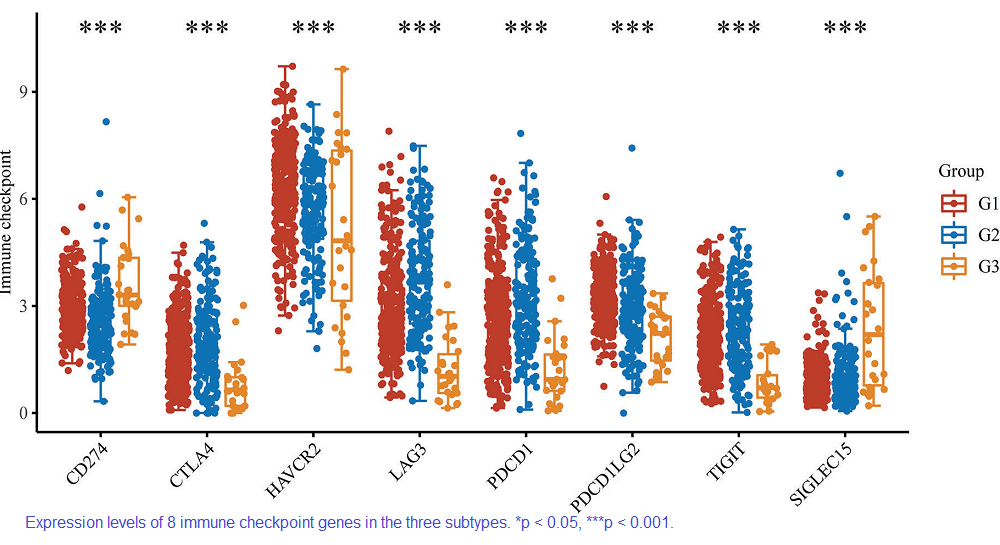
CD274 is the gene that codes for tumor produced, CD8+ T cell inhibiting PD-L1. CTL4 is the cytotoxic, CD8+ T lymphocyte associated protein 4. HAVCR2 is also known as Tim3. We’ve covered the copper connection with PD-1/PD-L1 and Tim3 on this site. LAG3 is lymphocyte activating gene 3 that maintains lymphocytes in a non -proliferative state. PDCD1 is the programmed death protein 1 PD-1. PDCDILG2 is also known as PD-2. TIGIT is expressed in natural killer (NK) cells and some T cells. It’s blockage with antibodies is being explored as a cancer immunotherapy. SIGLEC15 appears to have a role in cancer immune regulation and may be a target of immunotherapy to treat cancer. Note that G3 with the more profound cuproptosis gene signature is sometimes associated with more bad immuno suppression genes like PD-L1/CD274 and SIFLEC15 but in general is associated with less, all of the others….It is disappointing that we don’t know how the expression of these 8 genes correlates with ⶠCtr1 or DLAT that binds lipoic acid and processes purvate for the TCA cycle.
Ji Figure 6…on being a normal kidney
Ji Figure 6 examined the concept of differentially expressed genes in clear cell renal carcinoma. The KEGG and GO clusters of genes in related metabolic pathways revealed nothing much revealing. The G1 group had better survival compared to G2, with was the worse. Figure 6 contained a volcano plot. The fold change of a protein transcript is plotted on the X-axis. The -log P value is plotted on the Y axis. NRP3 is atrionatriuretic peptide receptor C peptide receptor 3 is part of the normal functioning of our kidneys. It’s expression in the healthier G1 group is at least 2 log10 units, or 102 = 100x more than the G2 group. Moving on to the Y-axis, its -log10 P value is just shy of 60. Lets call it 50. The -log10 of 50 is 10-50. In terms of p values we can be 99.999…9% percent sure we are not dealing iwth an artifact. We have 49 9s in place of the there … Many of the gene transcripts that drop out in the G1 group are ion and peptide transporters. It as if the G2 CCRCC tumors have stopped being anything that remotely resembles a kidney.
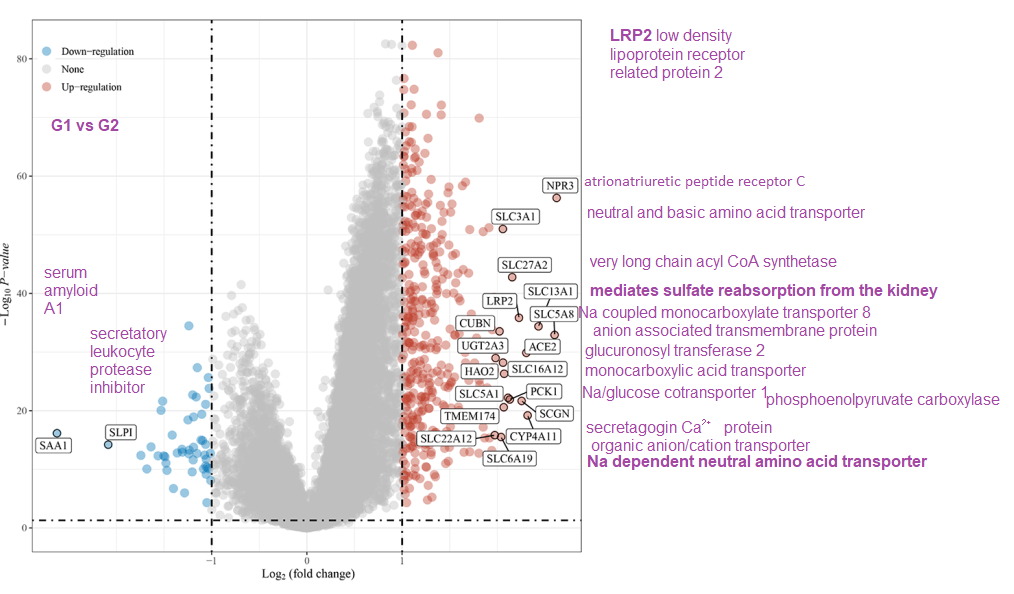
Vearing away from solute transport, Ji and coworkers focused a lot on immune cell infiltration. What is it about a CCRC not being a normal kidney any more that brings in the immune cells?
Ji Figures 7 and 8, cuproptosis and cancer transcripts
Ji and coauthors used several RCC databases to determine which cuproptosis gene expression correlates with other known cancer related genes. Stars indicate genes that are immune system checkpoints. The names of other genes have been written into their Figure 7. P glycoprotein as a reputation for exporting chemotherapy giving the tumor resistance. Note that aldolase B is a glycolytic enzyme that is only weakly associated with cuproptosis genes. GPAT3, on the other hand, is very much part of the cuproptosis genes that feed into the TCA cycle. Seeing a renal chloride channel tied to the cuproptosis genes suggests a state of maintained differentiation, and less stem cell ness. The renal organic anion transporter does not seem to be as positively correlated with cuproptosis genes.

Let’s take our SLC31A1 transcript that codes for Ctr1, the Cu+ transporter. When SLC31A1 goes up , the GPAT3 transcript goes up too. The closer the Pearson correlation coefficient is to 1, the more the two transcripts track each other. It is interesting to note that GPAT3 codes for protein involved in triglyceride synthesis. Ji and coworkers took the starred gene transcripts of proteins that control immune response. HMGCS2 is perhaps the most exciting from a metabolic standpoint. This transcript codes for 3-hydroxy-3-methylglutaryl-CoA synthase 2 (mitochondrial).
Ji and coauthors came up with a cancer related gene score. The rationale was not totally clear. It is hard to find good descriptions for all of the proteins that these transcripts code for.
CRG score = ( −0.006 )*ENAM + (−0.1496) *WDR72+ (−0.0583) *CLDN10 +(−0.0019) *HMGCS2+ (−0:217) *CYFIP2 + (−0.0441) *QRFPR,
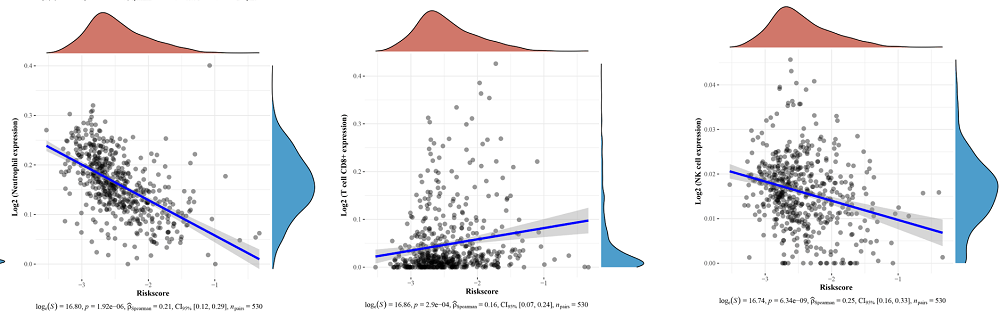
A positive correlation between the CRG score and macrophages, monocytes, CD8+ T cells, and Tregs infiltration. A negative correlation was found between the CRG score and infiltration of neutrophils, NK cells, and nonregulatory CD4+T cells. The Spearman correlation coefficient between the CRG score and neutrophil infiltration was -0.62 CRG score. These plots are but a few examples from Ji 2022 Figure 8.
Does cuproptosis healthy dying require prior healthy living?
It is becoming hard to reconcile the “cuproptosis” regulated cell death genes being associated with a better prognosis in clear cell renal carcinoma. [1,2] These so called “death” genes are associated with better prognoses and normal living as a functional kidney with the assortment of proteins for reabsorption of filtrates. This post started out as an exploration of cuprous pyruvate as an adjunct cancer therapy. Hone the Cu+ to its DLAT target with pyruvate and let it oligomerize ⶠDLAT in a process called cuproptosis in a previous post . There is talk of taking CopperOne with an oil based carrier to keep it in the +1 oxidation state. Would lipoic acid be something good to add to the mix? Nonetheless, it would be interesting to see how cuprous pyruvate performs in cell based studies.
References
- Bian Z, Fan R, Xie L. A Novel Cuproptosis-Related Prognostic Gene Signature and Validation of Differential Expression in Clear Cell Renal Cell Carcinoma. Genes (Basel). 2022 May 10;13(5):851. PMC free article
- Ji ZH, Ren WZ, Wang HQ, Gao W, Yuan B. Molecular Subtyping Based on Cuproptosis-Related Genes and Characterization of Tumor Microenvironment Infiltration in Kidney Renal Clear Cell Carcinoma. Front Oncol. 2022 Jul 6;12:919083. PMC free article
Leave a Reply