Category: copper biochemistry
-
Cu(II) and Adenosylhomocyteinase
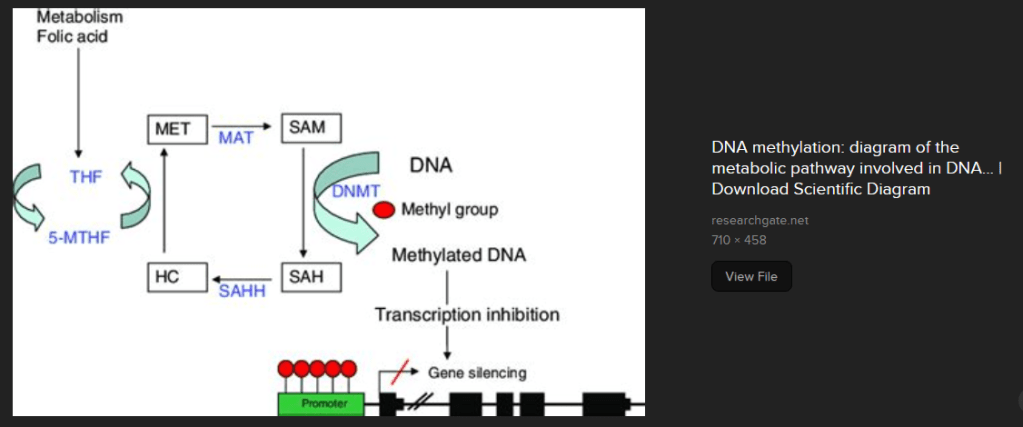
Adenosyl homocyteinase is a methyl group transferring enzyme that is inhabited by copper in the +2 oxidation state. We were trying to better understand the process of gene silencing by methylation, see below. In the process we discovered the mechanism of how +2 oxidation state copper might be bad for our hearts.
Some UniProt.org highlights
UniProt.org is a site scientists consult to learn more about proteins. This is where it was discovered that
Adenosylhomocysteinase (SAHH protein, ACHY gene) catalyzes the hydrolysis of S-adenosyl-L-homocysteine to form adenosine and homocysteine. Hydrolysis is the use of a water molecule (H2O) to cleave the first molecule into two new molecules. One molecule gets an “H” and the other gets an “OH.” According to the AI written UniProt blog SAH binds copper ions (By similarity). NAD+ is also a cofactor. The copper part of the story deserves some followup by a PubMed search or simply going to the PubMed that the AI program left us with.

Note that this reaction can go in both directions. H2O can be used to cut S0adenosyl-L-homoclyteine or it can be liberated by “fusing” L-homocysteine with adenosine. This is the reference to the actual scientific study.
Li M, Li Y, Chen J, Wei W, Pan X, Liu J, Liu Q, Leu W, Zhang L, Yang X, Lu J, Wang K. Copper ions inhibit S-adenosylhomocysteine hydrolase by causing dissociation of NAD+ cofactor. Biochemistry. 2007 Oct 16;46(41):11451-8. PubMed
This study demonstrated that Cu2+ bound to SAHH and decreased its affinity for cofactor NAD+.
Back to the SAHH products and reactants
Things are tricky here because our Cu(II) inhbited wenzyme SAHH can go in both directions. Many readers may recognize the products/reactants as substances used in diagnostic blood tests.
Adenosine acts on receptors in our blood vessels that might increase blood flow. It is also used in medical tests of our heart function. According to the Cleveland clinic homocysteine can indicate an increased risk for cardiovascular disease. According the Health Matters S-adenosylhomocysteine is also used as a risk factor for cardiovascular disease. Health Matters references peer reviewed publications stating that S-adenosylhomosysteine may be a more sensitive marker than homosysteine because the former can inhibit DNA methylation enzymes that turn genes off. DNA methylation can turn good genes off too.
SAHH and turning genes off.
This post is not going to explore the scientific study related to this image. Putting methyl groups on the promoter of a gene prevents the gene from being transcribed into messenger RNA that gets translated to protein by our ribosomes. While we know that Cu(II) inhibits one enzyme , SAHH, in this process, we do not know what the impact, if any, of consuming Cu(II) will have on DNA methylation.
This post is not meant to say that taking a Cu(II) will inhibit this cycle. If one is to take a copper supplement maybe, just maybe,a Cu(I) might be better.
-
Phtalates heavy metals pregnancy
Copper is a heavy metal and is needed for myelin development. [1-3] Surely too much of a good thing is bad. Often other heavy metals follow copper. A study out of Rhode Island USA correlated neurological health with placental heavy metal concentration. [4] A study out of Taiwan looked at heavy metals and phtalates in the urine of pregnant mothers. [5] Both studies correlated heavy metals with mental functioning of the children. Phtalates are used in the production of plastics. When an expecting mother has concerns about heavy metals in the town’s water supply she drinks more bottled water right? This post makes a weak attempt to explain the statistics used in the Rhode Island and Taiwan studies. The take home is that prenatal copper is likely a good thing. Phthalates are probably bad. You really need to discuss the issue with someone licensed to practice medicine.
- Copper deficiency and myelin
- Copper excess a bad thing?
- Other sites on prenatal copper
- Talk to your healthcare provider
- References
Copper deficiency and myelin
Copper is essential to prenatal development of all organ systems. [1] Recently copper deficiency has become more prevalent due to zinc supplementation and bariatric surgery. [1] This same review claims that persistent structural changes can occur that supplementation after birth may not repair the damage. [1] In a 1976 rat study copper deficiency induced by a low copper diet for three generations of rats. [2] These authors demonstrated reductions in the yield of myelin (56%), brain weight (11%), and body weight (43%) in F2 generation rat pups nursed by their own copper-deficient mothers. [2] The myelin associated glycoprotein appeared to have a higher molecular weight. Normal myelin weight was restored when the pups were allowed to nurse from a healthy mother that was not copper deficient. [2] Brain and body growth were not restored. [2] This postnatal copper replacement by a foster mother produced a normal yield of myelin per gram of brain tissue, but.
Close to 50 years later Wikipedia authors have more to say about myelin associated glycoprotein MAG. The full length membrane associated protein is 100kDa, the cleaved portion is no long associated with the oligodendrocyte membrane. This image came from ResarchGate.
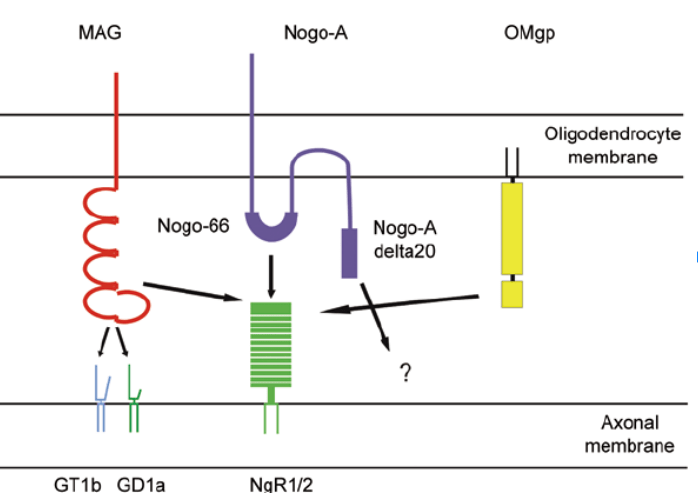
Myelin inhibitors of axon regeneration. Myelin-associated glycoprotein (MAG) halts axonal regrowth by binding to the gangliosides GD1a or GT1b and/or Nogo receptors 2 and 1 (NgR 2/1). Neurite outgrowth inhibitor A (Nogo-A) contains two axonal outgrowth inhibitory domains, Nogo-66 and Nogo-A delta20. The receptor for Nogo-66 is NgR1, while the receptor for Nogo-A delta20 is unknown. Oligodendrocyte myelin glycoprotein (OMgp) inhibits axonal regrowth by binding to NgR as well.
Lessons from the cuprizone model of MS
Cuprizone is a copper chelator that that is used to induce experimental models of the demyelinating disease multiple sclerosis. On one many peer reviewed studies from this PubMed search [3] points to the mitochondria and Cu/Zn SOD as being targets.
- Oligodendrocytes are the myelinating cells that increase in numbers during mid gestation. Copper deficiency leads to excess reactive oxygen species due to failure of Cu/Zn supreoxide dismuatase to scavenge and, secondly, rupture of mitochondia membrane, release of cytochrome C and apoptosis. [3] Cuprisone selectively decreases the mitochondria membrane potential of this cell type. [3]
- Astrocytes help form the blood brain barrier and are responsible for uptake of excess neurotrasmitter. A Cuprizone activation of astrocytes may contribute to demyelination. [3]
- Microglia are the macrophages of the brain. Cuprisone causes the accumulation of microglia and macrophage. [3]
We hear a lot about copper toxicity? What gives?
Copper excess a bad thing?

The Rhode Island study measured the heavy metal content of the placenta and assessed the infants soon after birth.[4] The Taiwanese study measured the heavy metal content of the mother’s urine during pregnancy and assessed the children as toddlers. [5]
The Rhode Island study suggests that low copper in the placenta is associated with worse category of neuro-behavior deficits. [4] The Taiwanese study suggests that high copper in the urine is associated with neurological issues in toddlers. [5]
In Rhode Island USA
Data from the Rhode Island Child Health Study (RICHS) population was used to test the hypothesis that placental heavy metals are associated with neurological problems. .NICU Network Neurobehavioral Scale (NNNS) was used to assess behavior issues in infants. [4]
Defining profile behaviors
Figure 1 breaks the study population children into a series of functional Z scores.
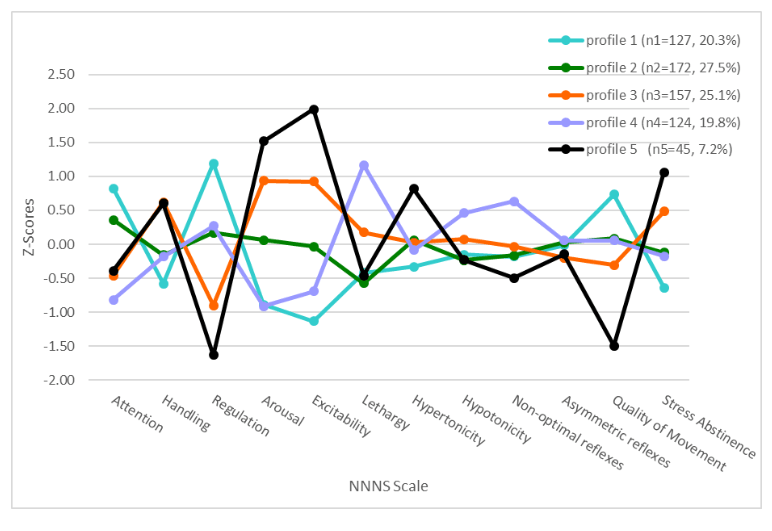
- highest attention, movement regulation, lower stress abstinence signs, less handling, excitability hypertonicity.
- typical neurobehavior, largest profile, overall average, except lowest in the lethargy scale.
- average performance of scales
- lethargy, hypotonicity, non-optimal reflexes, and lowest attention and arousal.
- most extreme regulation, arousal, excitability, hypertonicity scores, more non-optimal reflexes, lowest quality of movement and highest stress abstinence signs.
Heavy metal levels by profile groups
Note that these are placental heavy metal concentrations.
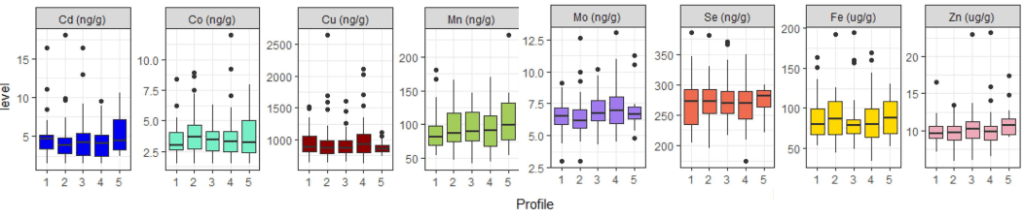
These box and whisker plots show median (line through the box) and the boundaries of the 2nd and 3rd quartiles. The lines mark the 1st and 4th quartiles. The dots are outliers. Note that Cu is higher in the placenta of favorable profile 1 babies than in the unfavorable profile 5 babies. The odds ratio is described in greater detail in the overview of the Taiwanese study. In the Rhode Island study, Cu is the only metal to have an odds ratio less than 1. In other words, babies whose placenta have higher levels of Cu are less likely to have neurological issues.

Copper was the only metal found in placentas that had a negative odds ratio of being associated with neurological issues.
The Rhode Island study used something called the quantile g-computation approach to understand the association between metal mixture and NNNS profile 5 versus the other four profiles. The model assumes the linearity of simultaneously occurring metals some of which positively and some negatively affect the NNNS scores. Each exposure was given a positive or negative weight which add up to be 1. Cu showed the largest negative weight among the metals followed by selenium in the model adjusted for infant sex, age, and maternal race, BMI, and education status.
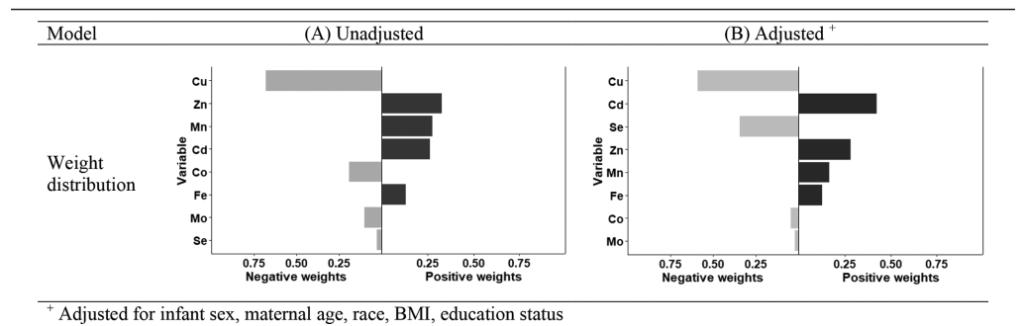
The Rhode Island study discussed the role of Cu in development as well as other studies rationalized the importance of copper in neurological development.
In Taiwan
A Taiwanese study pregnant women and their single birth children and correlated psychiatric functioning with heavy metals and phthalate esters in the urine. [5] Phthalate esters are a class of plasticizers with an increase in consumer exposure. The authors claimed that prenatal exposure to Cu, dibutyl phthalate, and di-2-ethylhexyl
phthalate was associated with child depressive problems and attention deficit/
hyperactivity problems at 4 years of age. [5]confounding graphs
Smoking and drinking are sometimes considered confounding variables. People who smoke are more likely to drink alcohol. These authors used a directed acyclic graph (DAG, Figure S1) to illustrate the confounding variables that they needed to adjust for:
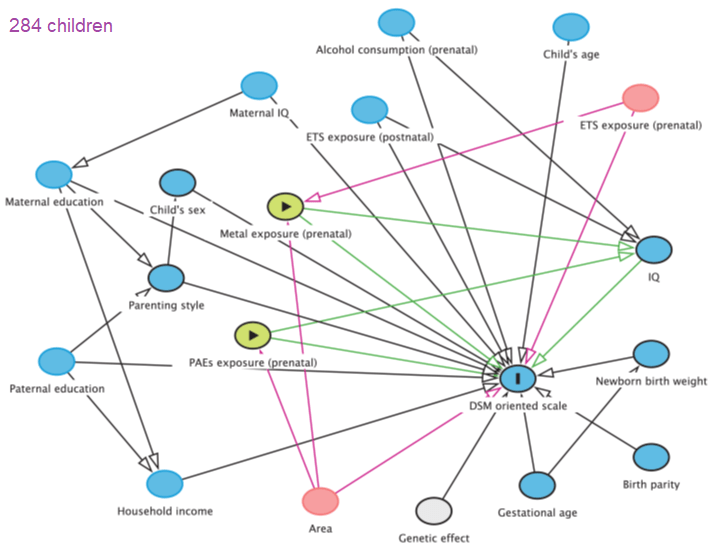
The blue oval with the solid bar is the outcome measure: The green ovals with the arrows are the two environmental factors hypothesized to lead to mental health problems as measured by the Diagnostic and Statistical Manual of Mental Disorders, Fifth Edition (DSM-5) All of the other ovals are confounding variables.
- prenatal environmental tobacco smoke ETS exposure (yes or no) and geographic area (central, southern, or eastern) for metals analysis, with adjusted geographic area for the analysis of PAEs.
- Model 1 adjusted for child’s age and sex (boy or girl), maternal education level (≤12 years, 12–16 years, and > 16 years), birth parity (1, 2, or ≥3), gestational age, prenatal ETS exposure, and geographic area
- Model 2 included the child’s IQ as measured by the Wechsler Preschool Primary Scale of Intelligence Fourth Edition
Spearman correlation coefficients
The Spearman correlation coefficient is a way of correlating the relationship between two variables, the closer the R value is to1.0 (direct) or to -1 (inverse) the stronger the correlation. This coefficient assumes the data are monotonic. An example is given of non-monotonic data.
The complexity of the situation is further illustrated in supplemental figure 2 which illustrates a rather sobering reality by presenting a table of Spearman correlation coefficients. All of the squares are green and blue indicating a positive correlation. The asterisk indicate the level of confidence. In simple lay terms * indicates that we are 95% confident that the observed correlation is not due to random chance, ** 99% confident.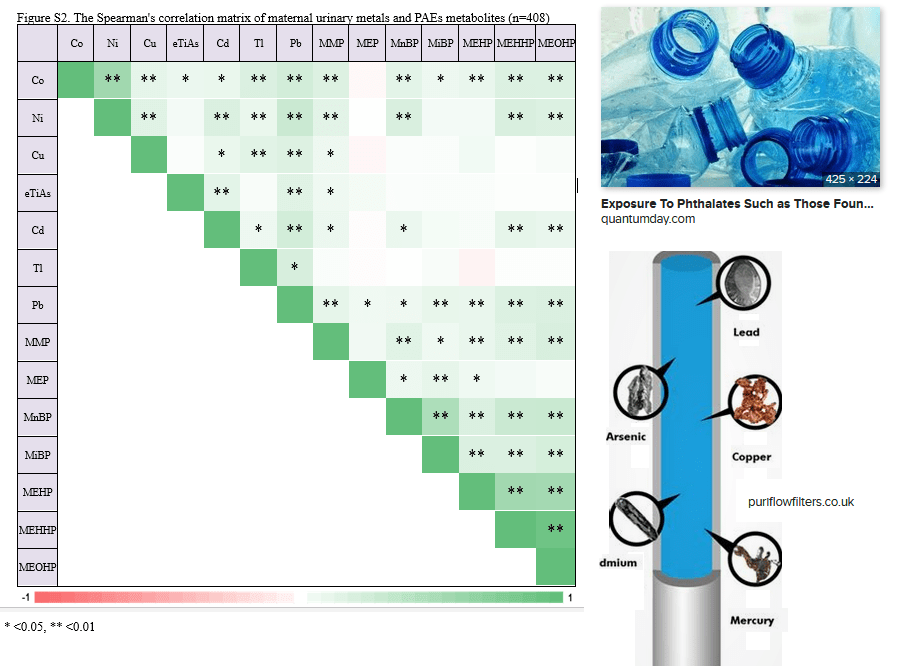
Of course a mother peeing one phthalate metabolite is likely to be peeing others. If a mother lives in a region in which she knows the water is contaminated with heavy metals, she may be more likely to drink bottled water and become exposed to phthalates as well. According to this table, there is a positive correlation between the concentration of lead (Pb) in urine with the concentration of copper ( Cu), nickel (Ni), cadmium, (Cd) cobalt ( Co ), and total inorganic arsenic (eTiAs).
phthalates and metals in combo

β (SE) may refer to the median 50% value of a quartile with SE being the standard error.
In statistics, p and q values are related entities. P values are the fraction of false positives whereas q values are the rate of false discovery. “To put this another way, p-values tell you the percentage of false positives to expect and take into account the number of tests being run. For example, if you run 1600 tests, you would expect to see about 80 false positives. The q-value doesn’t take into account all the tests; they only take into account the tests that are below a threshold that you choose (i.e. tests reporting a q-value of 5% or less).”
An odds ratio (OR) is the ratio of the odds of two events occurring simultaneously.
Spearman correlations and hypothetical graphs
Note that the graphs on the left are not real data from the study. They are being presented to give the lay reader an idea of what the real data might look like based on the R values.
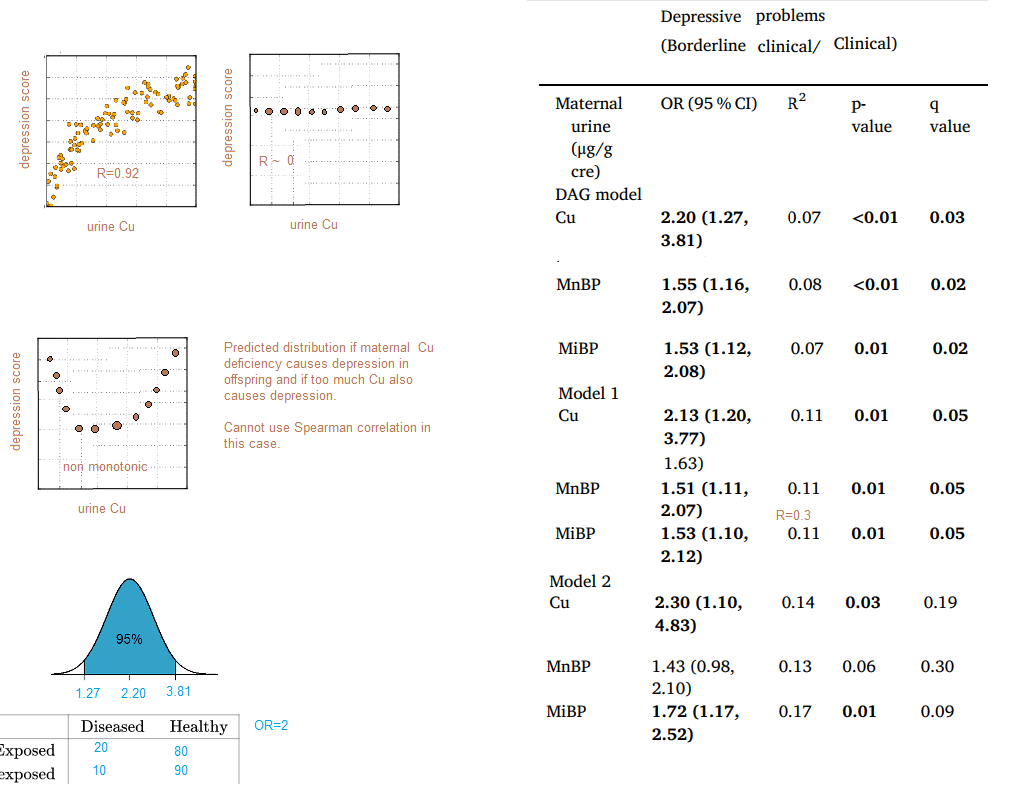
One of the things that makes this publication is that the authors assume that the reader is an expert in statistics and at the same time they don’t actually who their Spearman correlation data graphically. A search of the PDF file of the manuscript for “monotonic” did not reveal whether or not this assumption was met. Reporting R2 rather than R is the topic of considerable Internet debate. The bottom line is that the data were not known. The authors certainly seem to have a firm understanding of statistics. It would just be nice to see the data because too little copper is known to cause problems.
Other sites on prenatal copper
- Being the Parent brings up some recommended daily allowance and a list of copper rich foods.
- The Baby Center has similar information for expecting mothers and also advises a mother to talk to her doctor about the best supplement should her diet not contain enough copper.
- This Mayo Clinic site turned up on an Internet search but didn’t say anything bout copper supplements during pregnancy.
- What to Expect also gives the RDA for copper and a list of copper rich foods.
- MindBodyGreen turned up in an Internet search of prenatal copper for unknown reasons. These authors stated that it is possible to get to much zinc but say nothing about too much zinc leading to copper deficiency. [1]
Talk to your healthcare provider
“Talk to your healthcare provider.” Is the obvious answer when sources of contaminants and getting proper amounts of trace elements seems to be overwhelming. Both the Rhode Island [4] and Taiwan [5] are public access for your healthcare provider to review with you.

A collage of sources of phthalate and heavy metal contamination and a pregnant couple talking to a healthcare provider. Things are crazy complicated that seem to become only more complicated when statistical analyses are used. Surely there is a common sense approach going back to days in which are soils were not copper depleted and heavy metal and plastic contamination were unknown.
References
- Uriu-Adams JY, Scherr RE, Lanoue L, Keen CL. Influence of copper on early development: prenatal and postnatal considerations. Biofactors. 2010 Mar-Apr;36(2):136-52.
- Zimmerman AW, Matthieu JM, Quarles RH, Brady RO, Hsu JM. Hypomyelination in copper-deficient rats. Prenatal and postnatal copper replacement. Arch Neurol. 1976 Feb;33(2):111-9.
- Zirngibl M, Assinck P, Sizov A, Caprariello AV, Plemel JR. Oligodendrocyte death and myelin loss in the cuprizone model: an updated overview of the intrinsic and extrinsic causes of cuprizone demyelination. Mol Neurodegener. 2022 May 7;17(1):34. PMC free article
- Tung PW, Burt A, Karagas M, Jackson BP, Punshon T, Lester B, Marsit CJ. Prenatal exposure to metal mixtures and newborn neurobehavior in the Rhode Island Child Health Study. Environ Epidemiol. 2022 Jan 28;6(1):e194. PMC free article
- Tsai TL, Hsieh CJ, Wu MT, Chen ML, Kuo PH, Wang SL. Co-exposure to toxic metals and phthalates in pregnant women and their children’s mental health problems aged four years – Taiwan Maternal and Infant Cohort Study (TMICS). Environ Int. 2023 Feb 4;173:107804 free article
-
Cu(II) and advanced glycation end products
A travel back in time [1,2]
We have known that Cu(II) is potentially toxic for a long time. The year is 2002. We have only recently appreciated the role of nitric oxide in relaxing our blood vessels. The Nobel Prize in medicine for this discovery was awarded in 1998.
- Glycated albumin binds three times as much Cu(II) and
- Copper bound to glycated albumin remains redox active. [1]
- Cu(II) glycated albumin causes the degradation of nitric oxide. [1] So what? We’ve covered Fenton/Haber-Weiss chemistry on this site. NADPH oxidase, ACE inhibitors for high blood pressure, the opposite of NO relaxing our blood vessels…
- Plasma copper of diabetic rats is approximately twice that in normal rat plasma. [1]
- The same is true for tail tendons of diabetic rats. [1]
- Implants coated with glycated albumin can chelate 5x as much Cu(II) as implants coated with non glycated albumin. [1]
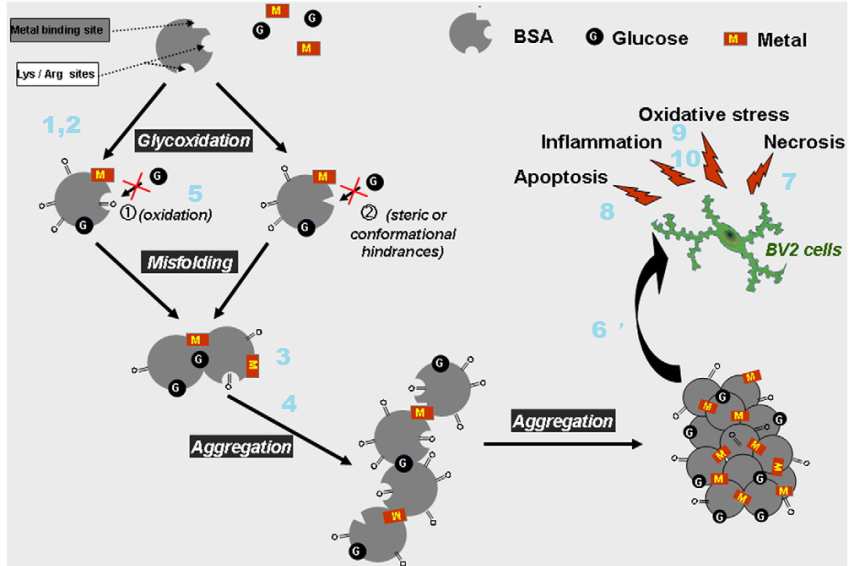
We’ve covered the so called Maillard reaction in the polyol post. The same reaction that leads to advanced glycation end products (AGE) also leads to the browning of bread and other food chemistry sorts of things. In 2004 food scientists in Germany compared binding of Cu(II) and Zn(II) to N(epsilon)-fructose-lysine and N(epsilon)-carboxymethyl-lysine. The regions in squares were chemically blocked so that XCu(II) and Zn(II) could only bind to the side chains. [2] Cu(II), but not Zn(II), bound to both of these compounds. [2]
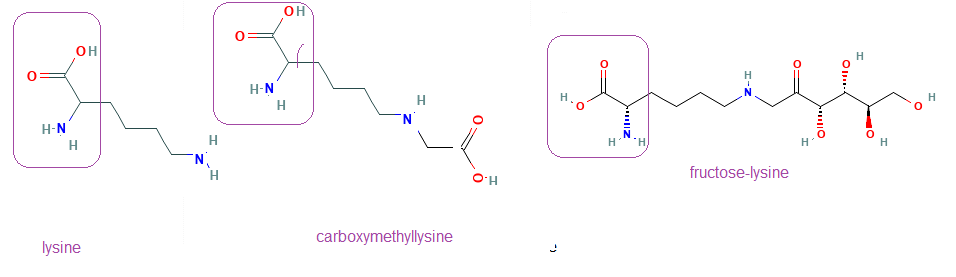
The regions in the boxes are part of the peptide bond in proteins. The modified lysine side chains bind Cu(II) In vitro adducts of Cu(II) to glycated lysines was identified in 2014. [3] The following paper may be difficult for non biochemists to follow. Short lay summaries will be given after each set of figures because this is important.
1 Cu binding to collagen and albumin
0.4 mM bovine serum albumin (BSA) was reacted with 100 mM D-glucose in a pH 7.2 buffer under sterile conditions and nitrogen gas in capped vials at 37 °C for seven weeks. Solutions of 1 mM, 3 mM of copper (CuCl2) or zinc(ZnCl2) ions were added during the glycation process. The proteins were dialyzed against MES buffer, pH 7.2 and stored at -20 °C. AGE-related modifications were determined by measuring glycophore fluorescence at 425 nm under excitation at 345 nm.
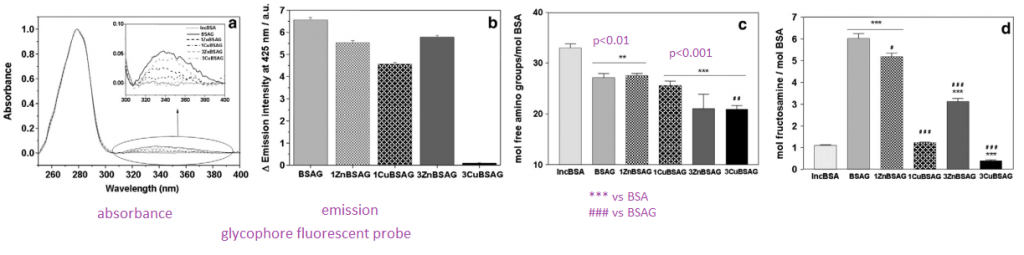
- Panel A We are looking at a fluorescent probe that binds to glycosyl groups. Glycophore absorbs in the 345nm long UV region of the spectrum. When light of this wavelength is used to illuminate the sample
- Panel B We see an emission in the 425 nm blue region of the spectrum. With the 3 mM Cu(II) sample we are seeing a decrease in groups that react with glycophore.
- Panel C Mock 37oC incubated samples have a fair decrease in the amount of free amino groups. What is binding to them, we do not know.
- Panel D For the case of BSA incubated with glucose and 3mM Cu(II) we are starting to suspect that Cu(II) might be blocking glycation..
The interactions between copper and glucose with this abundant blood protein are complicated.
2 Cu(II) changes protein structure

- Panel A When tryptophan is deep inside the core of a protein, it fluoresces in the long UV region of the spectrum when illuminated by shorter wavelength UV light. When the protein unfolds these tryptophans become solvent exposed and less fluorescent. All modified albumins underwent quenching of tryptophan fluorescence as a consequence of protein incubation with glucose. These data suggest that the protein is funfolding.
- Panel B When the tryptophan fluorescence was normalized to “normal” glycated BSA, a “blue shift” was seen in the maximal emission in the Cu(II) bound variety. This is considered indicative an the structure being different, perhaps due to a more exposed tryptophan.
- Panel C Analysis of momentum 1 (M1) relative to the tryptophan emission for different albumin samples was interpreted as indicative of the aggregation process. Aggregation was attributed to important conformational changes int the protein protein in the presence of copper(II) or zinc(II). A cartoon has been added of a protein unfolding, aggregating, and undergoing larger conformational changes.
- Panel D FTIR is used to measure secondary structure, i.e. alpha helices, beta sheets. Cartoons of alpha helices and beta sheets have been added. The idea is that Cu(II) is affecting global structure without affecting local structures.
The Cu(II) and Zn(II) glucose combination can cause this abundant blood protein to aggregate.
3 Cu(II) causes glycated albumin aggregation
This figure is a follow up to Figure 2c.

- Panel 3A Rayleigh scattering is a means of monitoring the formation of larger particles.
- Panel 3B this is an SDS PAGE gel that sorts proteins by size and charge. The charge is established by the charge of the amino acids and the size, which determines how much charged SDS detergent can coat it. In this publication “native†probably means without the reducing agent. BSA can form disulfide bonds with essentially double the apparent molecular weight.   Â
- Panel 3C Thioflavin T is a fluorescent probe that fluoresces when it interrelates into amyloid structures. A similar concept has been covered with Cu(II) induced IgG light chain amyloid AL post.
These aggregates also exhibit amyloid structures.
4 Cu(II) albumin aggregation part 2
Atomic force microscopy (AFM) is a type of scanning probe microscopy that uses a mechanical probe that touches or feels the surface with Piezoelectric elements that allow the touching to be recorded. . The information is gathered by “feeling” or “touching” the surface with a mechanical probe. ATM is more than 1000 times better than the optical diffraction limit.
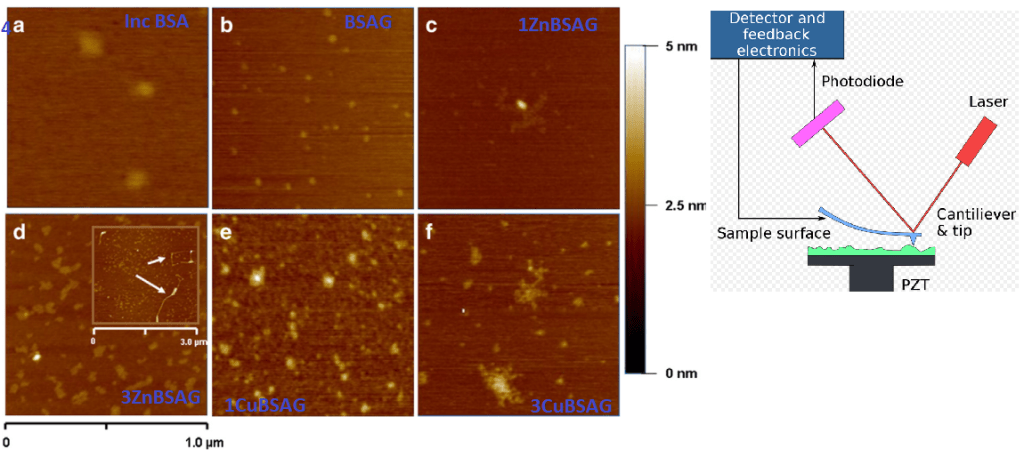
These Cu(II) and Zn(II) aggregates are clearly different.
5 Loss of free thiols and gain of carbonyls
While BSA has only one free thiol, this thiol can form a disulfide bond with the other single free thiol of a second BSA. This is suggested in Panel 3B. Protein carbonylation is another modification that can cause a protein to unfold and aggregate.
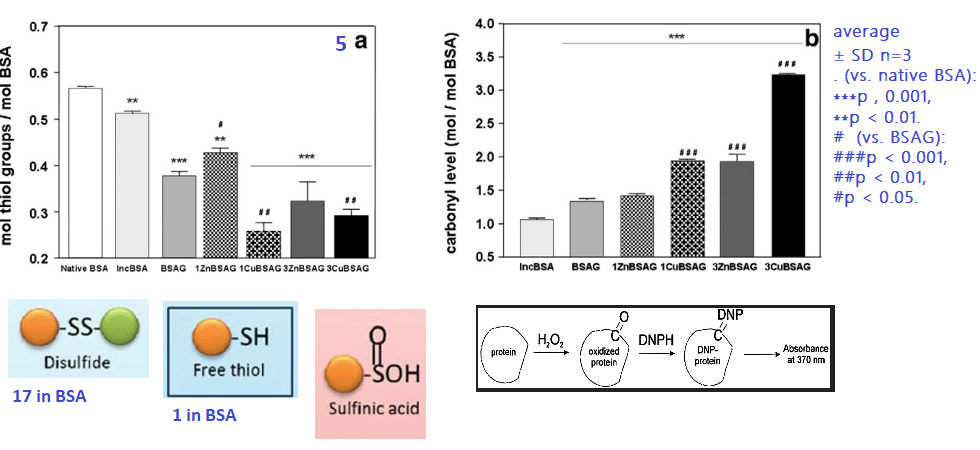
We don’t know if the loss of free thiols in the presence of Cu(II) and Zn(II) is due to direct binding and competition for the assay reagents or if some of these thiols have been oxidized to sulfinic acid and related compounds. It is interesting to note that redox inactive Zn(II) also increases protein carbonyls
The 3 mM Cu(II) and glucose combination is the most potent inducer of BSA carbonyls.
6 In vitro toxicology
The trolox equivalent anti-oxidant capacity (TEAC) assay is very much a Cu(II) dependent assay that measures anti-oxidant capacity relative to Trollox, a vitamin E analog.

7 Glycated BSAs kill cells
A moused microglia cell line, BV2 cells, were used for all assays. The MTT assay , in simple terms, indicates cells with healthy amounts of NADH. Cell viability was also measured by surface characteristics (forward light scattering) using a technique called flow cytometry.

Recall that the unbound glucose and Cu(II) or Zn(II), as the case may be, have been removed from the BSA mixture. This modified BSA is greatly reducing cell viability.
8 Necrosis vs Apoptosis
Propidium iodine (PI) is a dye that becomes fluorescent when it binds to DNA. It can only get to the cell nucleus when the cell membrane has been damaged. PI is the red dye outside the scell waiting to enter holes in the membrane in the second image. High fluorescence is indicative of necrotic cells. Healthy cells should have little or no PI fluorescence, lower half. Annexin V is a protein that binds to phosphatidyl serine, a phospholipid that appears of cells undergoing apoptosis, programmed cell death. Healthy cells should appear in the lower left quandrant.

These data indicate that BSA treated with 3mM Cu(II) and Zn(II) are more toxic than just the 1mM treatment groups. It should be remembered that this is not the raw metal but BSA treated with the raw metal and glucose! 3 mM is really not that much.
9 Reactive oxygen species and IL-6
The rationale for looking at IL-6 is not that clear. IL-6 was not mentioned more than twice in the Kamalov study: once in the methods and once in the results saying that 3ZnBSA induced it. [3]
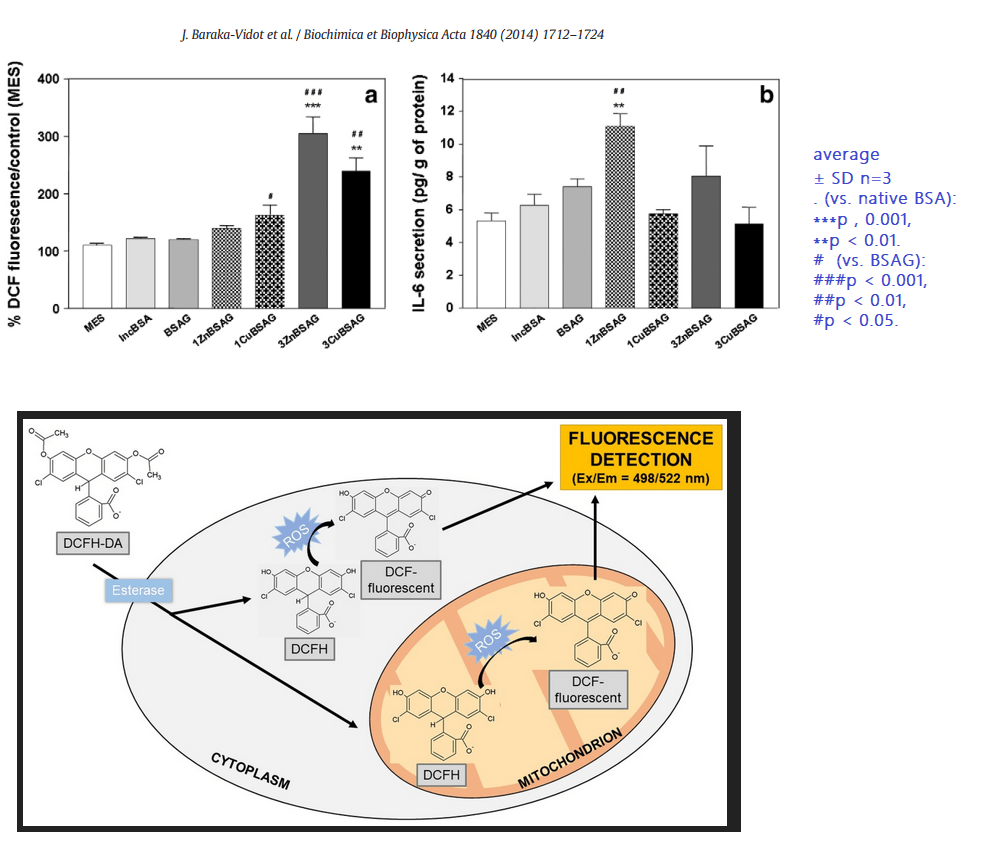
The confusing thing about use of IL-6 is that it is not a direct product of the inflammasome that we have discussed on this site. Some of these results are unexpected because Zn does not redox cycle like Cu, yet glycated BSA treated with Zn also causes the generation of ROS in a microglia cell line. These results are suggestive of an unfolded protein response that is speculated on this post, not necessarily by Kamalov and coauthors [3], to recruit macrophage.
Glycated albumin in the presence of Cu(II) and Zn(II) can induce cells to generate reactive oxygen species. A followup question(s) would be do Co(II), Mg(II), and Mn(II) have the same interaction with glycated albumin?
10 Cu sites on glycated BSA
Bovine serum albumin, BSA as we have been calling it, has several potential divalent cation binding sites that were discussed in the Kamalov publication. [3] These include a cysteine at position #34 in the N-terminus and several histidines in the metal binding site. The source of the images came from a publication on ischemia conditioned albumin.

This is bad news for diabetic cows. What about people?
A follow up study with human albumin
The followup study used human albumin and methylglyoxal as the lysine, arginine, and cysteine modifying small molecule. [4] In this publication the position was taken that about 10–15% of the total copper in blood is bound to albumin. The position was also taken that Cu(II) bound to albumin does not engage in Fenton chemistry. A technique called mass spectrometry was used to detect AGE in peptides from treated HSA. Cu(II ) at physiological and sub-physiological concentrations inhibited HSA glycation compared to Cu(II) free HSA. [4] At concentrations above 5 mg Cu(II) glycation was facilitated. [4]
Conclusion
Thank you for following us through this rather complicated study. While there is some evidence that copper may help those with T2D modulate their blood sugar, perhaps it would be better to avoid Cu(II) just in case the serum concentration exceeds that which is protective against albumin glycation. Too much of a Zn(II) supplement may also be bad. It is best to discuss these things with one’s healthcare provider.
References
- Eaton J.W., Qian M. Interactions of copper with glycated proteins: possible involvement in the etiology of diabetic neuropathy. Mol Cell Biochem. 2002;234-235(1-2):135–142. [PubMed]
- Seifert S.T., Krause R., Gloe K., Henle T. Metal complexation by the peptide-bound maillard reaction products N(epsilon)-fructoselysine and N(epsilon)-carboxymethyllysine. J Agric Food Chem. 2004;52(8):2347–2350. [PubMed]
- Baraka-Vidot J, Navarra G, Leone M, Bourdon E, Militello V, Rondeau P. Deciphering metal-induced oxidative damages on glycated albumin structure and function. Biochim Biophys Acta. 2014 Jun;1840(6):1712-24. free article
- Ramirez Segovia AS, Wrobel K, Acevedo Aguilar FJ, Corrales Escobosa AR, Wrobel K. Effect of Cu(ii) on in vitro glycation of human serum albumin by methylglyoxal: a LC-MS-based proteomic approach. Metallomics. 2017 Feb 22;9(2):132-140. [PubMed]
-
cancer cell negative charge
This journey started with a request to look up the charge on different types of cancer cells. This request may have started with a layperson’s understanding of chemistry and charge. Donglu Shi of the University of Cincinnati postulated that the folic acid receptor might be a common tumor cell target whose charge may change when confronted with excess lactic acid [1] from glycolysis not coupled to the TCA cycle and electron transport chain, aka the Warburg Effect. We will conclude that micro domains of the folic acid receptor is where CopperOne might work its therapeutic effects.
The idea is for the supramaramagnetic nanoparticles with the positive surface chare to capture cancer cells for both diagnostic and therapeutic purposes.

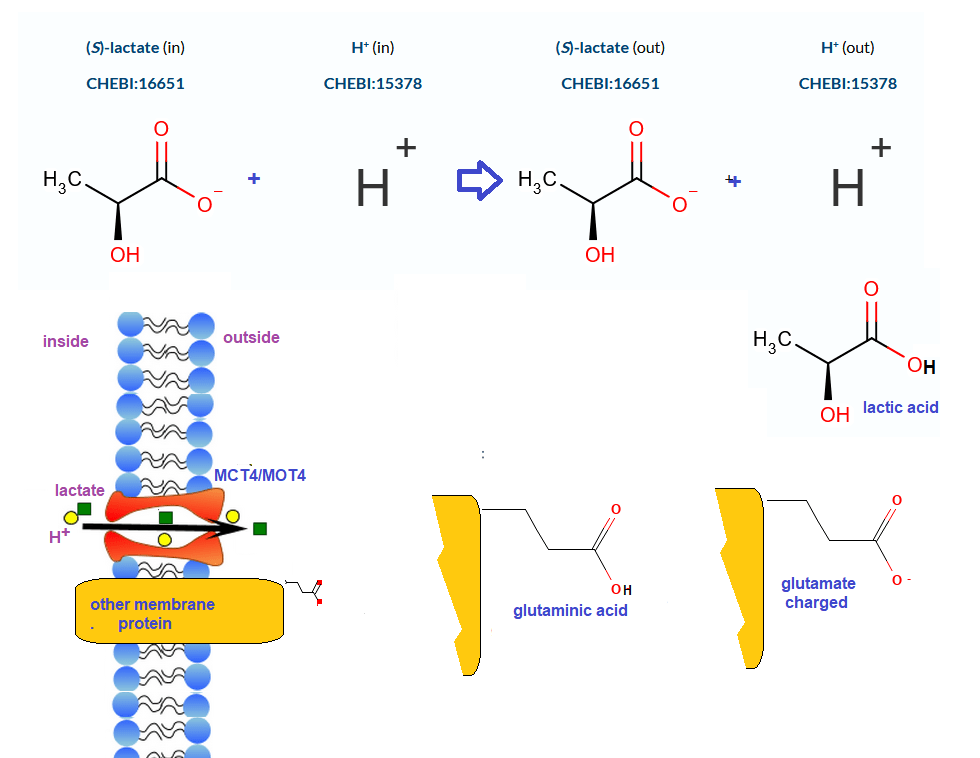
The strategy is to separate tumor cells from normal cells that have less of a negative charge, perhaps because of the lactate production, from sialic acid, or from a combination of the two. These are HeLa cells. Breast cancer cells may be in the range 20–30 m, while the typical dimension of the nanoprobe is on the order of 200–300 nm. Douglas Shi and his laboratory at the University of Cincinnati have designed magnetic nanoparticles that bind to charged surfaces on cells. Dr Shi reminds us that one of the hallmarks of cancer cells is their over reliance on glycolysis and the overproduction of lactic acid/lactate. Numerous sources tell us that the tumor micro environment is acidic due to lactic acid. How can this be so? If we have lactic acid, the tendency would be to donate some of its protons to negatively charged amino acid side chains like glutamate and aspartate. The export system for cancer cells is mono carboxylate transporter 4, or MCT4, or MOT4. This transporter not only removes lactate in the “conjugate base†form from the cell but also releases H+. Lactate is then left to “steal†H+ from uncharged glutamic acid and aspartic acid side chains leaving them with negative charges of their conjugate bases glutamate and aspartate.
The strategy is to separate tumor cells from normal cells that have less of a negative charge, perhaps because of the lactate production, from sialic acid, or from a combination of the two. Breast cancer cells may be in the range 20–30 m, while the typical dimension of the nanoprobe is on the order of 200–300 nm.

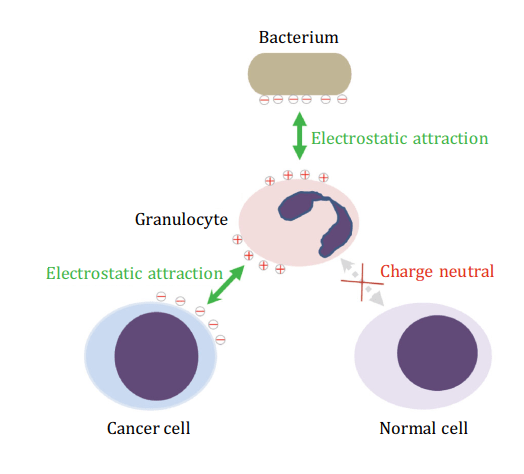
Close to 100% of some cancer cell lines are isolated on these magnetic beads with positively charged groups.  (PMC) We can hypothesize that cells that are close to 100% captured like HepG2 cells (liver cancer) have a greater negative surface charge than say LM-3 cells with less than 50% captured.  The other intriguing twist is that the normal cells, turquoise lettering, are not captured by nanoparticles with positive surface charges. Normal liver cells are weakly captured by negatively charged nanoparticles. Most interestingly to CopperOne is the evidence for large positive charge on peripheral mononuclear cells (PMN). Granulocytes are part of the PMC family of white blood cells. When granulocytes encounter bacteria that secrete positively charged peptides called defensins.The following image is from the second Shi Laboratory review [2]
Another research group used a slightly different technique to measure surface charge on just one particularly aggressive cancer cell type.
Zeta Potential and cell surface charge
Perhaps another review on zeta potential is in order. The Wikipedia authors have compiled an excellent review that is probably beyond most lay readers. Suffice it to say, the Stern double layer is the layer of counter ion charges associated with a charged surface.
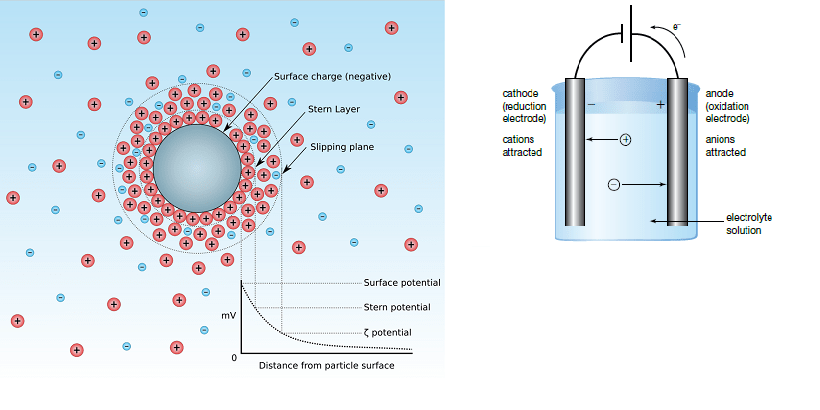
A illustration of zeta potential and the electrophoresis technique used to measurement. Note: Surface charge on any cell will not be uniform as illustrated for this sphere with a uniform negative charge with a collection of positive counter ions. The slipping plane is the place where charged solutes associated surface start to resemble the bulk solution. This is the zeta potential. For particles with charged surfaces, such as cancer cells, the potential is measured by electrophoresis, that is movement through a solution in an electric field between two electrodes.
A Slovakian and Polish group used this approach to measure the surface charge of a glioblasoma multiforme cell line LN-229. GBM is a particularly hard cancer to teat because of its heterogeneity and inaccessibility. Naturally occurring plant phenolics cinnamic acid and ferulic acid were explored as treatments. Electrophoretic mobility was used to measure the surface charge density of LN-229 cells. Treatment of both phenolics caused a decrease in negative charges at high pH and a decrease in positive charges at low pH. PubChem lists two very similar values for the pKa of ferulic acid: 4.42 and  4.58. The pKa is the pH of which half of the groups with an exchangeable H+ are in the protonated form. Pubchem lists two experimental values for the pKa of lactic acid: 3.79 and 3.82.
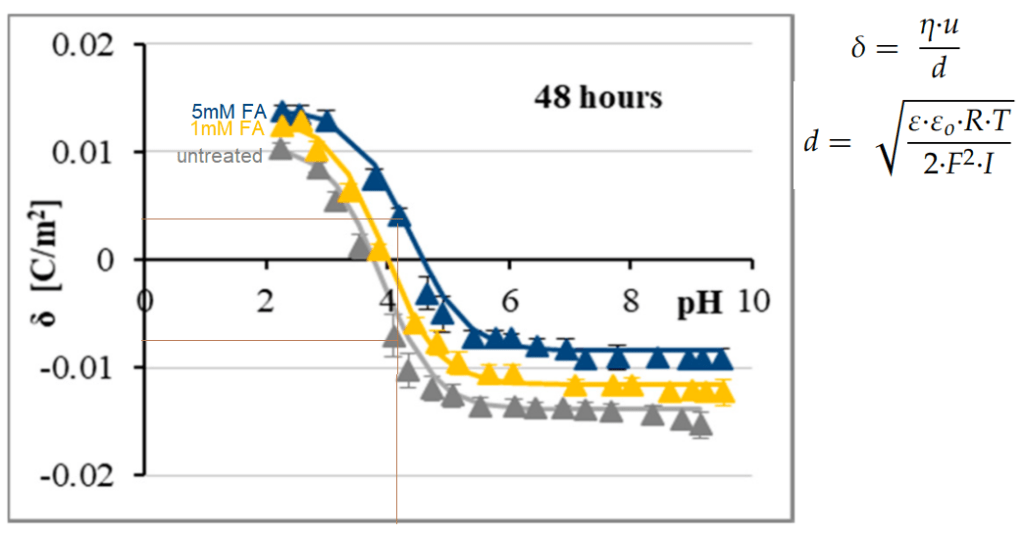
Based on electrophoretic mobility values, the surface charge density δ was determined according
to the above equations in which: η—the viscosity of the solution, u—the electrophoretic mobility, d—the diffuse layer thickness. The diffuse layer thickness was determined using the formula in which R is the gas constant, T is the temperature, F is the Faraday constant, I is the ionic strength of 0.9% NaCl, and ε and ε 0 refer to the permeability of the electric medium. The pH in these experiments was adjusted with NaOH and HCl. It wasn’t clear if the cells were rinsed after being treated with the ferulic acid or if the indicated concentration of ferulic acid was added to the electrophoresis medium in which it becomes the main buffering agent. Lines have been drawn from the approximate pKa of ferulic acid and the corresponding charge density in Coulombs per square meter. [3]In their discussion Naumowicz and coauthors listed factors that may affect zeta potential of the entire cells: temperature, pH, ionic strength, and solvent viscosity (also very low). Naumowicz and coauthors listed factors that are different in tumor cells that might affect surface charge: increased sialic acid, free fatty acids/phospholipids, alterations in acidic/basic functional groups, and a decrease in integral membrane protein levels. Some aspects of charge/charge neutralization were discussed. This would occur above the pKa of ferulic acid. This is in fact what they observed.

- Starting with the negatively charged bacterium or cancer cell
- Ionic strength was high enough to keep the cells from lysing. Physiological solutions also contain divalent cations. Would these form a counter ion cloud to shield the bacterium from the immune cell?
- Would viscosity inducing small and large molecules keep the bacterium or cancer cell from electrostatically interacting with the immune cell?
- Electrical permeability. Many biological molecules have dipole moments such they line up between the bacterium/cancer cell and the immune cell.
Many scientists are convinced that charge is important. Looking at the literature, it is complicated on the level of a whole cancer cell or even a much smaller whole bacterium. Let’s go back to the mention of the folic acid receptor by Dr Shi. [1]. If Cu+ can make it’s way to the active site of this transporter, surely this is where charge is important on cancer cells.
Folic acid receptor aside
Indeed, the human folic acid receptor alpha, FRα, is expressed in a wide variety of tumor cells that need more folic acid for the synthesis of nucleotide involved in rapid cell division. [4] The group that solved this crystal structure stated that The folate pteroate moiety is buried inside the receptor, whereas its glutamate moiety is solvent-exposed and sticks out of the pocket entrance, allowing it to be conjugated to drugs without adversely affecting FRα binding. [4] This might be where the Shi laboratory was coming from when they stated that tumor cells develop a negative charge because they have increased ability to bind their cancer targeting positively charged group conjugted Fe3O4@Cu2-xS nano particles. [1]
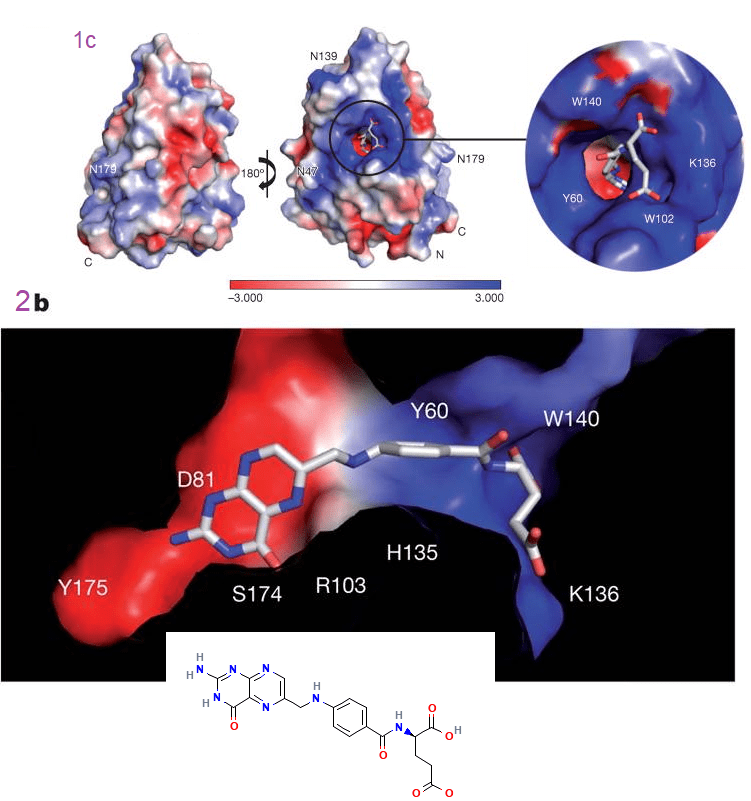
Image of the FRα color coded by charge. Red is negative; blue is positive. These charges electrostatically attract the charged groups on the D-folic acid molecule. [3] This post may leave the reader “head scratching” as to the importance of overall surface charge on cancer cells. The Shi [1,2] and Kotynsa [3] laboratories used isolated cells. Real cancer cells, as both groups admitted, live in crowded, acidic tumors. The Shi Lab was also concentrating their efforts on isolating these cancer cells that had escaped the tumors.
References
- Deng Z, Lin J, Bud’ko SL, Webster B, Kalin TV, Kalinichenko VV, Shi D. Dual Targeting with Cell Surface Electrical Charge and Folic Acid via Superparamagnetic Fe3O4@Cu2-xS for Photothermal Cancer Cell Killing. Cancers (Basel). 2021 Oct 21;13(21):5275. PMC free article
- Shi D. (2017) Cancer cell surface negative charges: A bio-physical manifestation of the warburg effect. Nano LIFE. 2017;7:1771001.
- Naumowicz M, Kusaczuk M, Zając M, Gál M, Kotyńska J. Monitoring of the Surface Charge Density Changes of Human Glioblastoma Cell Membranes upon Cinnamic and Ferulic Acids Treatment. Int J Mol Sci. 2020 Sep 22;21(18):6972. PMC free article
- Chen C, Ke J, Zhou XE, Yi W, Brunzelle JS, Li J, Yong EL, Xu HE, Melcher K. Structural basis for molecular recognition of folic acid by folate receptors. Nature. 2013 Aug 22;500(7463):486-9. PMC free article
-
Copper and rat skin
This post examines the rat experiments in this paper that seems to have made a CopperTwo version of CopperOne and is claiming that CopperTwo has skin healing properties. The first two posts in this series summarizes the production protocol and chemical characterization followed by some fibroblast and endothelial cell culture studies. The rat studies might have been meant to “bring home the gold.” Sadly, much of the histology has not been quantitated. The readers are left to decide for themselves if the changes are meaningful. The purpose of this post is to allow those with financial interest in CopperOne for wound treatment if these CopperTwo results are enough to warrant further pursuit.
Wang TL, Zhou ZF, Liu JF, Hou XD, Zhou Z, Dai YL, Hou ZY, Chen F, Zheng LP. Donut-like MOFs of copper/nicotinic acid and composite hydrogels with superior bioactivity for rh-bFGF delivering and skin wound healing. J Nanobiotechnology. 2021 Sep 9;19(1):275. PMC free article
Full‑thickness skin defect model and treatment
Female Sprague-Dawley rats were subjected to surgical incision after shaving hind skin of fur and other measured to minimize pain and infection. Two full thickness incision wounds (10 mm × 10 mm) were made on both sides of each rat. The defects were covered with GelMA 5% CuNA@GelMA and 5% CuNA-bFGF@GelMA and fixed with 2M medical tape. Wounds treated with only medical tape served as the negative control. Rats were euthanized on days 3, 7 and 14. The wound and normal
adjacent skin were excised and then fixed in 4% paraformaldehyde.
Wound closure measurementThe wounds were photographed with a digital camera after 3, 5, 7, 11 and 14 days and the wound area was measured by ImageJ software. The percentage of wound closure was defined as:
Wound closure(%) = (1 − P/I) × 100,where I is the initial wound area and P is the wound area at a given time point. Each treatment group had three samples.
7. Histological evaluationMost evaluations were performed using commercial kits and self-explanatory antibodies. . To identify elastic fibers, Weigert’s elastic staining was used to stain the sections. Histological analysis of wounds was performed on day 3, 7, and 14 to evaluate the impact of CuNA-bFGF@GelMA on wound healing. H&E and Masson’s trichrome staining was conducted after 3, 7 and 14 days after treatment. H&E stains nuclei purple, collagen shades of pink, and other cellular materials shades in between.
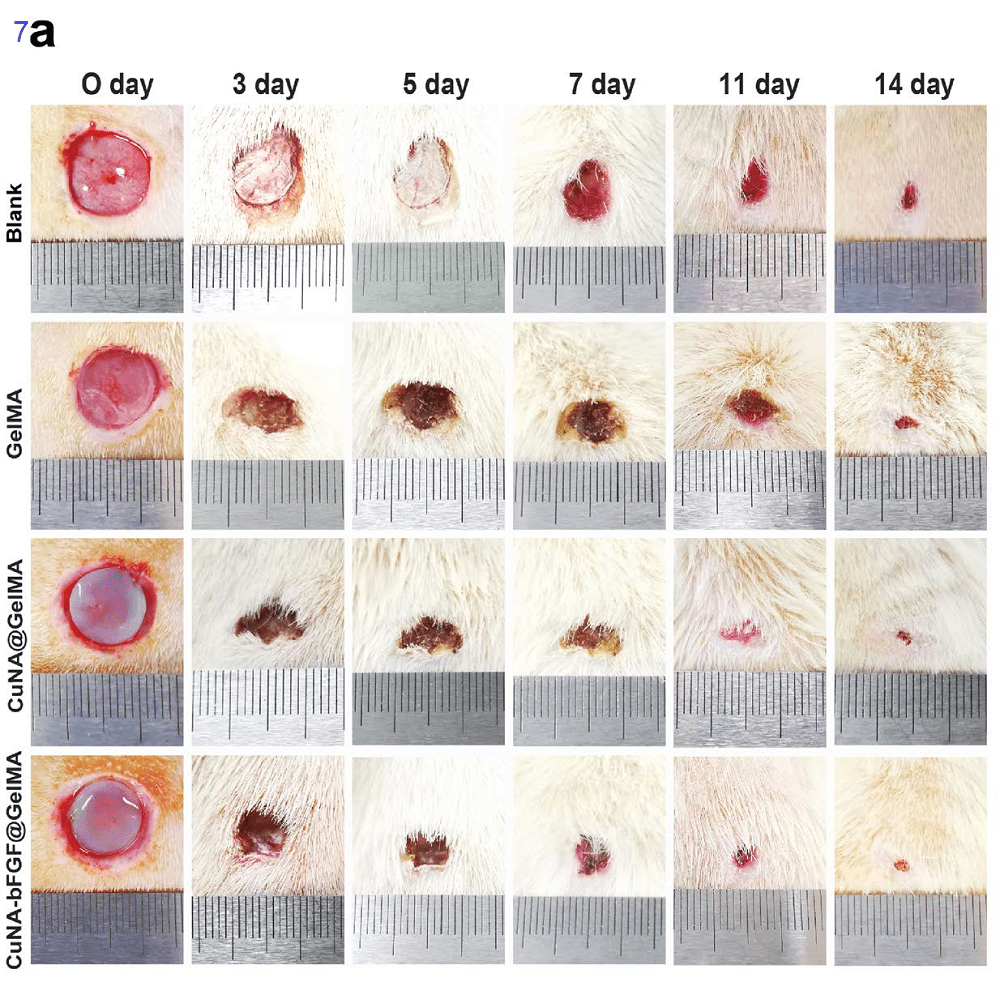
Fig. 7 Wound closure and H&E staining (a) Digital images of full‑thickness skin defects of SD rats treated with the GelMA, CuNA@GelMA and
CuNA‑bFGF@GelMA on day 0, 3, 5, 7, 11 and 14.- 7a All wounds shrank during each time period; however, the wounds treated with CuNA@GelMA and CuNA-bFGF@ GelMA shrank more. CuNA-bFGF proved to be particularly effective in promoting wound closure. The authors claimed a synergistic effect of copper and bFGF.
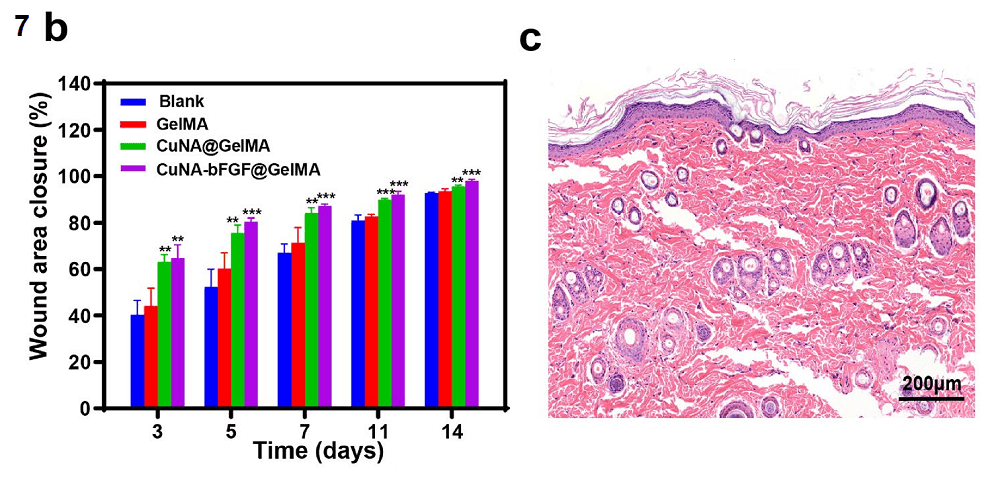
- 7b Data are expressed as mean±SD (n=3). (*p < 0.05, **<0.01, **<0.001 compared to the blank) The biggest improvement appears to be in the first three days.
- 7c Normal tissue stained with H&E. Note the blood vessels and regular epithelium.

7d, H&E staining reveals that CuNAbFGF@GelMA treatment results in skin closest to normal skin. The control and GelMA skin samples show basic epithelium and groups form the basic structure of epithelium and dermis but lack hair follicles, regular epithelium, new blood vessels, and the milder inflammation found in the CuNA and CuNAbFGF@GelMA treated skin responses. Especially the H&E staining of the group is closer to the normal tissue
8 Inflammation,epithelia, and blood vessels
This figure introduces two proteins of interest in wound healing. Interleukin 6, IL-6, is a pro inflammatory cytokine that may be produced by blood vessel smooth muscle cells. Ki-67 is a nuclear protein associated with cell proliferation. CD-31, aka pecam1, is in simple terms a marker of angiogenesis. In their cell culture experiments, these authors examined non muscle actin in endothelial cells and fibroblasts. α- Smooth muscle actin in this case is used as a marker of new blood vessel formation.
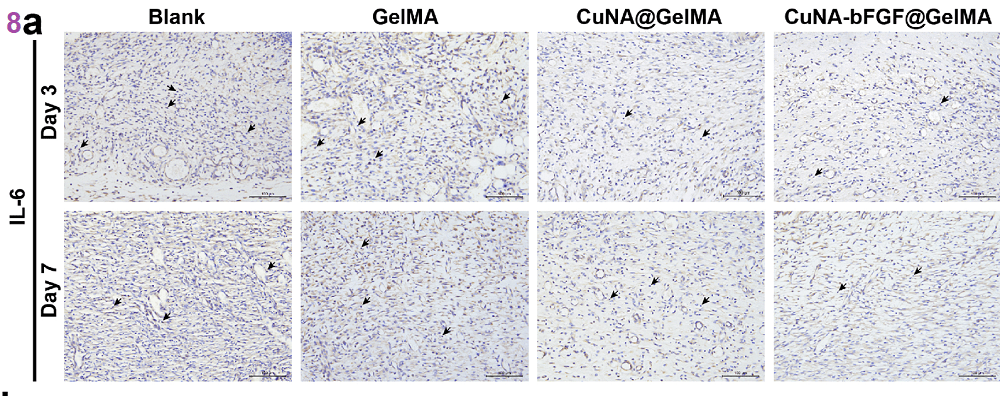
8a The blank and @GelMA show more IL-6 than the CuNA and NuNA&bFGF embedded in the @GelMA matrix. On day 3. In this case the small, brown, blobs seem to be the regions of positive IL-6 staining.
8b Ki-67 positive nuclei represent the re-epithelial-ization process. Figure 8b shows that a small number of Ki-67. CuNA-bFGF@GelMA group exhibits the highest level among all the groups.

8c CD31 (red) and α- smooth muscle actin (green) and nuclei (blue) While actin is a “house keeping†protein expressed in large amounts of most every tissue, the smooth muscle cells of blood vessels express a different isoform than fibroblasts and endothelial cells.
Readers are left to decide for themselves as to whether or not the changes in figure 8 are consequential because no numbers are given.
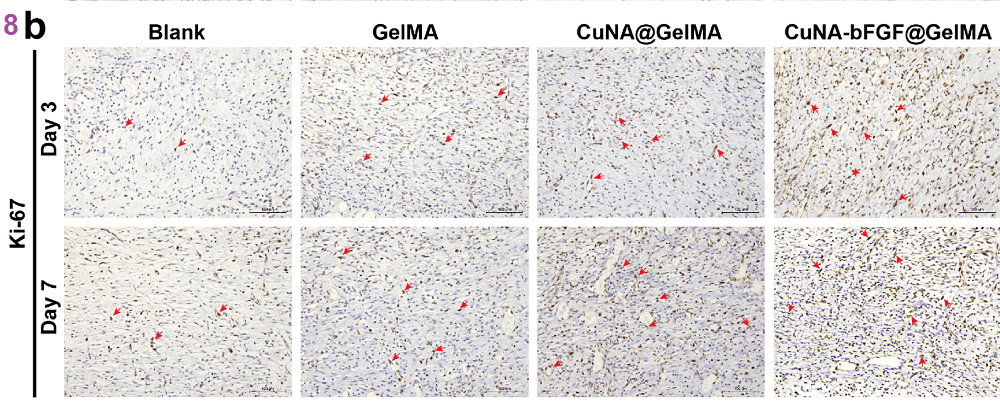
9. Collagen deposition
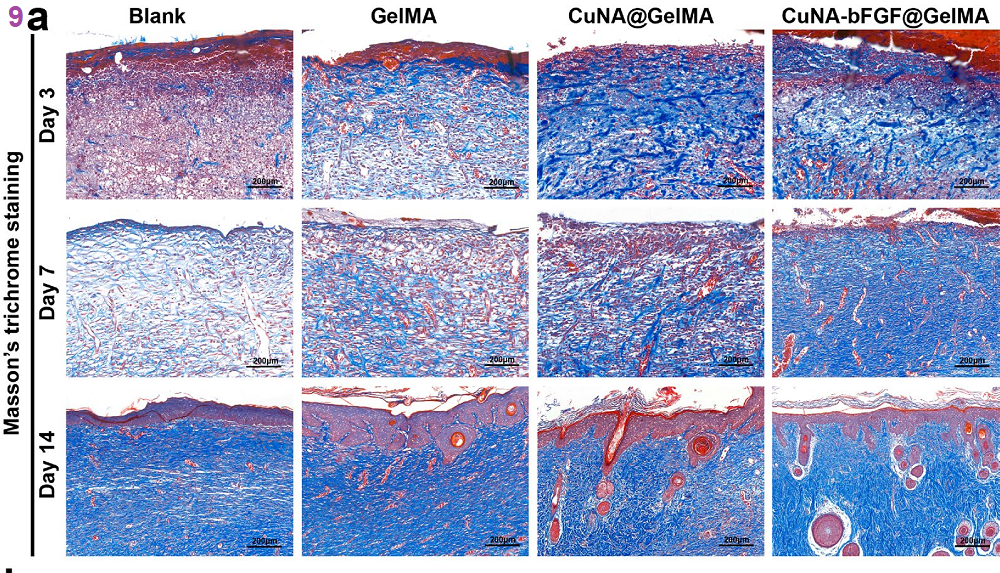
Fig. 9 Masson’s trichrome staining and Weigert’s elastic staining (a) Masson’s trichrome staining was performed on day 3, 7, and 14. 9a The authors were interested in a report that collagen formation is due to the massive proliferation of fibroblasts. Collagen deposition was examined in the wound regions using Masson’s trichrome staining which demonstrated much more collagen deposition in the CuNA-bFGF@GelMA treated skin. Masson’s trichrome stains as follows: red keratin and muscle fibers, blue or green collagen and bone, light red or pink cytoplasm, and dark brown to black cell nuclei.
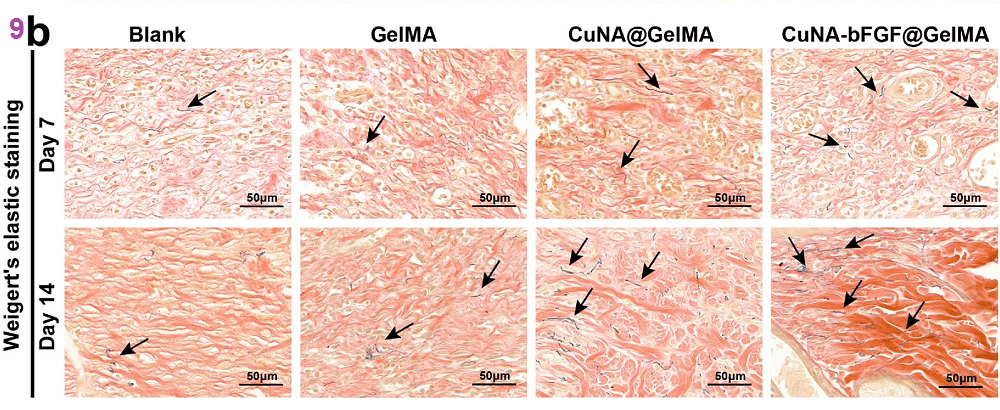
Fig. 9b Weigert’selastic staining on day 7 and 14. (elastic fibers, black arrow) 9b Weigert’s elastic staining was performed on day 7 and 14. The CuNA-bFGF@GelMA treatments
-
Anti-bacterial skin cream
This post is a continuation of a previous post documenting the production of an oxidized form of Cu(I)NA2. The results show promise that Cu + nicotinic acid can promote angiogenesis in a cell culture model, especially if basic fibroblast growth factor (bFGF) is added. We think Cu(I)NA2 will work even better than Cu(II)NA.
One of our associates Jefro’s Botanicals, sells skin healing creams that seem to have anti-bacterial properties. This post goes through some of the tests that Wang and co-workers performed showing fibroblast sparing and anti-bacterial properties of cupric nicotinic acid hydrogels.
Wang TL, Zhou ZF, Liu JF, Hou XD, Zhou Z, Dai YL, Hou ZY, Chen F, Zheng LP. Donut-like MOFs of copper/nicotinic acid and composite hydrogels with superior bioactivity for rh-bFGF delivering and skin wound healing. J Nanobiotechnology. 2021 Sep 9;19(1):275. PMC free article
Wang 2021 are claiming that their oxidized version of Cu(I)NA2 is the goto treatment for wounds. In figures 4 and 5 they claim that it kills two species of bacteria but not a very common fibroblast cell line, NIH 3T3. In Figure 6 that demonstrate promise of angiogenesis to aid in wound healing. This post looks at the methods and the results in hopes that separating these data from the rest of the 21 page publication makes it easier for lay readers to understand.
Killing Bacteria
Wang and coauthors used a representative Gram-negative bacteria, Escherichia coli (E. coli, ATCC8739), and a representative Gram-positive bacteria, Staphylococcus aureus (S. aureus, ATCC 6538). They used an agar diffusion disk and MTT methods.
The MTT assay
measures NAD(P)H reducing equivalents using a compound that changes color when reduced by NADH. CuNA powder was diluted with a common growth medium, LB, into different concentrations. A 1.0×10⁶ colony forming units CFU/mL suspension was obtained after mixing with the bacterial suspension. This concentration of bacteria makes for a very clear solution. After 16 h of incubation at 37 °C, MTT stock solution was added to LB mediums mentioned above, and the mixtures were incubated at 37 °C for 4 h. Then the formazan crystals were dissolved with DMSO at room temperature, and the OD (optical density) was measured at 570 nm using a spectrophotometer (Evolution UV201, Thermo Fisher Scientific, USA). Sometimes the OD at 600 nm is used to measure light scattering by bacteria and they grow and make the medium cloudy. In this sense, the Wang paper might contain a typo that the reviewers missed.
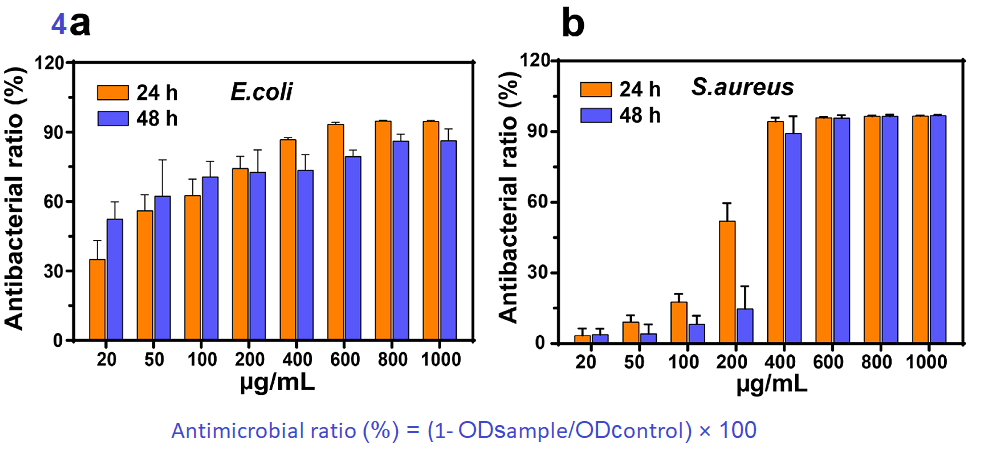
Even after 48 hours, the 400-1000 μg/ml keeps down 90% of the bacterial growth of both representative species. Staph aureus seems pretty resistant to lower concentrations.
In agar disc-diffusion method,
GelMA composites (10 mm in diameter and 2 mm in height) were prepared and
UV-sterilized as described above. Pure GelMA was used as the positive control. The suspension of E. coli and S. aureus were inoculated with sterile pipette tips on LB
agar plates respectively and incubated at 37 °C for 24 h. The inhibition zones of all samples were measured and results were photographed and measured.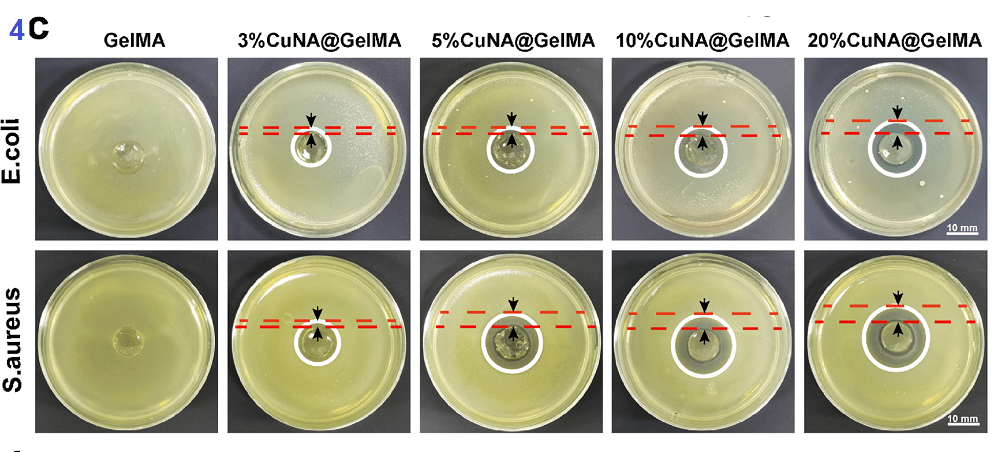
The white circles were drawn around the clear zone of bacteria killing. The red, dashed lines are drawn at the edges of the paper disks soaked in compound and the clear zones. Panels 4d-e put numbers to the representative images shown in Panel 4c.

Data are expressed as mean±SD (n=3). (*p < 0.05, **<0.01, **<0.001 compared to the 3% CuNA@GelMA) There is a more pronounced dose/response effect with E coli. One the other hand, 3% CuNA@GelMA results in more S aureus killing.
5. Not killing fibroblasts & endothelio cells
Healing wounds involves healing skin cells (fibroblasts) and blood vessel (endothelial) cells. The fibroblast NIH 3T3 and endothelial HUVEC cell lines were obtained from a Chinese cell culture bank. The cells were cultured in a standard medium, DMEM medium, that contains salts, buffering agents, and basic vitamins and so on. Growth factors were supplied by adding 10% fetal bovine serum. Bacteria growth was controlled with 1% penicillin-streptomycin. Cells were grown in a CO2 incubator with 5% level at 37 °C. Like our blood, the pH is buffered to pH 7.4 ish by the CO2/bicarbonate equilibrium. Samples including GelMA, CuNA@GelMA, and CuNA-bFGF@GelMA were “sterilized” for two hours in 75% ethanol and then rinsed three times in sterile posphate buffered saline.Cell toxicity and growth
Two types of cells were seeded in 12-well plates with a density of 1×10⁴/well and cultured in the complete medium with different @GelMA formulations. It is assumed that all of the @GelNA compounds are added at 5% weight % to mimic a cream. Cell toxicity was determined using a commercial “Live/dead kit”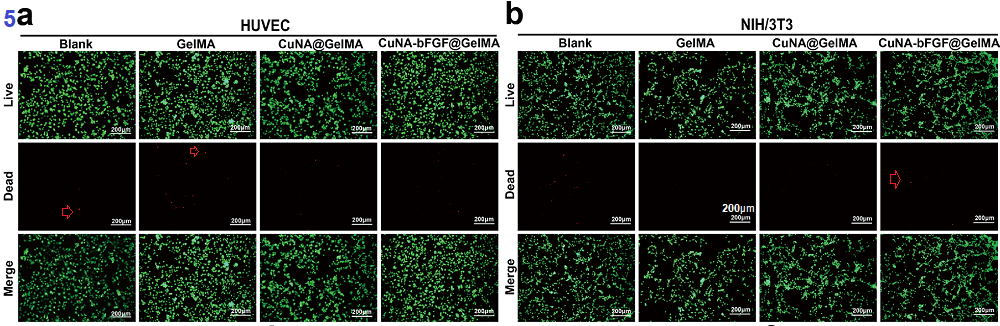
Fig. 5 Biocompatibility evaluation of HUVEC and NIH/3T3 cells cultured in ionic extraction from 5% wt GelMA composite hydrogels (a, b) Live/
dead staining of HUVEC and NIH/3T3 cells cultured in the complete medium with different ionic extraction for 24 h. In the live/dead assay live cells are stained green and dead cells red. Arrows pointing to the dead cells have been added.
Cell viability was further assessed by a CCK-8 method, which is rlated to the MTT assay for viability in that it measures the level of NAD(P)H. For the proliferation test, the two types of cells were seeded at an initial density of 5×10³ cells/well in 96-well plates with ionic extraction at 37 °C in a CO2 incubator with 5% level. On day 1, 3, 5 and 7, the CCK-8 method was performed to assess the cell viability. The cell viability was determined according to the equation:Cell viability(%) = (ODs/ODc) × 100
where ODs, ODc indicate the absorbance of samplesand control group respectively.
Fig. 5 Biocompatibility evaluation of HUVEC and NIH/3T3 cells cultured in ionic extraction from 5% wt GelMA composite hydrogels HUMEC and (c) NIH3T3 andNIH/3T3 cells (d) was determined by CCK‑8 method after cultured with different ionic extraction for 24 and 48 h. Cell proliferation assay for HUVECe) and NIH/3T3 cells (f) after cultured with different ionic extraction for 1, 3, 5, 7 days. Scale bar is 200 μm. Data are expressed as mean±SD (n=3).(*p < 0.05, **<0.01, **<0.001 compared to the blank) Cell migration into clear zones is a key aspect of wound healing. The interested read may learn more about it in an online article of the forces behind cell migration.
6. Migration and tubule formation
Before going on to animal skin injury studies the authors wanted to demonstrate that their compound, that closely resembles our compound, can promote a cell culture version of angiogenesis. Images have been added to the figures to make them easier to understand.

ig. 6 Cell attachment and spreading behavior, migration and tubule formation activities Cellular merged fluorescent images of HUVEC (a) and
NIH/3T3 cells (b) on GelMA, CuNA@GelMA and CuNA‑bFGF@GelMA hydrogels after 2 days post‑seeding. F‑actin (red), vinculin (green), nuclei (blue).A transwell assay was performed to evaluate the migration ability of HUVEC and NIH/3T3 in the @GelMA formulations. The fibrolasts (skin) and endothelial (blood vessel) cells were diluted with serum-free medium to 1.0×10⁵ cells/mL, then added in the upper chamber of a 24-well transwell plate and @GelMA formulations to the lower chamber. As a control, complete medium was added to the lower chamber. After incubation at 37 °C for 24 h, cells on the upper chamber were scraped off using a dry cotton swab. Cells migrated to the lower surface were washed with PBS, fixed, and stained with crystal violet. The migrated cells were imaged with a microscope.
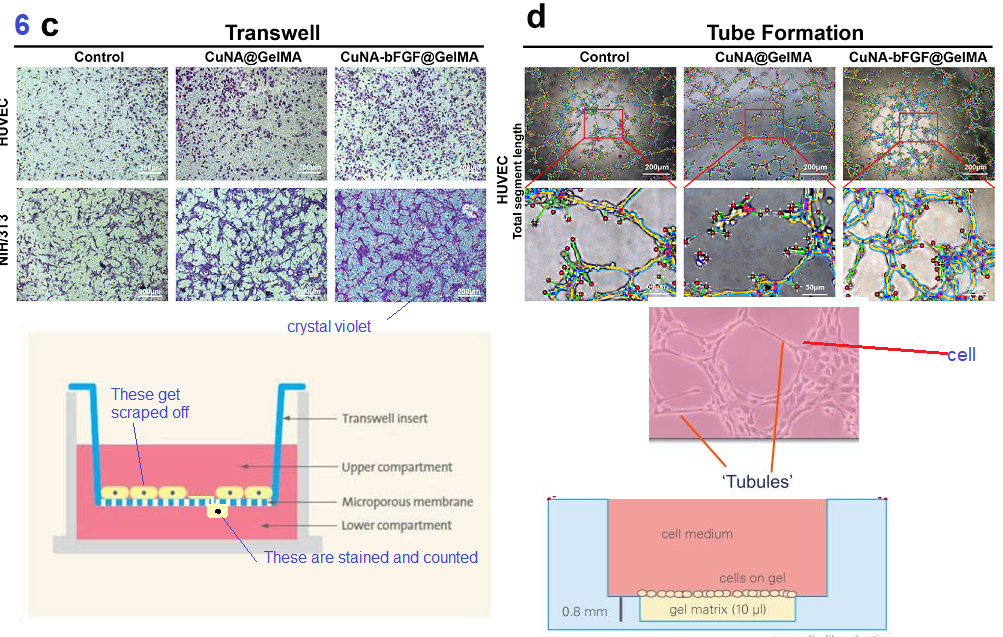
Fig. 6 Cell attachment and spreading behavior, migration and tubule formation activities c The migration evaluation of different ionic extraction on HUVEC and NIH/3T3 cells after incubation for 24 h by the transwell method. d The tube formation of HUVEC on matrigel after incubation with ionic extraction for 4 h. The migration number of HUVEC. Images below the lettered panels were added to make the published data easier to understand. HUVEC endothelial cells were plated on Matrigel, a collagen rich basement membrane substance. Different @GelMA formulations were evaluated by seeding cells on the Matrigel matrix. Briefly, the matrix was added to 96-well plate wells and solidified before adding the HUVEC endothelial cells and incubated for just 4 hours. The total segment length was measured by ImageJ with the Angiogenesis Analyzer plugin to assess the tubule formation ability.
Tubules are considered a precursor of angiogenesis, new blood vessel formation. The lay reader may access the source of the image to go with Panel 6d at Slide Share, slide 15 of 23.
Attaching numbers to exciting images
So far we’ve seen some convincing cell culture images that oxidized Cu(II)NA can promote fibroblast and endothelial cell migration as well as this pre angiogenesis tubule formation. Let’s see some graphs of numbers.
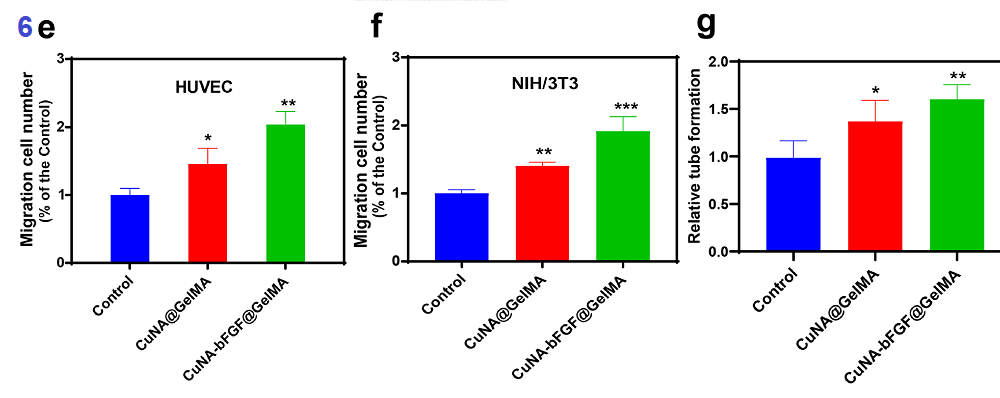
Fig. 6 Cell attachment and spreading behavior, migration and tubule formation activities Cellular merged fluorescent images of HUVEC (The migration number of HUVEC (e) and NIH/3T3 cells (f) compared to the control group. g The relative tube formation of HUVEC cultured in different ionic extraction. Data are expressed as mean±SD (n=3). (*p < 0.05, **<0.01, **<0.001 compared to the control) If Cu(II)NA promotes angiogenesis and wound healing in a cell culture model by itself and even better in combination with basic fibroblast growth factor… then Cu(I)NA2 will too! The next post will examine animal studies.
-

Cuproptosis part 2
This post is a continuation of a previous post covering a hot paper saying that Cu binding to DLAD, a pyruvate dehydrogenase complex enzyme, causes a regulated form of cell death. The Chinese are very interested in exploiting this “regulated cell death” to treat renal cancers. They explored U.S.renal cancer databases to determine if these cuproptosis proteins correlate with renal cancer prognosis. They found that these cuproptosis proteins are associated with favorable prognoses. Each time a protein is mentioned that has something to do with Cu(II), pyruvate, or lipoic acid, a ⶠwill appear in the text.
Renal cancer databases mined
- The first study came out of Zhejiang University in China. These authors were interested in clear cell renal cell carcinoma. [1] They mined a U.S. database (https://portal.gdc.cancer.gov//, accessed on 15 March 2022). A total of 524 ccRCC patients and 72 adjunct non tumor samples.
- The second study came from Changzhi, China. These investigators mined these databases: GEO (GSE12606, GSE53000, and GSE53757) and the TCGA-KIRC dataset. Among them, the GSE12606 dataset contains 3 cancer samples and 3 paired normal samples, the GSE53000 dataset contains 53 cancer samples and 6 normal samples, the GSE53757 dataset contains 72 cancer samples and 72 paired normal samples.
1. A Novel Apoptosis-Related Prognostic Gene Signature and Validation of Differential Expression in Clear Cell Renal Cell Carcinoma
Here we go with the 1st Chinese renal cancer data mining study.
Fig 1 RCC vs normal cuproposis gene expression
This bullet list was copied from the text. It goes along with Panel A of Figure 1. Log2 fold changes were converted to simple fold changes at this site. Log2 =0 is a 1x, or no change. The converted values are in orange. Only CDKN2A transcript, which codes two proteins, went up. The other TCA cycle related transcripts went down.
- CDKN2A (log2(fold change) = 2.12, p = 1.50 × 10−155) 4.3x
- â¶DLAT (log2(fold change) = −0.73, p = 5.12 × 10⁻²⁶) 0.503x
- DLD (log2 (fold change) = −0.97, p = 5.99 × 10−47), 0.51x
- FDX1 (log2 (fold change) = −1.07, p = 9.21 × 10−54), 0.476
- GLS (log2 (fold change) = −0.94, p = 2.85 × 10⁻²²), 0.521
- PDHA1(log2 (fold change) = −1.14, p = 7.17 × 10⁻³²) 0.454
- PDHB(log2 (fold change) = −1.12, p = 2.59 × 10−46) 0.460
The emerging story is that it is bad to to lose some of these pyruvate metabolism related gene transcripts.
Bian 2022 Figure 2 is not being presented in this post. The biological processes of the 10 CRGs mainly involved in the GO analysis and KEGG analysis were related to aerobic production of ATP. This included Fe-S centers of the mitochondria to lipoic acid related genes.[1]
Figure 3 Survival curves
Bian and coworkers used a lot of fancy techniques to examine survival with renal cell carcinoma with over the course of months. They also looked at progression free survival. Patients who had high expression of these cuproptosis gene transcripts survived longer. For lay readers, each time there is a step down going from left to right, someone(s) dies.

from Bian 2022 [1] ⶠNote the presence of DLAT and lipoic enzyme LIAS, lipoyl synthase These cuproptosis genes are associated with regulated cell death, yet these patients are living longer when they produce transcripts that code for pathways leading to the TCA cycle. Would lipoic acid be good to add with cuprous nicotinic acid or cuprous pyruvate?
Bian Figure 4 examined the multivariate analysis factors involved in overall survival and progression free survival. CDKN2A, FDX1, â¶DLAT, age, and gender were important predictors of the former while CDKN2A, FDX1, â¶LIAS, age, and gender were important predictors of the latter. [1]
Fig. 5 Two different datasets, the same answer
Blue is normal red is the tumor. Recall that â¶DLAT is Pyruvate dehydrogenase (acetyl-transferring)] kinase isozyme 3. This is the same enzyme that might be aggregated by the Cu when it is reduced by mitochondrial ferriredoxin FDX1. See previous post . Note that these “death” proteins are associated with health.

Bian 2022 Figure 5 Bian Figure 6 explored whether the cancer related genes correlated with immune cell recruitment to the tumor. It is uncertain whether CRGs would influence immune cell recruitment in the tumorCDKN2A, DLAT, FDX1 and LIAS were the gene transcripts examined.
CDKN2A â¶DLAT FDX1 â¶LIAS CD8+ T cell ↑ p = 2.89 × 10⁻² Macrophage ↓ p = 2.89 × 10⁻² ↑ p = 2.93 × 10⁻¹³ ↑1.73 × 10⁻² ↑ p = 1.12 × 10⁻⁵ neutrophil ↑ p = 1.89 × 10⁻⁶ ↑ p = 1.15 × 10⁻³ B cell ↑p=1.40 × 10⁻⁶ ↑ p = 2.33 × 10⁻³ Dendritic cells ↑ p = 1.02 × 10⁻⁴ data extracted from text associated with Bain 2022 Figure 6. [1] Up and down arrows indicate whether the transcripts are associated with a decrease or increase of a particular immune cell. What we really do not now is what sorts of small molecules are in the tumor micro environment that might be recruiting immune cells and/or inactivating them. A general hunch is that reliance on the TCA cycle and an active electron transport chain is crucial to prevent generation of lactic acid that will do things to immune cells that is beyond the scope of this post to discuss.
Fig 8 Less expression means more disease

CCRC, clear cell renal carcinoma. This post will not examine the difference between pathologic stage and the histological grade. CDKN2A is a protein involved in cell cycle regulation that seems less important than ⶠDLD, DLAT, and LIAS that are involved in getting pyruvate into the TCA cycle.
2. Molecular Subtyping Based on Cuproptosis-Related Genes and Characterization of Tumor Micro environment Infiltration in Kidney Renal Clear Cell Carcinoma
Ji and coworkers started their clear cell renal carcinoma (CCRC) database mining with the 12 cuproptosis proteins â¶. They did their comparison with adjacent normal tissue. 1C is kind of tricky to look at because the normal and tumor tissue transcripts are connected by a black line…. all stacked together. 1B gives the ability of the reductase FDX1 to predict cancer. 1D is another survival curve. Recall that â¶SLC31A1 is the Cu+ transporter Crt1.
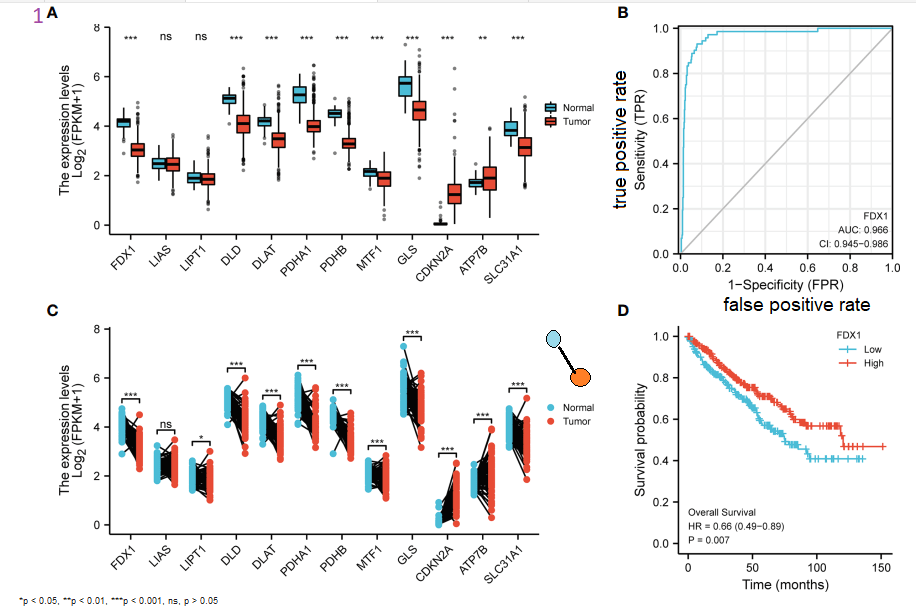
Panel 1C is an interesting way to present tumor and adjacent normal gene transcripts from the same patient. With the Cu+ exporter ATP7B, sometimes there is more in the tumor, sometimes less. With ⶠCtr1 (SLC31A1) it sort of looks like there is a decrease in tumors (red) compared with adjacent normal (blue). The authors claim that all of these differences are significant. Panel 1D is a survival curve. Downward dips with time mean patients dying. High FDX1 producers are less likely to die. [2]
Ji Figure 2, outcomes based on cuproptosis proteins…
Ji 2022 attempted to break CCRC into different categories based on cuproptosis gene expression. Each row in panel 2D represents one of the 12 cuproptosis genes. Group 3, G3, is composed of patients with high levels of some of the cuproptosis genes (2D. below orange bar, red lines) In panel 2E we see that these high expressing individuals are not dropping off the survival curve (2E) as fast.
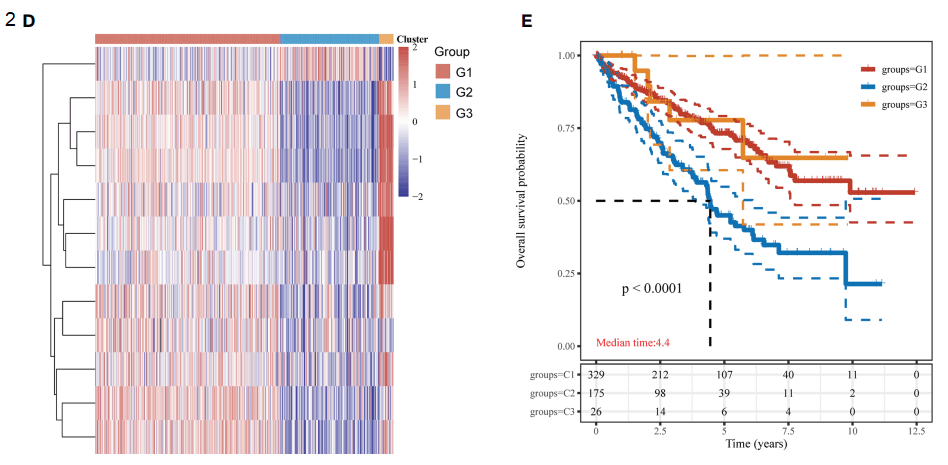
The identities of these rows was searched for in the supplemental data, but not found.
Ji Figure 3, immune cell recruitment
The investigators were able to estimate the immune cells present in the tumors based n the unique gene transcripts found in these cells.

The aspect of this interesting figure that prevents us at CopperOne from taking this too seriously is that we have no tumor microenvironment info and what role Warburg effect and the lactic acid that comes with it might have on the immune cell infiltration. Does more Ctr1 allow for more Cu+ transport and reliance on the electron transport chain?
Figure 4 of the Ji 2022 publication compared the sensitivity of the three groups to various chemotherapy agents. It was difficult to determine just how these data were curated. The data are avaible in reference [2]. Trying to correlate the mechanism of these treatments to the cuproptosis genes is beyond the scope of this post.
Ji Figure 5 cancer immunosuppression and escape from it
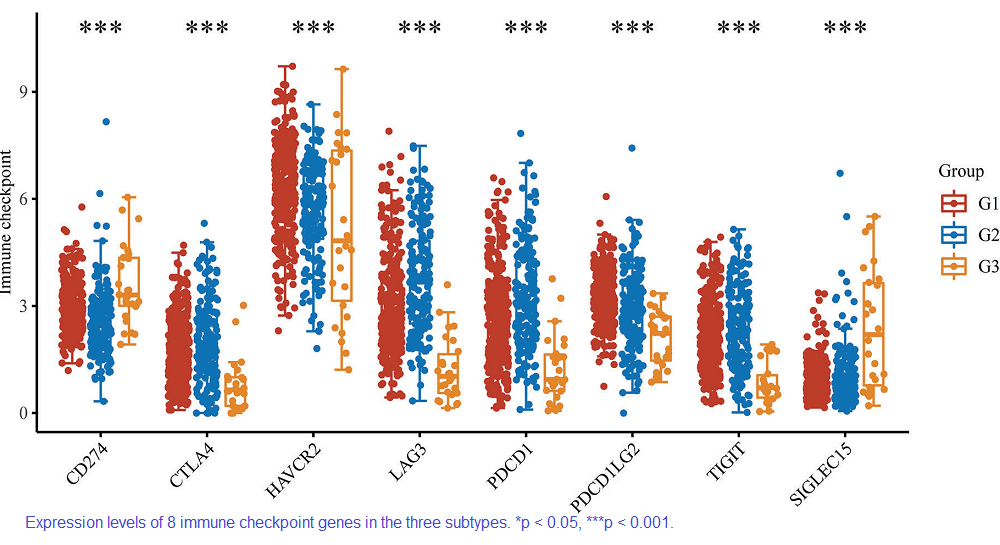
CD274 is the gene that codes for tumor produced, CD8+ T cell inhibiting PD-L1. CTL4 is the cytotoxic, CD8+ T lymphocyte associated protein 4. HAVCR2 is also known as Tim3. We’ve covered the copper connection with PD-1/PD-L1 and Tim3 on this site. LAG3 is lymphocyte activating gene 3 that maintains lymphocytes in a non -proliferative state. PDCD1 is the programmed death protein 1 PD-1. PDCDILG2 is also known as PD-2. TIGIT is expressed in natural killer (NK) cells and some T cells. It’s blockage with antibodies is being explored as a cancer immunotherapy. SIGLEC15 appears to have a role in cancer immune regulation and may be a target of immunotherapy to treat cancer. Note that G3 with the more profound cuproptosis gene signature is sometimes associated with more bad immuno suppression genes like PD-L1/CD274 and SIFLEC15 but in general is associated with less, all of the others….It is disappointing that we don’t know how the expression of these 8 genes correlates with ⶠCtr1 or DLAT that binds lipoic acid and processes purvate for the TCA cycle.
Ji Figure 6…on being a normal kidney
Ji Figure 6 examined the concept of differentially expressed genes in clear cell renal carcinoma. The KEGG and GO clusters of genes in related metabolic pathways revealed nothing much revealing. The G1 group had better survival compared to G2, with was the worse. Figure 6 contained a volcano plot. The fold change of a protein transcript is plotted on the X-axis. The -log P value is plotted on the Y axis. NRP3 is atrionatriuretic peptide receptor C peptide receptor 3 is part of the normal functioning of our kidneys. It’s expression in the healthier G1 group is at least 2 log10 units, or 102 = 100x more than the G2 group. Moving on to the Y-axis, its -log10 P value is just shy of 60. Lets call it 50. The -log10 of 50 is 10-50. In terms of p values we can be 99.999…9% percent sure we are not dealing iwth an artifact. We have 49 9s in place of the there … Many of the gene transcripts that drop out in the G1 group are ion and peptide transporters. It as if the G2 CCRCC tumors have stopped being anything that remotely resembles a kidney.
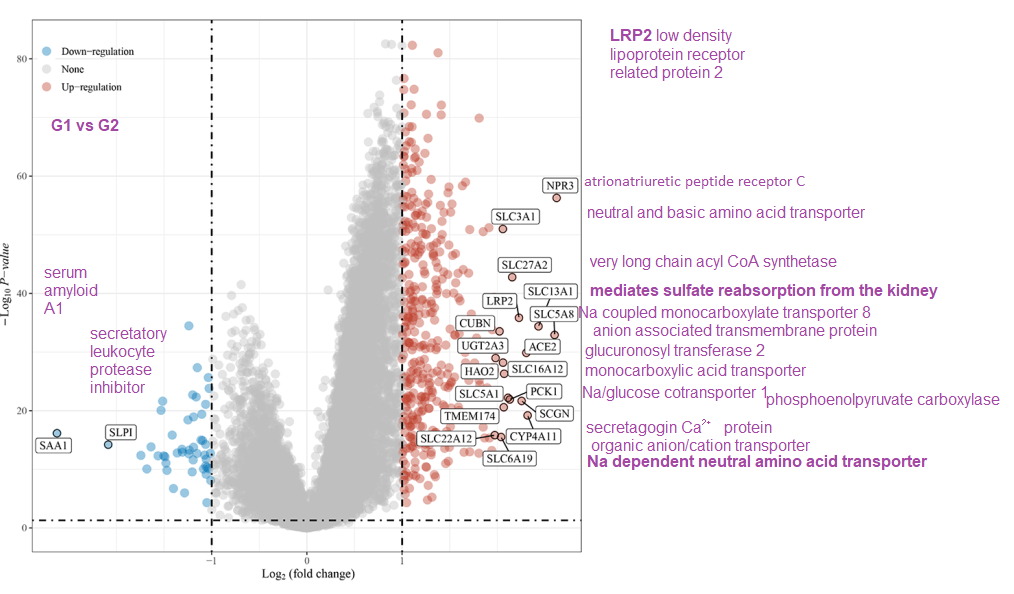
From Ji 2011 Figure 6. Names of many of the genes have been looked up. Vearing away from solute transport, Ji and coworkers focused a lot on immune cell infiltration. What is it about a CCRC not being a normal kidney any more that brings in the immune cells?
Ji Figures 7 and 8, cuproptosis and cancer transcripts
Ji and coauthors used several RCC databases to determine which cuproptosis gene expression correlates with other known cancer related genes. Stars indicate genes that are immune system checkpoints. The names of other genes have been written into their Figure 7. P glycoprotein as a reputation for exporting chemotherapy giving the tumor resistance. Note that aldolase B is a glycolytic enzyme that is only weakly associated with cuproptosis genes. GPAT3, on the other hand, is very much part of the cuproptosis genes that feed into the TCA cycle. Seeing a renal chloride channel tied to the cuproptosis genes suggests a state of maintained differentiation, and less stem cell ness. The renal organic anion transporter does not seem to be as positively correlated with cuproptosis genes.

Figure 7 Ji 2022 [2] Let’s take our SLC31A1 transcript that codes for Ctr1, the Cu+ transporter. When SLC31A1 goes up , the GPAT3 transcript goes up too. The closer the Pearson correlation coefficient is to 1, the more the two transcripts track each other. It is interesting to note that GPAT3 codes for protein involved in triglyceride synthesis. Ji and coworkers took the starred gene transcripts of proteins that control immune response. HMGCS2 is perhaps the most exciting from a metabolic standpoint. This transcript codes for 3-hydroxy-3-methylglutaryl-CoA synthase 2 (mitochondrial).
Ji and coauthors came up with a cancer related gene score. The rationale was not totally clear. It is hard to find good descriptions for all of the proteins that these transcripts code for.
CRG score = ( −0.006 )*ENAM + (−0.1496) *WDR72+ (−0.0583) *CLDN10 +(−0.0019) *HMGCS2+ (−0:217) *CYFIP2 + (−0.0441) *QRFPR,
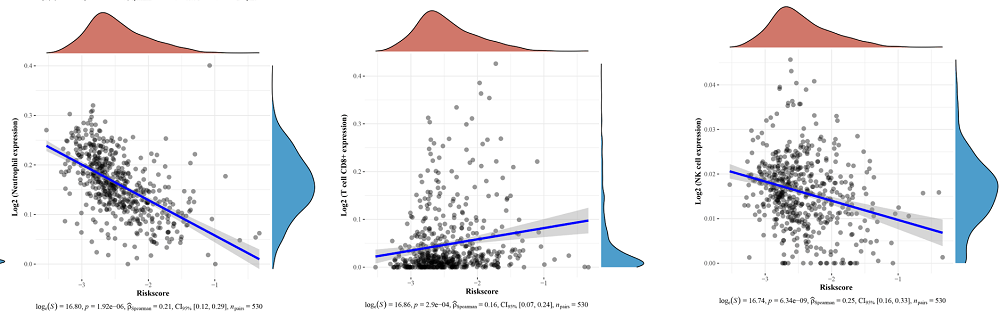
A positive correlation between the CRG score and macrophages, monocytes, CD8+ T cells, and Tregs infiltration. A negative correlation was found between the CRG score and infiltration of neutrophils, NK cells, and nonregulatory CD4+T cells. The Spearman correlation coefficient between the CRG score and neutrophil infiltration was -0.62 CRG score. These plots are but a few examples from Ji 2022 Figure 8.
Does cuproptosis healthy dying require prior healthy living?
It is becoming hard to reconcile the “cuproptosis” regulated cell death genes being associated with a better prognosis in clear cell renal carcinoma. [1,2] These so called “death” genes are associated with better prognoses and normal living as a functional kidney with the assortment of proteins for reabsorption of filtrates. This post started out as an exploration of cuprous pyruvate as an adjunct cancer therapy. Hone the Cu+ to its DLAT target with pyruvate and let it oligomerize ⶠDLAT in a process called cuproptosis in a previous post . There is talk of taking CopperOne with an oil based carrier to keep it in the +1 oxidation state. Would lipoic acid be something good to add to the mix? Nonetheless, it would be interesting to see how cuprous pyruvate performs in cell based studies.
References
- Bian Z, Fan R, Xie L. A Novel Cuproptosis-Related Prognostic Gene Signature and Validation of Differential Expression in Clear Cell Renal Cell Carcinoma. Genes (Basel). 2022 May 10;13(5):851. PMC free article
- Ji ZH, Ren WZ, Wang HQ, Gao W, Yuan B. Molecular Subtyping Based on Cuproptosis-Related Genes and Characterization of Tumor Microenvironment Infiltration in Kidney Renal Clear Cell Carcinoma. Front Oncol. 2022 Jul 6;12:919083. PMC free article
-
Cuproptosis
Where this post is going…
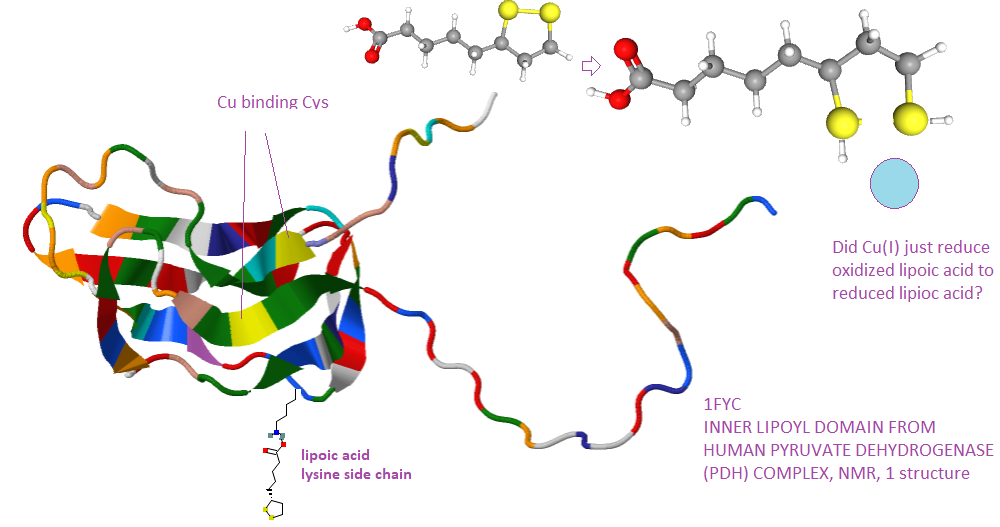
The featured image says it all. A lipoic acid binding component of the pyruvate dehydrogenase complex, DLAT, binds Cu2+ and causes the oligomerization of the DLAT subunit in such a way as to cause “regulated cell death.” There is a lot of controversy and talk as to which enzyme is most important in this new version of RCD.
Regulated cell death… so many means to choose from
It all started with apoptosis, a form of programed cell death. The image below came largely from the public access 2019 Tang review. [1] I would say just skim through this list just enough to realize that the whole concept that death is a red hot regulated event.
- Apoptosis is characterized by the mitochondria self destructing and activation of proteases called caspases. A caspase is like a PacMan chewing up proteins.
- Necroptosis is a “prgrammed” form of inflammatory cell death with the programing part delivered by RIP kinase… of course!
- Lysosomal cell death is when lysosomes, that function as intracellular stomachs, start leaking their cathepsin digestive enzymes.
- Pyroptosis is driven by the IL-1 and so on producing inflammasomes that we’ve discussed on this site. The “pyro” part must come from the fevers that come along with cytokines produced by cytokines like IL-1
- Netotic cell death has been covered on this site: macrophage and their secreted nets that kills pathogens and maybe bystander cells
- Ferroptosis is, in simple terms. unbound iron generating reactive oxygen species. The rust nail is a reminder that iron reacts with oxygen.
- Entosis is when one cell kills another by endocytosis, we are assuming that this is by non immune cells. .
- Immunological cell death is when dying cells are cleared by phagocytosis
- Parthanatos results from excessive activation PARP and loss of ATP and NAD+ PARP can bind to dmaged DNA leading to repair or apoptosis…
- Alkaliptosis is mediated by mediated by intracellular increase in pH or alkalinity.
- Autosis is a lysosome thing when the lysosome intracellular cellular stomach organelles fuse with autoendosomes.
- Oxeiptosis is a novel oxygen radical-induced pathways.
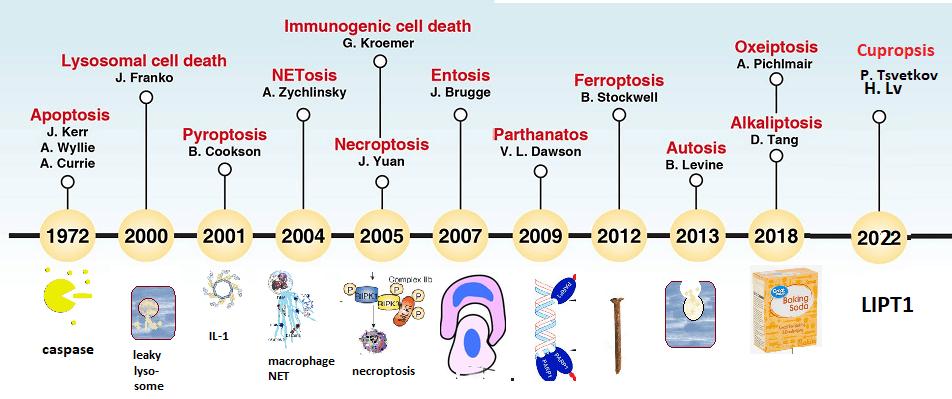
Figure 1 from Tang 2019 with whimsical images added. The Cupropsis time point from Lv 2022 [3] was not in the 2019 review. Probablyl the first report of Cutproptosis belongs to Tsvetkov 2022 [2] Confusing? Of course it is!
This is just the context of our next story about how Cu2+ might contribute to the death of melanoma cells. Sometimes a cell must activate programs because the good of the many cells in an organism outweigh the good of the one.
The discovery, from Boston and Baltimore
Ths studly came out of many prestigious cancer focused institutes in Boston Baltimore. Elesclomol “is a small-molecule bis(thio-hydrazide amide) with oxidative stress induction, pro-apoptotic, and potential antineoplastic activities. Elesclomol induces oxidative stress, creating high levels of reactive oxygen species (ROS), such as hydrogen peroxide, in both cancer cells and normal cells. Because tumor cells have elevated levels of ROS compared to normal cells, the increase in oxidative stress beyond baseline levels elevates ROS beyond sustainable levels, exhausting tumor cell antioxidant capacity, which may result in the induction of the mitochondrial apoptosis pathway. Normal cells are spared because the increase in the level of oxidative stress induced by this agent is below the threshold at which apoptosis is induced” according to PubChem. Elesclomol is evidentially also an ionophore for Cu and other metal ions. The authors were not really indicating the oxidation state of these metals.
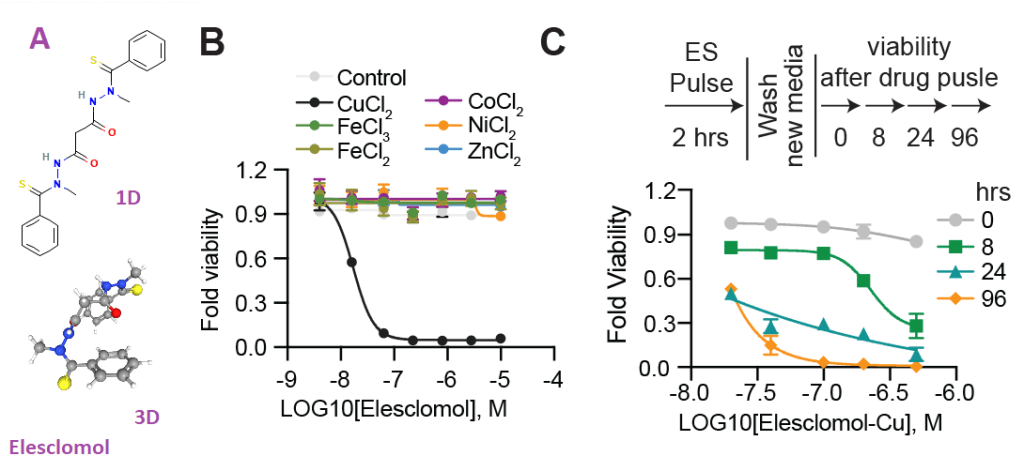
PubChem and A 1D and 3D structures of Elesclomol from PubChem B) Viability of cells (MON) after treatment with elesclomol ± 10μM of indicated metals. (C) Viability of ABC1 cells was assessed at the indicated times after elesclomol-Cu (1:1 ratio) pulse treatment and growth in fresh media. [2] The rest of Tsvetkov Figure 1 concerned programmed cell death pathways we are considering too complicated for this post. Note that while Fe can redox cycle, it is not killing cells when chelated to Elesclomol. Note that this is Cu2+ that appears to be doing the killing.
Tsvetkov and coauthors presented experiments in Figure 2 that led them to conclude that Eleschomol-Cu was not directly targeting the electron transport chain but rather the TCA cycle. These investigators knocke out seven genes they thought might rescue cell killing by elachlomol-Cu2+
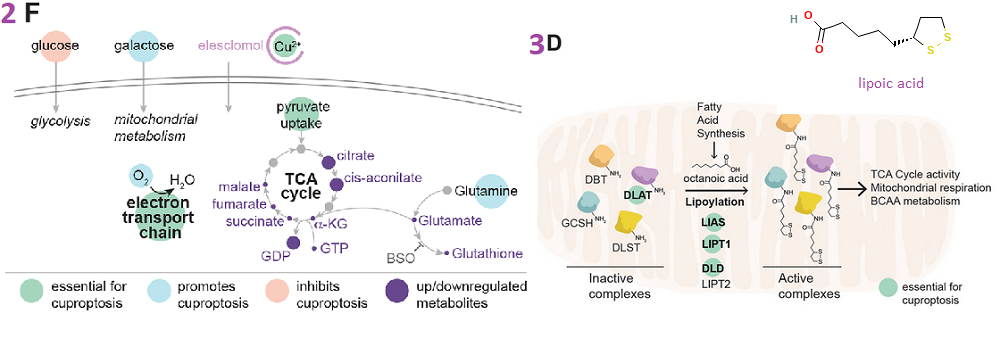
Tsvetkov 2022 more figures (2F) Schematic of metabolites altered following elesclomol treatment of ABC1 cells (purple circles mark metabolites changing abundance(3D) Schematic of the lipoic acid (LA) pathway. Genes that scored in our genetic screens are marked as essential for copper-induced cell death Ï´ essential for cuproptosis These are the suspect enzymes that were knocked out the cell culture system. Ï´ denotes enzymes that are needed for cuproptosis.
- FDX1 (a reductase known to reduce Cu2+ to “its more toxic form, Cu1+ ” Accroding to GenCards FDX1 is a gene that codes for mitochondrial adrenodoxin a small iron-sulfur protein that transfers electrons from NADPH through ferredoxin reductase to mitochondrial cytochrome P450, involved in steroid, vitamin D, and bile acid metabolism
- , LIPT1, Ï´ mitochondrial lipoyl transferase 1 Catalyzes the transfer of the lipoyl group from lipoyl-AMP to the specific lysine residue of lipoyl domains of lipoate-dependent enzymes
- LIAS Ï´ mitochondrial lipoyl synthase This protein has Fe-S centers shown as
- DLD Ï´ D-lactate dehydrogenase R-lactate + 2 Fe(III)-[cytochrome c] = 2 Fe(II)-[cytochrome c] + 2 H+ + pyruvate
- DLAT Ï´ Pyruvate dehydrogenase (acetyl-transferring)] kinase isozyme 3, ATP + L-seryl-[pyruvate dehydrogenase E1 alpha subunit] = ADP + H+ + O-phospho-L-seryl-[pyruvate dehydrogenase E1 alpha subunit
- PDHA1 Pyruvate dehydrogenase E1 component subunit alpha, (R)-N6-lipoyl-L-lysyl-[dihydrolipoyllysine-residue acetyltransferase] + H+ + pyruvate = (R)-N6-(S8-acetyldihydrolipoyl)-L-lysyl-[dihydrolipoyllysine-residue acetyltransferase] + CO2
- PDHB Pyruvate dehydrogenase E1 component subunit beta, R)-N6-lipoyl-L-lysyl-[dihydrolipoyllysine-residue acetyltransferase] + H+ + pyruvate = (R)-N6-(S8-acetyldihydrolipoyl)-L-lysyl-[dihydrolipoyllysine-residue acetyltransferase] + CO2
Figure 4 made the case that FDX1 expression tends to correlate with the abundance of lipoic acid. [1] Cancer cell line data backed this up. Wikipedia authors made the case for lipoic acid being important for TCA function. The case for Cu involvement. The authors used affinity resigns that bind metal ions and whatever proteins might bind those metal ions. To elute the metal ion binding protein, one simply elutes with excess metal ion. Figure 5 continued with some clever microbiology that also suggested Cu induced oligomerization.

(5A) The binding of indicated proteins to copper (Cu), Cobalt (Co) and Nickel (Ni) was assessed by immunoblot analysis of eluted proteins from the indicated metal loaded resins. 
From Figure 6 Tsvetkov 2022 A summary of the working hypothesis SLC31A1 is also known as Ctr1 Note that the working hypothesis has nothing to say about Cu+ chaperone proteins. The elesclomol is a very unnatural way to introduce Cu into the cell in a very unnatural oxidation state. It has further not been verified whether Cu+ or Cu2+ is more reactive with Fe-S centers.
What all of this means
The landmark Tsvetkov cuproptosis paper cites many enzymes in glycine cleavage system (GCS) dual function pathway, one of which is feeding the amino acid glycine into the TCA cycle. The GCS can can also be used for making glycine. The glycine cleavage system, GCS, consists of four enzymes [3]:
- glycine decarboxylase (P protein)
- aminomethyl-transferase (T protein)
- dihydrolipoyl dehydrogenase (L protein)
- and a carrier protein (H protein)
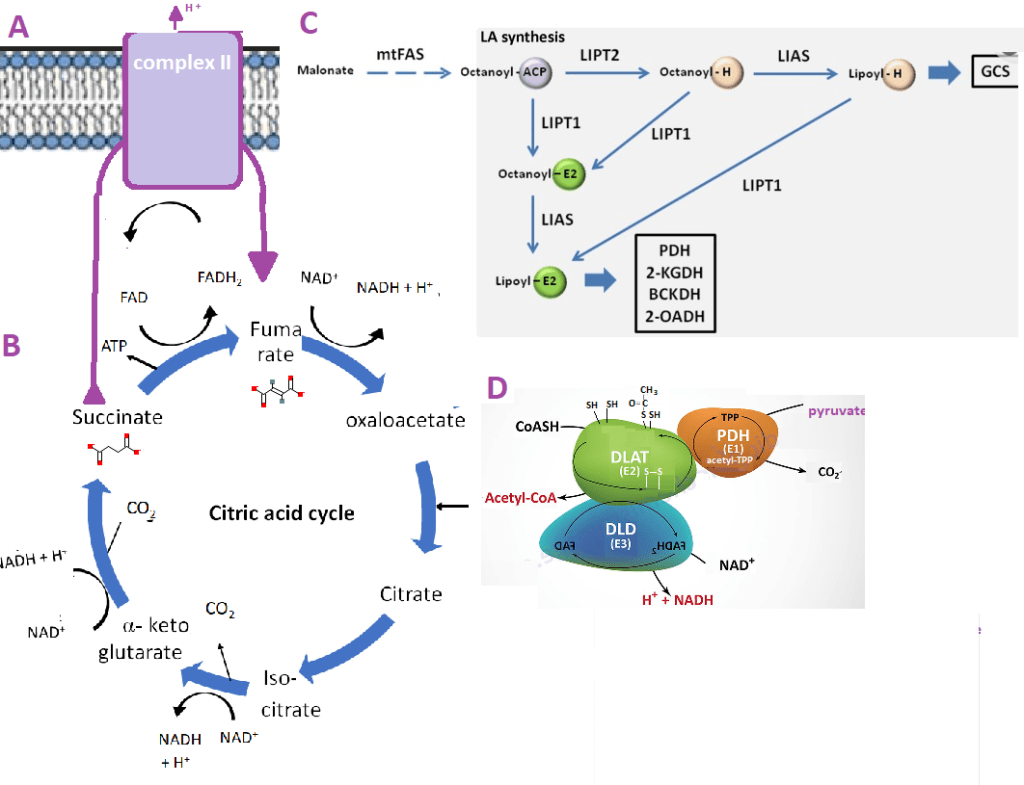
These are some images collected to tie things together A. Complex II of the miochondira all by itself. to illustrate the concept that complex II is part of the TCA cycle and electron transport chain. B. The TCA cycle. Note that succinate loses some hydrogens in going to fumarate. C. Note that many enzymes in this GSCS diagram from Bernardinelli 2017 [3] are also important for cuproptosis [2] D. The PDH image was adapted from this link. According to Tsvetkov 2022, many enzymes in this complicated pathway are important for cuproptosis, but it is DLAT that oligomerizes in response to Cu. [2] In DLAT of panel D there are three forms of lipoic acid (1) two SH groups (2) one SH group and the other bound to an acetyl group (3) an internal (white) S-S form.
Mining melanoma databases for cuproptosis
This is a big data study that probably is not that informative. It came out just a few months after the landmark Click here to proceed to a discussion on DLAT and Cu(I), Haozhen Lv and coauthors conducted a data mining experiment of mRNA transcripts of skin cutaneous melanomas from 470 patients. It is recommended that the impatient lay reader only parse through this section. The take home is that cuproptosis is red hot and poorly thought out. There were some normal controls in here too.
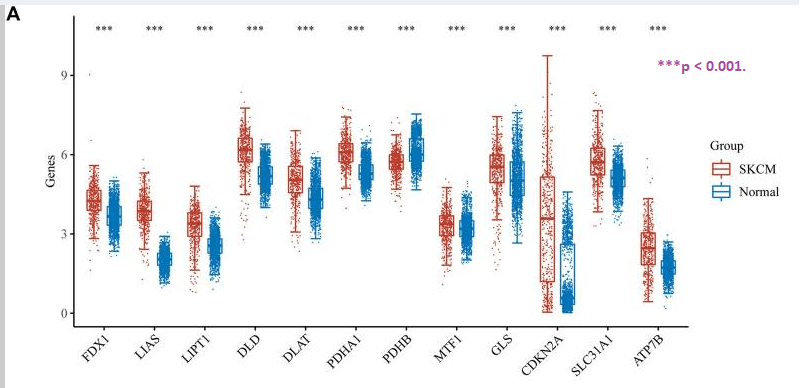
Fig 1 highlight from Lv 2022 {4] (B) Box plots visualized the expression patterns of cuproptosis-related genes in two SKCM clusters. **p < 0.01, and ***p < 0.001.. - MTF1 … is a Zn2+ transcription factor that binds to the metal response element ( MRE) to activate transcription of genes that code for metalothionein. Also regulates the expression of metalloproteases in response to intracellular zinc and functions as a catabolic regulator of cartilages (By similarity)
- GLS..glutaminase, liver isoform, Plays an important role in the regulation of glutamine catabolism. Promotes mitochondrial respiration and increases ATP generation in cells by catalyzing the synthesis of glutamate and alpha-ketoglutarate. Increases cellular anti-oxidant function via NADH and glutathione production. May play a role in preventing tumor proliferation
- CDKN2A is a gene that codes for a protein that is a negative regulator of cylins that control the cell cycle and hence proliferation.
- SLC31A1, aka Ctr1
- ATP7B the Cu+ efflux pump
Simplifying Lv 2022 confusing Fig 5
Much of the Lv [4] publication shifted to high expression of LIPT1 expression being correlated with survival. The data presented in Lv 2022 seemed excessive. The PMC link [4] was used to obtain a full size image that was edited to show only significant increases or decreases in the CIBERSORT score.
Panel 5A PD-L1 expression as a function LIPT1 expression
Much of the Lv 2022 that is not being presented in this post discussed that how more LIPT1 is expressed in melanomas than in normal tissue, patients whose melanomas have a light level of LIPT1 expression have better survival than patients whose melanomas have lower expression. [4] Then they show data the more expression the more expression of PD-L1. PD-L1 or prgramed death receptor ligand 1, is a protein on the surface of tumor cells that binds to the programmed death receptor PD-1 found on activated T cells. When the two bind, the activated T cell is turned off. Wikipedia authors discuss how antibodies against PD-L1 are used to treat cancers that include melanomas! This is confusing and makes absolutely no sense whatsoever.
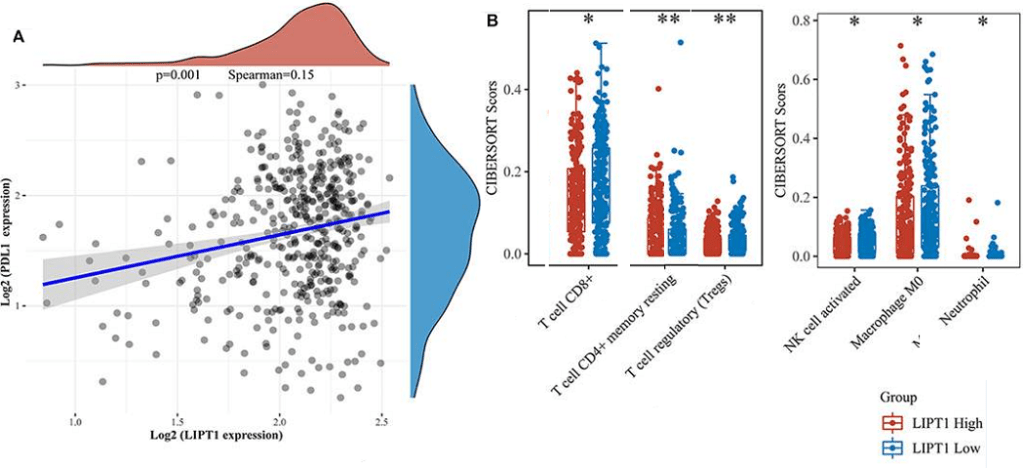
Fig 5 Lv 2022 [4]Relationship between LIPT1 expression, immunotherapy and infiltrating immune cells in Skin Cutaneous Melanoma (SKCM) by correlation analysis. (A) The correlation analysis of PD-L1 expression and LIPT1 expression in SKCM. (B) The infiltrating levels of immune cells in high and low LIPT1 expression groups in SKCM patients. More survival curves in FIg 5 are not shown in this post Panel 5B, individual immune cells
Lv did not go into great detail on how they used the CIBERSORT score. For now we will assume that they are looking at mRNA markers of various immune cells in the tumors of 470 melanoma patients with low or high levels of expression of LIPT1. The differential infiltration of some immune cells was found between LIPT1-high and LIPT1-low groups.
- CD4+ memory T cells resting ↑
- CD8+ T cells ↓
- regulatory T cells (Tregs)↓
- activated NK cells ↓
- M0 macrophages ↓
- neutrophils ↓
To summarize Lv and coauthors found that LIPT1 was upregulated in melanoma by analyzing the data downloaded from the TCGA and GEO databases, respectively. They also found that LIPT1 could be an indicator of the favorable prognosis of melanoma. They just assumed that up regulated LIPT1 might inhibit tumorigenesis by disrupting the TCA cycle. [4] This is what they claimed. LIPT1 actually supports the TCA cycle. In general it is better that tumors have an active TCA cycle and electron transport chain because to do otherwise would force them into the glycolytic Warburg Effect. The high lactic acid tumor microenvironment tends to be immuno suppressant.
Targeting DLAT
Recall that DLAT is the pyruvate dehydrogenase complex component that binds to lipoic acid. It also oligomerizes in response to high copper. [2] D-lipoic acid has been explored as a means of chelating Cu(I) from Cu(I) binding proteins in Wilson’s Disease. [5] The C50 concentration needed to chelate 50% of the Cu(I)Cox17 was 0.498 ± 0.098 mM. The Kd (affinity) was 8.05 × 10−17 M, 10 to 100x than some of the other chelators examined as possible Wilson’s Disease therapeutics for this copper overload disorder. [5] Note, 0.498 mM lipoic acid is not going to happen.
References
- Tang D, Kang R, Berghe TV, Vandenabeele P, Kroemer G. (2019) The molecular machinery of regulated cell death. Cell Res. 2019 May;29(5):347-364. PMC free article
- Tsvetkov P, Coy S, Petrova B, Dreishpoon M, Verma A, Abdusamad M, Rossen J, Joesch-Cohen L, Humeidi R, Spangler RD, Eaton JK, Frenkel E, Kocak M, Corsello SM, Lutsenko S, Kanarek N, Santagata S, Golub TR. Copper induces cell death by targeting lipoylated TCA cycle proteins. Science. 2022 Mar 18;375(6586):1254-1261. PMC free article
- Bernardinelli E, Costa R, Scantamburlo G, To J, Morabito R, Nofziger C, Doerrier C, Krumschnabel G, Paulmichl M, Dossena S. (2017) Mis-targeting of the mitochondrial protein LIPT2 leads to apoptotic cell death. PLoS One. 2017 Jun 19;12(6):e0179591. PMC free article
- Lv H, Liu X, Zeng X, Liu Y, Zhang C, Zhang Q, Xu J. (2022) Comprehensive Analysis of Cuproptosis-Related Genes in Immune Infiltration and Prognosis in Melanoma. Front Pharmacol. 2022 Jun 28;13:930041. PMC free article
- Smirnova J, Kabin E, Järving I, Bragina O, Tõugu V, Plitz T, Palumaa P. Copper(I)-binding properties of de-coppering drugs for the treatment of Wilson disease. α-Lipoic acid as a potential anti-copper agent. Sci Rep. 2018 Jan 23;8(1):1463. PMC free article
0.498 ± 0.098 8.05 × 10−17 -
Oleuropein
We at CopperOne have been telling customers to add cuprous niacin to an oil to keep it in the +1 oxidation state. Why not olive oil? Oleuropein is “the most important phenolic compound present in olive cultivars. It has a role as a plant metabolite, a radical scavenger, an anti-inflammatory agent, an antineoplastic agent, an antihypertensive agent, a NF-kappaB inhibitor, an apoptosis inducer, an antioxidant and a nutraceutical.”
While olive leaves are the main source of oleuropein sold by neutraceutical sorts, olive oil is a common dietary source. We at CopperOne will not go there. We are just mentioning this because customers are intrested in the use of oils to keep their CopperOne in the plus +1 oxidation state.
A high fat diet study and copper handling proteins
Santini, S. J., Tarantino, G., Iezzi, A., Alisi, A., & Balsano, C. (2022). Copper-catalyzed dicarbonyl stress in NAFLD mice: protective effects of Oleuropein treatment on liver damage. Nutrition & metabolism, 19(1), 9. https://doi.org/10.1186/s12986-022-00641-z
Mice were fed a normal or high fat diet for 8 weeks. At the end of this time mice were split into four different groups with four females and four males in each group

Normal dietary oleuropein may be found in olive oil. Oleuropein has a carboxyl group (top) that may bind Cu2+. The authors conducted two 16 week experiments. The first gave a general background of a normal diet (ND) vs a high fat diet (HFD). There were 12 mice, 6 per group in the fist experiment. Had four groups with four males and four females in each group. - normal protein/carbohydrate/fat 24/58/18
- high fat protein/carbohydrate/fat 15/43/42
- normal diet plus 5.6 mg/kg body weight oleuropein
- high fat plus 5.6 mg/kg body weight oleuropein
About a third of the carbohydrates in the high fat diet came from sucrose. Values are in percent total food calories. The gap in the logic of this rather fascinating publication is the focus on methylglyoxylal, a byproduct of glycolysis.

This image was adapted from publication on glyoxylase 1, a focus of the Santini publication that this post is reviewing. DHAP dihydroxyacetone phosphate, GA3P glyceraldehyce 3-phosphate, which feeds into the TCA cycle to produce reducing equivalents for the electron transport chain. Note the three blue nitrogens (Ns) on the side chain of arginine. They carry a positive charge. When methylglyoxal reacts with them, there is no longer a positive charge on the arginine side chain and whatever biochemical interactions that come from it.
1. Why Cu2+ and a high fat diet are toxic
What is frustrating is that we cannot easily determine what the oxidation state is of the copper is in the diet of these mice. Only small portions of the much larger H&E stained images are shown in the panel 1a presented in this post. The take home are the large fat droplets in the liver slices in the liver from a high fat diet (HFD) mouse.

a. some close ups of H&E stained liver sections. The droplets are fats. b. copper is higher in the serum and the liver C only transcripts for the Ctr2 influx channel and the ATP7B efflux pump are increased. The authors think that oleuropein is chelating Cu2+. Why does Cu2+ need to be chelated? For starters, Cu2+ may oxidize glutathione (GSH), a small molecule needed to maintain redox balance. Oxidized glutathione, GSSG, might also form mixed thiols with protein thiols, i.e. PSSG.
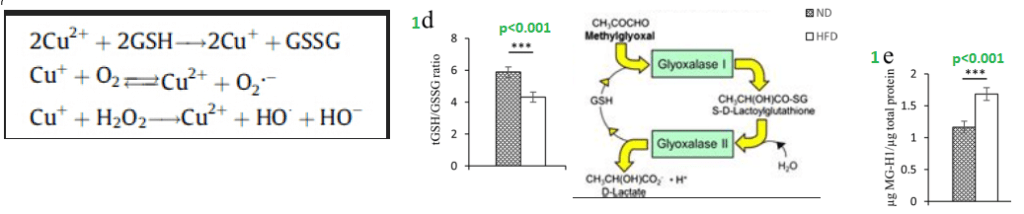
From Santini 2022 with images added for visualization of mechanisms being examined. Glyoxylases are enzymes that detoxify methylglyoxal and other aldehydes before they have a chance to form adducts on proteins. They rely on reduced GSH for detoxification.
The Code Before moving on to looking at bar graphs, this is the code the authors used to make comparisons:
- * is a comparison between the ND (normal diet) and the HFD (high fat diet)
- # is a comparison between HFD and HFD with oleuropein
- § is a comparison between males and females
- 3 symbols in a row, for example ####, means significant at the p<0.001 level
- 2 symbols in a row, ##, means significant at the p<0.01 level
- just one symbol, #, means significant at the p<0.05 level, or 95% certain that the observed difference is not due to random chance. The lower the p value, the more sure we are the results are not due to chance.
2. Oleuropein blunts Cu accumulation
Here the authors are only looking at hepatic and serum Cu. Other tissues were not examined, probably for practical reasons. Small sections of the larger H&E stains are shown only to make the point that a high fat diet results in lipid accumulation in the liver. Male female differences (§, 2c) are not seen in liver Cu content but are seen in the the serum (§, 2b). Oleuopein in the HFD( #, 2b) seems seems to be specific to the female serum but seen in both genders in determining hepatic Cu content (2c).
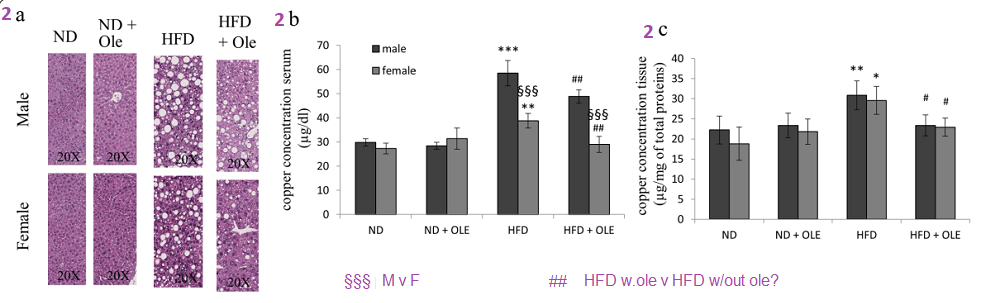
Figure 2, click here if you have forgotten what the symbols mean. The male mice on the HFD seem to have the greatest elevation of serum copper. Oleuropein seems to blunt this increase. We do not know if this increase in serum copper is protective or detrimental. The changes in hepatic copper (2c) are really not that great.
3 Ramping up of Cu+ channel translation
Many times scientists look only at mRNA transcripts of a given gene because it is easy to perform quick and relatively inexpensive analysis of these transcripts. Not every protein for which transcript are produced in the nucleus get translated into proteins. The scientist has to use a technique known as Western blotting to quantify the levels of a given protein. This post will not show the Western blots. Oleuropein increases the Ctr1 protein levels in male and female mice fed a high fat diet at the p<0.05 level of significance. (#, 3b, second panel.
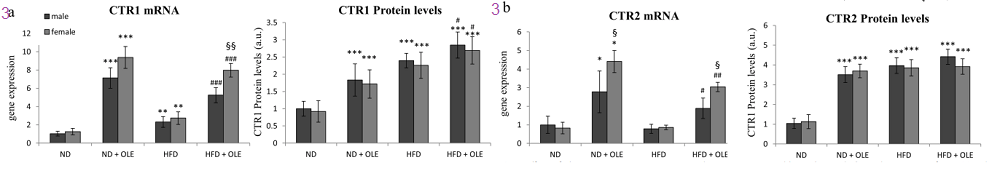
Figure 3, click here if you have forgotten what the symbols mean. 4 Getting Cu out and more GSH
Figure 1d,e speculated that the increase in Cu2+ with a high fat diet could cause GSH to decrease and methylglyoxylate to increase. This next figure combines Figures 4 and 6 from the study. Recall that ATP7B is the Cu+ efflux pump.
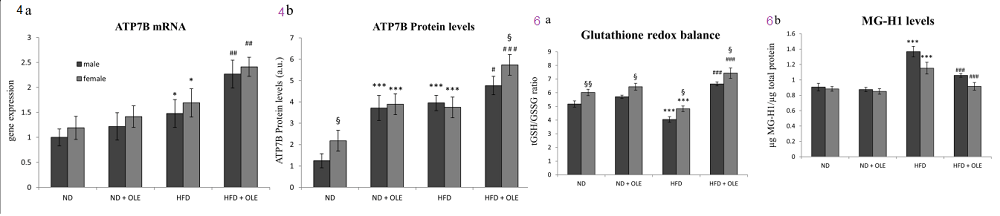
Combined figures 2 and 6 from the Santini publication. The Western blot images have been removed for lay viewers. Click here if you have forgotten what the symbols mean. Oeuropein increases the protein levels of the Cu efflux pump (6b) in males and females, but more so in females. Similar improvements are seen in the increased ratio of GSH to GSSG (6a) and decreased MG-H1 levels.
5. Three Cu chaperones
This image was taken from Figure 5 of the Santini 2022 publication. Some images have been added to document the Cu cofactor enzymes that receive the Cu.

Figure 5 from Santini (2022) Click here for the meaning of the symbols. Western blots used to measure protein levels have been removed for lay readers. Let’s concentrate on protein levels because not every mRNA transcript for a protein produced in the nucleus gets translated into a protein. Oleuropein really increases the transcripts for the Copper Chaperone for Superoxide dismutase (CCS) without a similar increase in actual protein levels (5b). Cu/Zn Superoxide dismutase scavenges the reactive oxygen species superoxide. Cox17 transfers Cu+ to cytochrome C oxidase in the mitochondria. We need this transfer for production of ATP. This transfer needs to occur to burn fat too! Finally, Atox1 transfers Cu+ to both Cu+ ATPases: ATP7A transports Cu into the cerebral spinal fluid for the brain and into the golgi for making secreted copper based enayzmes. ATP7B exports extra Cu into the bile.
7 detoxifying methylglyoxal
Figure 6 of the Santini publication was presented with Figure 4 because the authors propose that Cu2+ can catalyze the depletion of GSH that is used as a substrate for glyoxylate enzymes that detoxify aldehyde groups that are the precursors to advanced glycation end products. Panels 7a and 7b follow a logic similar to seen in previous figures from the Santini publication.
- An mRNA transcript is produced in the nucleus… doesn’t mean it gets translated into a protein
- Just because the ribosomes translate mRNAs into proteins… doesn’t mean they are active enzymes.
- Just because a protein is made, doesn’t mean it is active. It might require a post translational modification like attaching a phosphate group to a key amino acid. It might also require a cofactor, such as GSH in our case.
Click here to go up to the cartoon of Glo1 and Glo2 enzyme action. Note that only Glo1 uses GSH. The authors added exogenous GSH in their assays so that lack of reduced GSH in the liver homogenate would probably not have been a factor.
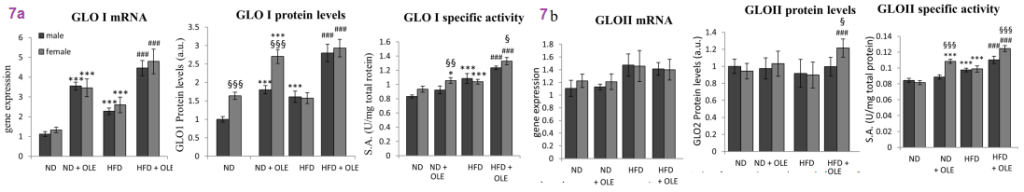
Figure 7 from Santini 2022. Santini and coathors presented one last piece of data suggesting which transcription factor oleuropein works via to produce more Glo1 and Glo2. Let’s first summarize what has been presented so far.
Summary
- In a mouse model, a high fat diet decreases reduced glutathione that is needed for detoxifying protein modifying methylglyoxal. Toxic Cu2+ may be the reason.
- Oleuropein, a compound n olive oil, blunts Cu accumulation in the liver and serum. We don’t know if the Cu is getting to other tissues.
- Oleuropein increases mRNA transcripts for Cu+ channels Ctr1 and Ctr2. We at CopperOne think that this is a good thing.
- In mice fed a high fat diet, oleuropine increases the transcripts for the Cu+ efflux pump too. We don’t’ know about the Cu+ pump ATP7A that delivers Cu+ for making proteins that are exported from the cell.
- Oleuropein increases mRNA and Cu+ chaperone proteins themselves that deliver Cu+ to enzymes we need to make ATP, combat reactive oxygen species, and making critical Cu enzymes that are exported from the cell.
- Oeleuropein increases reduced GSH in mice on a high fat diet. The toxic glycolysis byproduct methylglyoxal is decreased too.
- Oleuropein increases the activity of enzymes that metabolize this toxic byproduct of too much sugar.
Santini and coauthors have given us some insight as to why Cu2+ is toxic, particularly when we eat way too much sugar. We’ve been thinking of oils for keeping CopperOne in the +1 redox state. Why not olive oil with oleuropein to increase the expression of Ctr1 an copper chaperones? Naturally more studies will be required to prove this one.
