Author: BL

  • Our NLR results

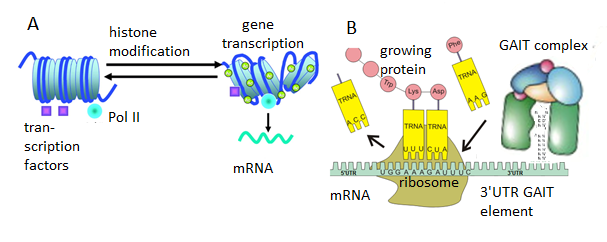
    The importance of copper in the function of neutrophils and lymphocytes as been addressed on another post. This post never actually presented real data. We retrospectively analyzed data from a study performed by KGK Synergize in 2014. KGK analyzed the raw numbers of neutrophils and lymphocytes using an ANOVA model because the data were nonparametric. This post presents how we analyzed data collected by our CRO that has be registered at https://clinicaltrials.gov/ct2/show/NCT04737278. The graphs sort of tell their own story. Until FDA gives the green light, we are making no medical claims.

    This free stats site uses six different sets for normality:  Shapiro-Wilk, Shapiro-Francia, D’Agostino-Pearson, Jarque-Bera, Cramer-von Mises, Anderson-Darling.  The sensitivity was set at p<0.05. 

    Given these results, it was decided to skip the ANCOVA in favor of ANOVA since the assumption of normality is met for NLR data.  Went back and checked the neutrophil counts.  Very definitely not a normal distribution.

     Placebo1Placebo2Placebo3Cu 1Cu2Cu3
    Minimum1.1428570.95833310.6190480.6250.766667
    Maximum3.7272734.154.6666674.63.833333
    Sum55.5898253.2932561.5224549.6553549.6677245.39949
    Points282828282828
    Mean1.9853511.903332.197231.7734051.7738471.62141
    Median1.7571431.7450982.0416671.6666671.751.439103
    RMS2.0919882.0168282.4106441.9618781.9273151.758534
    Std Deviation0.671490.6792691.0098540.8544420.7674950.693279
    Variance0.4508990.4614071.0198050.7300720.5890480.480636
    Std Error0.12690.128370.1908440.1614740.1450430.131017
    Skewness1.2840531.2711231.4408431.7563521.6418781.399153
    Kurtosis0.9203681.9879521.7941573.6315114.6852512.016536
    normalityPass allPass 1st 4Pass allPass allPass allPass all
    Placebo1-3 are NLR ratios on clinic visits 1-3 for the placebo group. Cu1-3 are NLR ratios for the Cu(I)NA2 group for clinic visits 1-3.

    Having proven normal distribution another free stats website was used to perform ANOVA. A free site was used for 2-way ANOVA.

    ANOVA Summary     
    SourceSSdfMSFp
    visits0.4110.410.650.422
    treatments3.2613.265.140.025
    visits x treatments1.3111.312.070.153
    Error66.571050.63  
    Total71.55108   
    A table of Anova values from teh free website. Note that only the treatment term is significant.
     PlaceboCu(I)NA2P Value
    Mean ± SD (N) Median (Min – Max) Mean ± SD (N) Median (Min – Max)
       Neutrophils (109/L)
    Screening3.49 ± 1.12 (28)
    3.4 (1.8 – 6.4)
    3.45 ± 1.16 (28)
    3.2 (1.3 – 6.3)
    Baseline3.35 ± 1.13 (28)
    3.1 (1.5 – 6.2)
    3.28 ± 1.06 (28)
    3.15 (1 – 6)
    Visit 3 (Day 28)3.60 ± 1.13 (27)
    3.6 (1.7 – 6.4)
    3.15 ± 1.19 (26)
    2.85 (1.5 – 7.2)
    0.03*
    Change from Baseline to Visit 30.32 ± 0.83 (27)
    0.2 (-0.8 – 3.6)
     p = 0.05§
    -0.13 ± 0.73 (26)
    0.05 (-1.9 – 1.2)
     p = 0.38§
        –
    Lymphocytes (109/L)
    Screening1.84 ± 0.51 (28)
    1.9 (0.8 – 2.8)
    2.15 ± 0.69 (28)
    2.15 (0.6 – 3.4)
    Baseline1.83 ± 0.51 (28)
    1.8 (0.9 – 2.7)
    2.01 ± 0.64 (28)
    1.9 (0.5 – 3.2)
    Visit 3 (Day 28)1.74 ± 0.51 (27)
    1.8 (0.9 – 2.6)
    2.04 ± 0.72 (26)
    2 (0.6 – 3.4)
    <0.01*
    Change from Baseline to Visit 3-0.08 ± 0.34 (27)
    0 (-0.8 – 0.4)
     p = 0.22§
    0.03 ± 0.39 (26)
    0.1 (-0.8 – 1)
     p = 0.73§
    Neutrophil to lymphocyte ratio
    Screening1.99 ± 0.67 1.76 (1.14-3.72)1.77 ± 0.85 1.67 (0.62-4.57) 
    Baseline1.90 ± 0.68 1.75 (0.96-4.1)1.77± 0.77 1.75 (0.625-4.6)p=0.44§  
    Visit 3 (Day 28)2.20 ± 1.03 2.08 (1.0-5.0) p=0.066§1.62 ± 0.69 1.44 (0.77-3.83) p=0.054§p=0.03∆
    Change from Baseline to Visit 3-0.294 ± 0.813 -0.049 -3.38 to  1.380.152 ± 0.400 0.123     -0.625 to 0.902  p<0.05§  
    Table 3 Changes in white blood cell populations indicative of inflammatory status.  *Between group comparisons were made using ANCOVA.    §Within group comparisons were made using the paired Student t-test.  Probability values ≤0.05 are statistically significant. ∆ 2 way ANOVA treatment effect   Note change from baseline to visit 3 is positive if there is a decrease in the cell count or a decrease in the ratio.

    Note that a change in baseline to Visit 3 is the baseline value minus the Visit 3 value. A The mean change in baseline to visit 3 decreased in the placebo group meaning that the NLR increased in the placebo group.

    Examples of Cu(I)NA2 helping those that are..

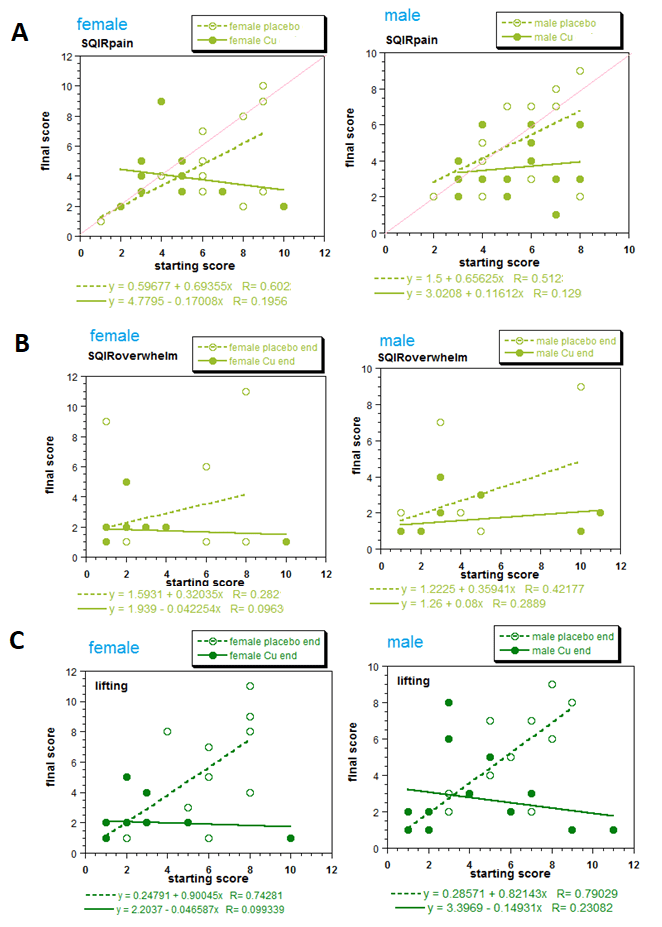
    Mitosynergy has a conviction that customers that are worse off have the most symptom improvement. This multiple regression model provides preliminary statistical backing for this conviction. The red line of “manuscript in preparation Figure 4A illustrates what one would see if there was no improvement of the baseline score on the X-axis to the score on day 28 on the Y-axis. The slope would be 1.0. The equation of a line documenting a complete “cure” would have a slope of 0 and and a Y-intercept of 0 to 1. The placebo slopes were about 0.65, close enough to 1.0. The slopes of theCu(I)NA2 line for the females was less than 0, -0.17. Examination of the NLR will reveal a different phenomenon.

    Figure 4 (a manuscript in progress) Exemplary graphs from SQIR questions A. Symptom Domain, pain. In females the probability is higher that the Cunermuspir and placebo lines have different slopes (p=0.037). In males the probability that the lines have different slopes did not meet the threshold of significance. Red lines indicate the slope of 1.0, or no change in the score from baseline to day 28. B. Impact Domain, overwhelm by symptoms. C. Function Domain, lifting bags of groceries. For both males and females the slopes of the Cunermuspir and placebo lines are different at p=0.0114 and p= 0.0043, respectively.


    A graphical view of the NLR


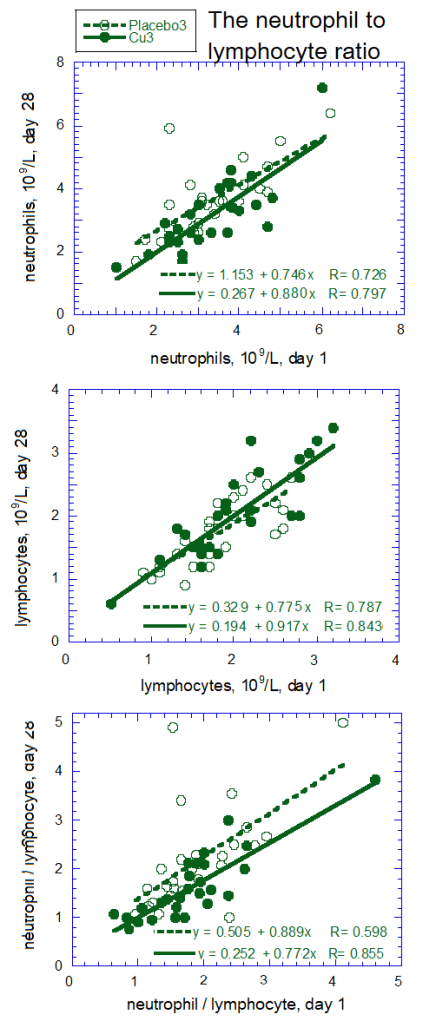
    Figure 5 Neutrophils, lymphocytes, and the neutrophil /lymphocyte ratios: the amount on day 28 as a function of baseline, day 1.


    Male and female data were combined when analyzing neutrophil and lymphocyte counts because separating the data did not reveal any difference. Population variations are very apparent when the data are presented graphically. The interesting phenomenon is that the slopes of the lines of the placebo and Cu(I)NA2 were statistically the same. The y-intercepts appear to be different. While these small studies are to be interpreted with caution, Cu(I)NA2 seems to improve the NLR ratio for all the participants a little.

  • Copper for Covid

    Inspired by Coronavirus 2019 (COVID-19)- Using Ascorbic Acid and Zinc Supplementation (COVIDAtoZ)

    This study protocol differs from other iterations as the Covid-19 death toll reaches 400,000. There’s a nice zinc supplement study zinc supplement study: A single-center, prospective, open label four arm study (1. Zinc only 2. Zinc and ascorbic acid 3. Ascorbic acid only 4. Standard of care.

    Looking Back, comparing two coppers on immune parameters in chickens

    The updated plan would be to perform blood draws only after the patient has a negative PCR test. Time to negative PCR test will be a new outcome measure. By restricting blood draws, money could be saved towards including an active comparatar rather than a placebo. Cupric glycinate is one such active compound (Jarosz 2018). These authors tested the hypothesis that Cu(II)Gly could improve cell based (T cell lineages) and humoral (cytokine) immune parameters in boiler chickens. These authors also included the plasma based copper carrier protein ceruloplasmin and erythrocyte Cu/Zn superoside dismutase (SOD) in their analyses. Chickens were treated with two forms of cupric copper (CuSO4 and Cu(II)Gly) phytase (F) A phytase (myo-inositol hexakisphosphate phosphohydrolase) is any type of phosphatase enzyme that catalyzes the hydrolysis of phytic acid (myo-inositol hexakisphosphate) – an indigestible, organic form of phosphorus that is found in many plant tissues. The roosters were suplemented wtih 16 mg Cu per kg feed in addition to the normal requirements for Ross 308 broiler chickens.

    Data were analyzed with the Kruskal Wallis non-parametric version of the t-test. * different from the control (p<0.05) a different from day 0 to day 20 b different from day 0 to day 42 c different from cay 20 to day 42

    Note that cupric glycinate out performs CuSO4. The way the data were presented, it is kind of hard to tell if the phytase enzyme did any good. These authors also looked at Interleukin 2 (IL-2) and IL-10. Both copper compounds greatly increased IL-10 from day 20 to day 42.

    Data were analyzed with the Kruskal Wallis non-parametric version of the t-test. * different from the control (p<0.05) a different from day 0 to day 20 b different from day 0 to day 42 c different from cay 20 to day 42
    Lymphocyte sub populations

    These authors characterized lymphocytes (immune cells associated with antibody production) based on surface markers. CD3+ is a T-cell marker. CD4+ marks the cell as a T helper cell. CD8+ marks a T cell as a a cytotoxic T cell that are best known for killing cancer cells. CD25 is the IL-2 receptor. It is found on activated T and B cells. MHC class II are surface proteins that present antigens on macrophage and dendritic cells, to name a few. Bu-1a is an antigen found on bursal cells of one day old hens.The Bursa of Fabricius is a lymphoid organ found only in birds

    • CD3+CD4+ Phytase and Cu-Gly seemed to have elicited the biggest increases in the CD4+ sub population.
    • CD3CD8+ Only copper glycinate with phytase increased this marker at day 42.
    • CD25+ Cu-Gly increased the IL-2 receptor positive cells on day 20 and 42 compared to day 0. Phytase was not reported to increase IL-2 receptor presence.
    • MHC class II Cu-Gly, with and without phytase, increased the percent positive on days 20 and 42 compared to day 0.
    • Bu-1a Both copper supplements result in significant (p<0.05) but slight increases in this antigen marker. Phytase did not seem to do much.

    The take home is that the type of Cu(II) made a difference in the immune systems in these boiler chickens.

    Looking forward, Comparing types of copper in humans

    The eye opening and worthy of emulation thing is that they expose no laboratory to personnel to Covid. It might also cut down on cost for C LAB Pharma if we only do blood work on day 28. Also, having an IRB working with us from the start will probably save time in the long run.

    These are some proposed arms of a Covid study

    • 2 mg Cu per day, 6 mg Cu 48 hours pyrexia in the form of Cu(I)NA2
    • 2 mg Cu per day, 6 mg Cu 48 hours pyrexia in the form of Cu(II)glycinate
    • Covid-19 standard of care

    Reference

    Jarosz ŁS, Marek A, Grądzki Z, Kwiecień M, Kaczmarek B. The effect of feed supplementation with a copper-glycine chelate and copper sulphate on selected humoral and cell-mediated immune parameters, plasma superoxide dismutase activity, ceruloplasmin and cytokine concentration in broiler chickens. J Anim Physiol Anim Nutr (Berl). 2018 Feb;102(1):e326-e336. doi: 10.1111/jpn.12750. Epub 2017 Jun 12. PMID: 28603872.

  • Fungi and SOD5

    Fungi and SOD5

    2021 update

    This post started in the Fall of 2020 when one of us had a little dog with a very bad resurgence of Valley Fever, aka Coccidiodomycosis. The little dog went back on Fluconazole and some carprofen for the “pain” a not so good vet insisted she was in. This same vet wanted to amputate the front right leg at the shoulder joint. The carprofen made the poor little dog woozy. She fell down half a flight of stairs and injured her back. We put her on some Mitosynergy Cu(I)NA2 and hemp oil on top of the Fluconazole.

    Last Fall the little dog could not use her right front leg due to joint damage to the shoulder. This was before the Valley fever went away and came back with a vengeance. She can now use all four legs to walk. Was it the Fluconazole, the copper, the hemp oil, or a combination? This post explores how copper is handled by some select fungi. Please feel free to share this post with your pet’s veterinarian. Do not under any circumstance use this post to play games with your pet’s health without a veterinarian’s assistance! Coccidiodomycosis can kill your pet! Some vets say that a dog must be on Fluconazole for life if there is joint damage no matter how low the antibody titers.

    Back to the original post

    Unlike mammalian SOD1 and SOD3, The Candida albicans SOD5 only binds copper and is a monomer rather than a dimer [1]. In addition, the copper site of SOD5 is solvent accessible. This will become important keeping copper that enters the mammalian body reserved for our SOD rather than that of a pathogenic yeast or fungi. Peterson and coworkers found that SOD5’s activity decreased above pH 7.5. [1]. these authors were also concerned with how key amino acids controlled this pH dependency. They were also concerned with how the pH of the growth of the medium controlled expression of SOD5. Duplicate experiments in Figure 1 show that that SOD5 expressed at pH 3.3 is slightly more active than that expressed at pH 7.5. Glycosylation, attachment of polymeric sugar residues is also more robust at pH 7.5. Anionic proteins in native gels migrate to the negatively charged anode. The addition of sugar residues in the form of glycosylation increases their migration towards the bottom of the gel. Note that the enzyme assays in the native blue tetrazolium gels was performed with full glyosylation, i.e. no EndoH to remove the sugars.

    Fig. 1 Top left SOD5 activity as a function of growth conditions. Experiments were presumably preformed in duplicate. Numbers under the gels represent relative intensity of the white bands. Bottom Left Immunoblots with and without ENdoH enzyme treatment to remove glycosylation. Right SOD acitivity is detected by generation of supreoxide by exposing riboflavin to light. Superoxide, O2-, is generated by this reaction. O2 reacts with nitro blue tetrazolium to form a purple precipitate in the gel.

    SOD5 to escape host super oxide attack

    Candida albicans lacking SOD5, but not SOD6, are more susceptible to superoxide induced killing by co-culture with bone marrow derived macrophage (BMDM). [2] Unlike mammalian Cu/Zn SOD 1/2, SOD5 is not loaded with copper by chaperones, it acquires copper from the host’s extracellular spaces. [3]. This particular reference goes into structural aspects of an intra chain disulfide bond. Intra chain disulfide bonds can make a protein more compact such that they appear to run faster in a gel.

    Fig. 2 A General mechanism by which SOD5 protects C albicans from host superoxide attack [3] B From reference [3] SOD5 acquires copper from the extracellular environment for activity. Zince has no effect on activity. An intrachain disulfide bond may be reduced (red) or oxidized (ox)

    Because SOD5 is loaded with copper from extracellular spaces of the host, that is to say blood, it makes sense that chelators may be used to remove this copper [4]. The ideal chelator will remove copper from SOD5 but not Cu/Zn SOD1/3. Mitosynergy has a different and more natural strategy. Mitosynergy is of the opinion that copper in the +1 oxidation state will be absorbed differently than copper in the +2 oxidation state. Proper absorption is predicted to fuel host Cu/Zn SOD 1/3 while leaving yeast SOD5 starved for copper.

    References

    1. Peterson RL, Galaleldeen A, Villarreal J, Taylor AB, Cabelli DE, Hart PJ, Culotta VC.(2016) The Phylogeny and Active Site Design of Eukaryotic Copper-only Superoxide Dismutases. J Biol Chem. 2016 Sep 30;291(40):20911-20923. [PMC free article]
    2. Gleason J. E., Galaleldeen A., Peterson R. L., Taylor A. B., Holloway S. P., Waninger-Saroni J., Cormack B. P., Cabelli D. E., Hart P. J., and Culotta V. C. (2014) Candida albicans SOD5 represents the prototype of an unprecedented class of Cu-only superoxide dismutases required for pathogen defense. Proc. Natl. Acad. Sci. U.S.A. 111, 5866–5871 10.1073/pnas.1400137111 [PMC free article]
    3. Frohner IE, Bourgeois C, Yatsyk K, Majer O, Kuchler K.(2009) Candida albicans cell surface superoxide dismutases degrade host-derived reactive oxygen species to escape innate immune surveillance. Frohner IE, Bourgeois C, Yatsyk K, Majer O, Kuchler K. Mol Microbiol. 2009 Jan;71(1):240-52. [PMC free article]
    4. Robinett NG, Culbertson EM, Peterson RL, Sanchez H, Andes DR, Nett JE, Culotta VC.(2019) Exploiting the vulnerable active site of a copper-only superoxide dismutase to disrupt fungal pathogenesis. J Biol Chem. 2019 Feb 22;294(8):2700-2713. [PMC free article]
  • IL-1 and copper

    We have heard about IL-1 as part of the Covid-19 cytokine storm. It is often labeled as a bad player in many varieties of inflammation. IL-1 is actually a family of small proteins, IL-1β being the most notorious, pro-inflammatory member. IL-1β is part of many inflammatory diseases. This post is not intended to offer medical advise but rather to give busy MDs some background information to continue their educations.

    In a 1989 study looked at human rheumatoid arthritis patients who had relatively high levels of the copper/iron carrier ceruloplasmin but not erythrocyte Cu/Zn superoxide dismutase activity. Activity levels of Cu/Zn SOD increased after 4 weeks of copper supplementation (2 mg/day). For obvious reasons, the Cu/Zn SOD activity of inflamed tissues was not investigated. Cell cultured experiments with human fiborblasts revealed thatinterleukin-1 elevated Cu-Zn SOD activities in cultured fibroblasts.

    IL-1 is produced by inflammasomes, protein assemblies that contain a protein called NLRP3/NALP3. In 2011 Bae and Park identified a disulfide bond between Cys8 and Cys108. The last few amino acids, of which was Cys108, were not resolved in this crystal structure.

    fff

    A. From Bae and Park, crystal structure of pyrin domain of NLRP3. A hypothetical portion of the domain from Trp94 to the C-terminus is scribbled in. While not in the crystal structure Cys8 and Cys108 can form disulfide bonds B Cysteine (Cys) can form disulfide bonds with other Cys. C. NLRP3 pyrin domains can bind to each other or pyrin domains in ASC.

    fff

    Figure 1 from the Shao [1] Review.
    • Gram negative lipopolysaccharide, pathogen and danger associated molecular patterns (PAMP. DAMP), and such may be recognized by TLR4, which signals the nucleus to produce more inactive IL-1, NLRP3, and so on [2].
    • Particular irritants from inorganic particles to beta amyloid deposits may be phagocytosed. When these phagosomes rupture, the protease cathepsin, and assorted irritants are released into the cell.
    • Finally, reactive oxygen species may trigger inflammasome assembly.
    • In addition to containing the pyrin domain with the redox sensitive disulfide bond, the NLRP3 protein belongs to the family of nucleotide-binding and oligomerization domain-like receptors (NLRs)[2]
    • Adapter protein apoptosis-associated speck-like protein (ASC) A variety of signals cause NLRP3 to open up and bind ASC. This complex activates
    • Procaspase-1 (green ellipse) is an and self inhibited inactive protease. Binding to the NLRP3/ASC complex allows self digestion of the inhibitor portion (rose circle)
    • Active caspase-1 cleaves inactive proIL-1β to an active cytokine.

    The paradoxical role of Cu/Zn SOD1

    Chelation therapy not so fast!

    Deigendesch and coworkers tested the hypothesis that copper causes inflammation. These authors demonstrated that NLRP3 inflammasome activation is blocked by removing copper from the active site of superoxide dismutase 1 with the copper chelator tetrathiomolybdate, [4] Inflammasome function is also impaired in Cu/Zn SOD deficient mice. Copper regulation was found in macrophages, but not monocytes, both in mice and humans. Chelation of bioavailable copper resulted in attenuated caspase-1–dependent inflammation. The authors reported reduced susceptibility to LPS-induced endotoxic shock. Because the chelator tetrathiomolybdate is clinically used to treat Wilson’s Disease, it might prove useful in inflammatory diseases involving the NLRP3 inflammasome.

    Top left, Cu/Zn SOD produces hydrogen peroxide as a byproduct. H2O2 reacts with cysteine to produce cysteine sulfenic acid. Cysteine sulfenic acid reacts with reduced cysteine to produce a disulfide bond. Thioredoxin (Trx) restores protein disfuldide bonds to their reduced state.

    Hydrogen peroxide has been described as a signalling molecule, or second messenger (5]. This disulfide bond of NRLP3 could be dependent on H2O2 from superoxide dismutase. While H2O2 reacts with thiols, it really is not as damaging as super oxide. Catalase also depletes hydrogen peroxide: H2O2 → 2 H2O + O2

    The thiol of cysteine in proteins may form disulfide bonds with other protein scyteine thiols or with a low molecular weight thiol (PSSR, where R is anything and P is a protein. ) Any reduced low molecular weight thiol compound (R’SH) can take things back to normal.

    protein âˆ’ SSR + R′SH â‡„ protein âˆ’ SH + RSSR′ [5]

    Could N-acetyl cysteine be a source of reducing equivalents like the protein thioredoxin? Indeed, copper and N-acetyl cysteine have been suggested as therapies for Covid-19 in conjunction with standard treatments [6]

    And finally, what about the niacin in Cu(I)NA2? Could niacin be a precursor for more NADH + H+ that provides thioredoxin with reducing equivalents to inactivate the IL-1β producing inflammasome?

    Niacin can be a precursor for NADH, a small molecule that supplies reducing equivalents to thioredoxin, and many other things

    If you are a physician thinking about putting your patient on a chelation therapy to reduce inflammation… maybe not so fast. We need Cu/Zn SOD to scavenge super oxide. H2O2 is a less reactive messenger that tells the body there’s trouble via inflammasomes and IL1β. Your patient just needs reducing equivalents to turn the inflammasome off after it’s done it’s job.

    References

    1. DiSilvestro RA. (1989) Effects of inflammation on copper antioxidant enzyme levels.Adv Exp Med Biol. 1989;258:253-8
    2. Bae JY , Park HH (2011) Crystal structure of NALP3 protein pyrin domain (PYD) and its implications in inflammasome assembly J Biol Chem 286(45):39528-36. [PMC free article]
    3. Shao BZ, Xu ZQ, Han BZ, Su DF, Liu C. (2015) NLRP3 inflammasome and its inhibitors: a review. Front Pharmacol. 2015 Nov 5;6:262 [Cross Ref]
    4. Deigendesch N, Zychlinsky A, Meissner F. (2018) Copper Regulates the Canonical NLRP3 Inflammasome. J Immunol. 2018 Mar 1;200(5):1607-1617. [PMC free article]
    5. Forman HJ, Maiorino M, Ursini F.(2010) Signaling functions of reactive oxygen species. Biochemistry. 49(5):835-42. [PMC free article]
    6. Andreou A, Trantza S, Filippou D, Sipsas N, Tsiodras S. (2020)COVID-19: The Potential Role of Copper and N-acetylcysteine (NAC) in a Combination of Candidate Antiviral Treatments Against SARS-CoV-2. In Vivo. 2020 Jun;34(3 Suppl):1567-1588 [Cross Ref]
    7. Freeman TL, Swartz TH. (2020) Targeting the NLRP3 Inflammasome in Severe COVID-19. Front Immunol. 2020 Jun 23;11:1518. [PMC free article]

  • locus ceruleus ventilation

    Coivd-19 patients have difficulty breathing.  Is this due to lost of lung capacity, the cytokine storm, or a combination of the two?  The neurons of the locus ceruleus are themselves very sensitive to CO2/pH. [1]  The A6 norepinepthrine releasing neurons of the LC play a role in translating changes in CO2/pH  to changes in respiration. [2]  This post started asking if cytokines in the Covid-19 cytokine storm effect neurons in the locus ceruleus.

    From the peritoneum to the brain

    Borsody and Weiss(2005) followed up on previous studies that  demonstrated that ip injection of microbial substances–

    • lipopolysaccharide, peptidoglycan bacteria
    • poly-inosine: poly-cytosine (poly(I):(C))  RNA viruses

    increased the spontaneous discharge rates and sensory-evoked responses of isolated locus coeruleus (LC) neurons in a dose- and time-related manner in rats.  Complete transection of the subdiaphragmatic vagus nerves abolished this response.  A variety of microbial substances excited LC neurons after administration into the peritoneal cavity in a manner involving the subdiaphragmatic vagus nerves.[3]  Perhaps these studies have ramifications of any bacterial or viral sepsis.

    IL-1

    Both i.p. peptidoglycan and poly(I)/(C) increased LC activity but with lesser efficacy than LPS.   Was this due to the inflammatory cytokine interleukin 1 (IL-1)? IL-1 receptor antagonists ( IL-1RA) reversed the increase in the activity of LC neurons caused by i.p. peptidoglycan treatment; however, that caused by i.p. Poly(I)/(C) was not diminished by IL-1RA. Thus, the increased activity of LC neurons caused by LPS and peptidoglycan requires IL-1 receptor binding, suggesting the involvement of endogenously-produced IL-1. In contrast, poly(I)/(C) increased the activity of LC neurons but this did not critically involve IL-1 receptors in the LC. [4].

    IL-2

    Receptors for interleukin 2 are  generally considered to be expressed in memory and regulatory T cells. The early 1990s saw  interest in the neuro-immune axis.  De Sarro and Nisticó injected recombinant human and rat IL-2 into the locus ceruleus of rat brains and measured electrical activity.  [5].  IL-2 injection caused slow wave sleep like patterns that were disrupted by agents that inhibit the heterotrimeric G protein signalling that is used by many cytokines receptors as well as cannabinoid receptors  [5]

    IL-6 in combination with IL-1

    Ventricles of  mice were injected with interleukin IL-1β (0.5 μg) and  IL-6 (1 μg) [6]  IL-1β and IL-6-dependent LC neuronal activation induced depression-like behavior and IL-1β induced increase in leptin levels enhanced α1-adrenoceptor-mediated depression-like behavior.

    IL-7 and IL-10

    Not addressed directly in the literature, i.e. PubMed searches.

    IP-10 aka Cxcl 10

    Cxcl-10 in an interferon gamma induced secreted protein that is a well established component of the Covid-19 cytokine storm. [7]  Cxcl 10 has also been speculated to be responsible for loss of taste and smell in Covid-19 infections.

     GM-CSF

    Granulocyte-macrophage colony-stimulating factor is being explored as a therapeutic target for Coivd-19 via antibodies against this secreted pro-inflammatory cytokine as well as its receptor [8].  Myeloid cells activated by GM-CSF may secrete inflammatory cytokines IL-1 and IL-6 as well as reactive oxygen species. [8]  IFNγ prevents secretion of GM-CSF and  fatal HSV1 encephalitis  caused  by the invasion of the brain stem by inflammatory monocytes and neutrophils [9].

    MCP-1, aka CCL2

    (TNF-α), chemokine (C-C-motif) ligand 2 (CCL2), and granulocyte-macrophage colony-stimulating factor (GM-CSF). A recent review lists these cytokines as part of the COVID-19 cytokine storm:  IL-6)\, IL-1β, TNF-α,  GM-CSF, and CCL2. [10]  The Kempurai does a nice job of reviewing the Covid-19 virus and the cytokine storm.  Then the authors discuss locus ceruleus psychological aspects of Covid-19 such as

    • tension that can increase shortness of breath
    • sleeping disorders
    • fear and anxiety

    Another story found that patients with mood disorders or suicide attempt were more likely to be sero positive for Coivd-19 and influenza A and B viruses. [11]  The effect of viral associated cytokines on expression of enzymes involved in serotonin synthesis was speculated to be be part of the iteology. [11]

    MIP-IA

    Macrophage inflammatory protein (MIP-1) may also induce the secretion of IL-1, IL-6, and TNFα .

    TNFα,

    Keneko and coworkers [12] injected mice with lipopolysaccharide and found that this stimulated microglial cells to produce TNF-α.  They also found that NE from the locus ceruleus suppressed this inflammatory response.  The influence on respiration was not addressed.

    H5N1 and ventilation

    The highly pathogenic H5N1 (HK483) viral infection causes a depressed hypercapnic ventilatory response (dHCVR, 20% ↓) at 2 days post infection (dpi) and death at 7 dpi in mice  The authors cited four centers of the ventilation in repose to hypoxia and/or elevated CO2

    ventilation1

    1.  Glomus cells in the carotid body.   Viral nucleocapsid protein NP was not found at this site.
    2. NE secreting neurons in locus coeruleus (LC).  These neurons are sensitive to local acidosis.  Viral NP was found in 35% of tyrosine hydroxylase posititive neurons.
    3. In serotonergic neurons in the raphe nuclei, 10% of the  tryptophan hydrolase  expressing neurons were also positive for viral NP.
    4. The neurokinin 1 receptor (NK1R)-expressing neurons in the retrotrapezoid nucleus (RTN) are chemosensitive and responsible for  HCVR. Viral NP was found in 20% of the neurons.

    The authors  asked whether the dHCVR became worse over the infection period with viral replication in these cells/neurons. Mice intra nasally inoculated with saline or the HK483 virus were exposed to hypercapnia for 5 min at 0, 2, 4, or 6 dpi, followed by immunohistochemistry to determine the expression of nucleoprotein of H5N1 influenza A (NP) alone ….[13]

    Mice lacking the used mice with a targeted deletion of the Recombinant activating gene 1  (Rag1−/− )   lack functioning T and B cells.  They can mount an innate but not adaptive immune response against the H1N1 virus. A 2016 study out of the Karolinska Institute tested the hypothesis that the H1N1 virus  could lead to narcolepsy like symptoms in immune compromised rats.   These authors discussed the autoimmune like loss of orexin secreting neurons in the lateral hypothalamus and the possible role of the H1N1 vaccine.

    When the nasal passages of the mice were inoculated with H1N1, sleep/wake disturbances followed in a few weeks. [14]  These authors observed viral infection of the noradrenergic neurons of the locus ceruleus. [14]


    Adaped from Figure 6 of reference [14] The neural invasion of H1N1 into the brains of immuno compromised mice. The Dorsal Rpahe nucleus has projections to the olfactory bulb and amygdalla. The locus ceruleus (LC) affects respiration and sleep/wake cycles. The trigeminal nerve projects to cranial nerve V.

    References

    1. de Carvalho D, Patrone LG, Taxini CL, Biancardi V, Vicente MC, Gargaglioni LH. (2014) Neurochemical and electrical modulation of the locus coeruleus: contribution to CO2drive to breathe. Front Physiol. 2014 Aug 5;5:288. [PMC free article]
    2. Magalhães KS, Spiller PF, da Silva MP, Kuntze LB, Paton JFR, Machado BH, Moraes DJA. (2018) Locus Coeruleus as a vigilance centre for active inspiration and expiration in rats. Sci Rep. 2018 Oct 23;8(1):15654. [PubMed free article]
    3. Borsody MK, Weiss JM.(2005) The subdiaphragmatic vagus nerves mediate activation of locus coeruleus neurons by peripherally administered microbial substances. Neuroscience. 2005;131(1):235-45
    4. Borsody MK , Jay M Weiss JM (2004) The effects of endogenous interleukin-1 bioactivity on locus coeruleus neurons in response to bacterial and viral substances Brain Res 1007(1-2):39-56.
    5. De Sarro G, Nisticó G. (1991) Effects of pertussis toxin, dibutyryl-cyclic-AMP, bromo-cyclic-AMP and forskolin on the behavioural and electrocortical power spectrum changes induced by microinfusion of interleukin-2 into the locus coeruleus. Int J Neurosci. 1991 Jul;59(1-3):67-79
    6. Kurosawa N, Shimizu K, Seki K(2016) The development of depression-like behavior is consolidated by IL-6-induced activation of locus coeruleus neurons and IL-1β-induced elevated leptin levels in mice. Psychopharmacology (Berl). 2016 May;233(9):1725-37.
    7. Oliviero A, de Castro F, Coperchini F, Chiovato L, Rotondi M. (2020) COVID-19 Pulmonary and Olfactory Dysfunctions: Is the Chemokine CXCL10 the Common Denominator? Neuroscientist. 2020 Jul 13:1073858420939033. [Cross Ref]
    8. Lang FM, Lee KM, Teijaro JR, Becher B, Hamilton JA. (2020) GM-CSF-based treatments in COVID-19: reconciling opposing therapeutic approaches. Nat Rev Immunol. 2020 Jun 23:1-8 [PMC free article]
    9. Ramakrishna C, Cantin EM. (2018) IFNγ inhibits G-CSF induced neutrophil expansion and invasion of the CNS to prevent viral encephalitis. PLoS Pathog. 2018 Jan 19;14(1):e1006822. [PMC free article]
    10. Kempuraj D, Selvakumar GP, Ahmed ME, Raikwar SP, Thangavel R, Khan A, Zaheer SA, Iyer SS, Burton C, James D, Zaheer A. (2020) COVID-19, Mast Cells, Cytokine Storm, Psychological Stress, and Neuroinflammation. Neuroscientist. 2020 Jul 18:1073858420941476 [Cross Ref]
    11. Okusaga O, Yolken RH, Langenberg P, Lapidus M, Arling TA, Dickerson FB, Scrandis DA, Severance E, Cabassa JA, Balis T, Postolache TT.(2011) Association of seropositivity for influenza and coronaviruses with history of mood disorders and suicide attempts. Version 2. J Affect Disord. 2011 Apr;130(1-2):220-5. [PMC free article]
    12. Kaneko YS, Mori K, Nakashima A, Sawada M, Nagatsu I, Ota A. (2005)Peripheral injection of lipopolysaccharide enhances expression of inflammatory cytokines in murine locus coeruleus: possible role of increased norepinephrine turnover. J Neurochem. 2005 Jul;94(2):393-404. [PMC free article]
    13. Zhuang J, Zang N, Ye C, Xu F.(2019)Lethal avian influenza A (H5N1) virus replicates in pontomedullary chemosensitive neurons and depresses hypercapnic ventilatory response in mice. Am J Physiol Lung Cell Mol Physiol. 2019 Mar 1;316(3):L525-L536.[PMC free article]
    14. Tesoriero C, Codita A, Zhang MD, Cherninsky A, Karlsson H, Grassi-Zucconi G, Bertini G, Harkany T, Ljungberg K, Liljeström P, Hökfelt TG, Bentivoglio M, Kristensson K.(2016) H1N1 influenza virus induces narcolepsy-like sleep disruption and targets sleep-wake regulatory neurons in mice.
      Proc Natl Acad Sci U S A. 113(3):E368-77. [PMC free article]

  • monitoring fevers

    Do temperatures associated with infections track diurnal variations of body temperatures? 

    A trip back to the 1800s

    Sometimes searching for images is a good way of finding things.   One such image search led us to an article in a journal called the History of Science[1]. The authors described a group of physicians turning their clinics into a laboratory.  The physicians recorded the temperature of typhoid fever patients twice a day.  Note that in Figure 19, the patient that died with a fever over 43oC, 109.4oF.  Also note that the other patients had daily high and low temperatures.

    Fever_curve_original
    Fig 1 Specific temperature curves of typhus and typhoid fevers. From C. A. Wunderlich, Das Verhalten der Eigenwärme in Krankheiten (Leipzig, 1868).  See reference[1]
    This publication seems to have inspired a Russian language account of the same phenomenon.  We do not know if this is the abdominal variety, but the temperature curve sure presents that way.

    Fever_typhoid
    Fig 2 a Russian language example of a typhoid fever “fever curve”

    In this particular typhoid patient, the temperature went from 38.7oC to 36oC to 38.5oC on day 19-20.  This translates to  101.7oF, 96.8oF 101.3oF.  Did this patient experience feeling hot, followed by “the chills” to feeling hot again as some Covid-19 patients report?   It is easier to find “fever curves” for typhoid fever 150 years ago than to find “fever curves” for  Covid-19.  Covid-19 patients who are not too “out of it” can be turned into citizen scientists by recording their temperatures .

    Some undated Wikipedia Commons images for Antipyretic activities

    Arsacetin is an arsenic containing compound that was formerly used to treat syphilis and trypanosomiasis.

    Fever_arsacetin
    Fig 3 A fever curve that documents the testing a potential anti-pyretic compound

    These patients started out with temperatures of 39.5oC or about 103oF .  The patients were given arsacetin  Their temperatures dropped to an average of about 36oC or about 96.8oF.  These patients had 12 hr stretches in which their temperatures hovered in the low normal  range of  36.5oC.  We do not know if all 104 cases were given arsacetin at the same time each day.  The subsequent daily highs were 37.5oC or about 99.5oF  and 37oC or about 98.6oF .

    Continuing wih the Wikicommons image search, here we have an old image of a relapsing fever.  All we know that there were 30 patients treated with something.

    Fever_relapsing
    Fig. 4 A fever curve showing gradual reduction of daily high temperatures over the course of several days.

    In this case there was a linear decline of peak daily body temperatures of 40oC, 39.5oC, 39oC and 38.5oC.  . . ..  or about 104 oF, 103oF, 102 oF, and 101oF.  If we did not continue to monitor the body temperature of this group for several days, we may easily have concluded that the treatment cured the fever in a few hours.  Ironically, some of the anti-pyretic clinical trials on clinicaltrials.gov do not take into account diurnal variations in temperatures.

    Absent from the fever curve in figure 4 is the placebo.  The savvy reader might  ask, “how do we know the the fever wouldn’t just go away as the patients recover from the infection?”   This is something we are doing right in this modern age.  A placebo is an inactive substance thought to have no biological activity.  If a patient believes that taking some pill is going to cure them, the fever might go away faster because their stress level is reduced.

    Diurnal temperature variations and melatonin

    This particular temperature curve for a malarial fever seems to track diurnal temperatures.  The nice thing about this image is that the physician recorded more than just the high and low temperature of the patient for several days.

    fever_ malarial
    Fig. 5  Left, fever curve for malaria. The last 24 hours were retraced in cyan. Right diurnal variations in rectal temperature (cyan) and melatonin (magenta), adapted from reference [2].  15:00 would be about 3 PM.  19:00 is 7 PM, the sun is starting to set, most of the year.
     Reference [2] does a really nice job of summarizing the role of light in melatonin secretion and sleep.  Note that just because melatonin is going down as body temperature is going up,  one is causing the other.

    Anderson and Reitner [3] make a strong argument for the role of melatonin and switching immune cells from inefficient glycolytic metabolism to more efficient mitochodrial oxidative phosphorylation.  Melatonin induces the circadian gene, Bmal1, which disinhibits the pyruvate dehydrogenase complex (PDC).   PDC drives mitochondrial conversion of pyruvate to acetyl‐coenzyme A (acetyl‐CoA).  Acetyl CoA feeds into the  tricarboxylic acid cycle that generates reducing equivalents for the electron transport chain.  The electron transport chain is the primary souce of ATP in metabolically active cells.  Anderson and Reitner [3] discuss the Covid-19 cytokine storm turning off the pineal gland production of melatonin.  We seen diurnal temperature variations in two of the three examples of typhoid fever curves [1].  These variations were turned off in the patient that died [1],  see Fig 1.

    Is melatonin production turned off in severe Covid-19 but not in mild cases?  Unfortunately, “fever curves” are not as popular in 2020 as they were in the mid to late 1800s.

    Time of day matters in fighting an infection

    In bacterial septic shock, temperatures may go above or below average.  Circulatory collapse due to hypo-tension is another aspect of this killer.  Bacterial lipo polysaccaride (LPS) is what sets things off.  Mitochondria are important thermo controllers.  Does the time of day that a mouse sees LPS predict it’s outcome.  A group of scientists from Aires, Argentina tested this hypothesis [4].  In the experiments conducted under LD conditions, animals were injected with LPS at

    • ZT11 …. Melatonin has been high for a while.
    • ZT19…. Melatonin has been low for a while.

    (ZT: zeitgeber time; ZT0: time of lights on; ZT12: time of lights off)  Note that the authors did not mention melatonin in their publication.

    Fever_zeitgeber
    Fig 6, adapted from [4] A. survival curve B. temperature after LPS or vehicle injection

    • After eight days, 80% of the mice injected with LPS as they were settling into sleep  (ZT11) were alive.  Fig 6A
    • After eight days, two thirds of the mice injected with LPS in the morning were dead.  Fig 6A.
    • Mice injected with the solvent used to dissolve the LPS maintain a constant body temperature regardless of the time of day of the injection, Fig 6B
    • TNF-α in serum are higher in those mice inoculated at ZT11 compared to ZT19 (not shown)

    Pineal Gland Pathways

    Light entering the eye evokes a signal n the retina that is transmitted to the supra chiasmic nucleus (SCN) to the paraventricular nucleus (PVN), to the
    intermediolateral column (IML) and then the cells from the superior cervical ganglion (SCG).  These cells  secrete norepinepthrin (also noradrenaline).  Reference [5] describes how norepinephrine controls the translation of melatonin synthesis gens into proteins.  This process may be blocked by agents involved in infections, see figure 7.

    Fever_melatonin
    Fig7  Pathways from light entering the eyes to synthesis of melatonin.  The superior cervical ganglion (SCG) stimulates melatonin production by release of noripinephrine.

    The role of the locus ceruleus in temperature control

    When we exercise at night or during the day, we experience vasodilation and sweating to cool ourselves down.  Machado and coworkers measured rat tail vein vasodilation in response to intense exercise [8].  They found the absolute threshold for vasodilation was higher in the dark-phase:  39.3 ± 0.02°C vs. 38.5 ± 0.02°C in the light-phase. [7]

    Fever_LC
    Fig. 8 Light to the locus ceruleus (LC) norepinephrine system.   The LC/NE has the supra chiasmic nucleus (SCN) in common with the pineal/melatonin system.  The Dorsomedial hypothalamic nucleus is different.   The locus secretes norepinephrine to communicate with the Paraventricularis of the Hypothalamus (PVN) and much more.

    Fig 8 is a fusion of an image in reference [8] and Fig 7 to make the point that far more goes into controlling body temperature than just melatonin.  Chemically destroying the locus ceruleus blunts the fever response to lipopolysaccharide (LPS).  [9]  Kaneko and coworkers followed up on a previous study that showed an increase in NE in the locus ceruleus of mice injected with LPS at time points of two and four hours.  [10]  As a followup these authors examined gene expression of TNFα and IL-1β.  LPS into the abdominal cavity of rats. [10]  TNFα and IL-1β mRNA peaked at 2 and 4 hours then decreased to control levels. [10]  TNFα is produced by microglia, not the neurons of the locus ceruleus that secrete NE.  Kaneko and coworkers isolated microglia from neonatal mouse brains.  Cultured microglia were treated with LPS ± 1 µM NE.  NE down regulates TNFα on both the mRNA and protein level.The results point to an anti-inflammatory role of NE.

    Conclusions

    • We’ve know for over 150 years that diurnal temperature variations often persist with infections that cause fevers.
    • Both the pineal gland (melatonin) and the locus ceruleus (norepinephrine) respond to light/dark cycles via the supra chiasmic nucleus (SCN).  We cannot blame a fever getting better or worse at normal diurnal highs on either the pineal gland and/or the locus ceruleus.
    • LPS, the mediator of bacterial inflammation, interacts with both the pineal gland and the locus ceruleus.
    • Even after 150 years, it still feels like we know little about the diurnal variation of fevers that are associated with infections.

    Bored and quarantined at home with a fever, the citizen scientist can help out by simply recording their oral temperature throughout the day.  The more points, the better.  Just two points at 6AM and 6 PM is a good start.  This post describes how fever curves have been used in clinical trials.

    References

    1. Hess V, Berlin C, Mendelsohn JA(2010) Case and Series: Medical Knowledge and Paper Technology, 1600–1900  History of Science  [CrossRef]
    2. Lack LC, Wright HR (2007) Chronobiology of sleep in humans.  Cell. Mol. Life Sci. 64 1205 – 1215 [Cross Ref]
    3. Anderson G, Reiter RJ. (2020) Melatonin: Roles in influenza, Covid-19, and other viral infections. Rev Med Virol. 30(3):e2109. [PubMed free article]
    4. Mul Fedele Malena Lis, Aiello Ignacio, Caldart Carlos Sebastián, Golombek Diego Andrés, Marpegan Luciano, Paladino Natalia (2020) Differential Thermoregulatory and Inflammatory Patterns in the Circadian Response to LPS-Induced Septic Shock Frontiers in Cellular and Infection Microbiology 10 [Cross Ref]
    5. Markus RP, Fernandes PA, Kinker GS, da Silveira Cruz-Machado S, Marçola M. (2018) Immune-pineal axis – acute inflammatory responses coordinate melatonin synthesis by pinealocytes and phagocytes. Br J Pharmacol. 175(16):3239-3250.[PMC free article]
    6. Almeida MC, Steiner AA, Coimbra NC, Branco LG(2004)Thermoeffector neuronal pathways in fever: a study in rats showing a new role of the locus coeruleus.J Physiol. 558(Pt 1):283-94. [PMC free article]

    7. Machado FS, Fóscolo DR, Poletini MO, Coimbra CC.(2016) Influence of Time-of-Day on Maximal Exercise Capacity Is Related to Daily Thermal Balance but Not to Induced Neuronal Activity in Rats. Front Physiol. 2016 Oct 14;7:464.[PMC free article]
    8. Atzori M, Cuevas-Olguin R, Esquivel-Rendon E, Garcia-Oscos F, Salgado-Delgado RC, Saderi N, Miranda-Morales M, Treviño M, Pineda JC, Salgado H. (2016) Locus Ceruleus Norepinephrine Release: A Central Regulator of CNS Spatio-Temporal Activation? Front Synaptic Neurosci. 2016 Aug 26;8:25. [Cross Ref]
    9. Almeida MC, Steiner AA, Coimbra NC, Branco LG(2004)Thermoeffector neuronal pathways in fever: a study in rats showing a new role of the locus coeruleus.J Physiol. 558(Pt 1):283-94. [PMC free article]
    10. Kaneko YS, Mori K, Nakashima A, Sawada M, Nagatsu I, Ota A(2005)Peripheral Injection of Lipopolysaccharide Enhances Expression of Inflammatory Cytokines in Murine Locus Coeruleus: Possible Role of Increased Norepinephrine Turnover 94(2):393-404. [Cross Ref]

  • Reducing Fevers

    Reducing Fevers

    Fever curves are an interesting source of amusement for those that have the ability to collect the data.  This is especially true for those experiencing periodic fever or chills.

    Reducing Fevers:  propacetamol (Tylenol) versus  dexibuprofen

    Paracetamol, acetominophen, propacetamol are inhibitors of cyclooxygenase  (Cox).  Some references suggest it might interact with the endocannabinoid system.     Dexibuprofen, like its more structurally heterogenous ibuprofen,  is a nonsteroidal anti-inflammatory drug (NSAID).  Cox is part of the pathway that converts arachindonic acid (AA) to the pro-inflammatory cytokine PGE2.

    Fevers in kids [1]

    This study looked at fevers that accompany upper respiratory track infections (URTI) in children.  The kids were given oral dexibuprofen or intravenous propacetamol.  The rationale was that if a kid is vomiting, oral antipyretics are ineffective.   Auxillary (armpit) temperatures were recorded every 30 minutes.  This was an Equivalence Trial, a trial with the primary objective of showing that the response to intravenous propacetamol differs from oral Ibuprofen by an amount which is clinically unimportant. This is usually demonstrated by showing that the true treatment difference is likely to lie between a lower and an upper equivalence margin of clinically acceptable differences.

    Inclusion criteria

    • Patients ranging in age from 6 months to 14 years admitted for URTI and presenting with fever (defined as body temperature of the axillar fossa ≥38.0 °C) at the time of admission were included.
    • URTI was diagnosed based on disease history and physical examination carried out by the attending pediatricians.

    Exclusion criteria

    • Patients were excluded under the following circumstances: the patient had been administered antipyretics within 4 h prior to admission,
    • a history of febrile crisis within the past 6 months,
    • the presence of severe hematological abnormality, currently receiving treated for or was treated within the past 6 months for nephrologic, hepatologic, pulmonary, endocrine, hematologic, or cardiologic illnesses, neurologic or central nervous system abnormality,
    • diabetes currently not under control,
    • suspected lower respiratory tract infection,
    • severe hemolytic anemia,
    • under maintenance therapy for bronchial asthma, asthma, urticarial,
    • allergic reaction history when using aspirin or NSAIDs, physical or psychological status deemed inappropriate for a clinical trial,
    • participation in another clinical trial involving other drug(s) within the past 4 weeks, and failure to receive informed consent from the patient or parent.

    Antipyretic_hotkids0

    This is what a temperature curve looks like.  An attempt has been made to shade the area under the Dexibuprofen  curve (gray) versus the Propanecetamol (blue).  Notethat the X-axis is time and the Y-axis temperature.  The larger the area, the more time the child spends feverish.  Some studies on ClinicalTrials.gov like to use  37.0 °C for calculating area under the curve (AUC).

    Antipyretic_hotkids1

    Outcome measurements

    • The primary outcome measurement was the difference in body temperature reduction at 4 h after antipyretic administration between the study and control groups.

    Antipyretic_hotkids2

    The authors failed to demonstrate superiority of intravenous propacetamol oral Dexibuprofen.

    • The secondary efficacy variables were range of body temperature reduction at 4 h after antipyretic administration, the Area Under the Curve (AUC) of body temperature change until 6 h after antipyretic administration-and-time relationship,
    • the maximum value of body temperature reduction within the 6 h after antipyretic administration,
    • the number of patients whose body temperature normalized (< 37.0 °C) at 6 h after antipyretic administration
    • the time point when body temperature first reached< 37.0 °C.

    Antipyretic_hotkids3
    Secondary outcome measures are not statistically different

    In stroke patients [2]

    Antipyretic_Stroke0
    The investigators compared three common drugs to reduce fevers with no intervention.

    Seventy-five patients with acute ischemic stroke confined to the anterior circulation were randomized to 6 times daily treatments during 5 days after the stroke  with either

    • 1000 mg acetaminophen
    • 400 mg ibuprofen
    • placebo

    This study used tympanic temperatures measured every two hours.  Treatment was started within 24 hours from the onset of symptoms. Body temperatures were measured at 2-hour intervals during the first 24 hours, and at 6-hour intervals thereafter.  We don’t know how diurnal variations in body temperature came into play.  We can hypothesize that these patients were not getting a lot of natural sunlight to set their circadian rhythms into motion.

    Outcome Measures

    Clinical trials have primary and secondary measures to see if the tested intervention has the desired effect on the patient’s outcome.
    The primary outcome was body temperature measured rectally at 24 hours from start of treatment. Secondary outcomes were change from baseline temperature at 1 and 5 days from start of treatment, and time with elevated body temperature (> 37.0°C) (area under the curve) during the first 24 hours and the first five days.

    Patients could be included if they had

    • acute ischemic stroke in the anterior circulation
    • a body temperature between 36.0°C and 39.0°C,
    • computed tomography (CT) scan that was compatible with acute ischemic stroke
    • a focal deficit without rapid improvement
    • and a possibility to start treatment within 24 h after stroke onset.

    Exclusion

    • Patients with a posterior circulation stroke were not included because occasional patients could have severe disturbances of temperature regulation through involvement of the hypothalamus.

    Results…

    Antipyretic_Stroke1
    Changes in tympanic temperature after dosing.

    Without intervention, the tympanic temperature increases about 0.4 °C  in first 8-10 hours after recording, which places us at 8 to 34 hours after the stroke. After about 24 hours the temperature levels off to about 0.2 °C  above the starting point.

    Antipyretic_Stroke2

    The Barthel Index is a measure of how much a patient needs help with aspects of daily life such as bathing and using the toilet.  A score of 20 is functional independence.  TheModified Rankin Score is also measures the functional impact of a stroke  A score of 2 indicates not back to normal but able to live independently.  A score of 5 indicates bedridden.

    1. The antipyretic efficacy and safety of propacetamol compared with dexibuprofen in febrile children: a multicenter, randomized, double-blind, comparative, phase 3 clinical trial
      Seung Jun Choi, Sena Moon, Ui Yoon Choi, Yoon Hong Chun, Jung Hyun Lee, Jung Woo Rhim, Jin Lee, Hwang Min Kim, Dae Chul Jeong BMC Pediatr. 2018; 18: 201. [PMC free article]
    2. Dippel, Diederik W J et al. “Effect of paracetamol (acetaminophen) and ibuprofen on body temperature in acute ischemic stroke PISA, a phase II double-blind, randomized, placebo-controlled trial [ISRCTN98608690].” BMC cardiovascular disorders vol. 3 (2003): 2. doi:10.1186/1471-2261-3-2 [PMC free article]
  • Copper Chaperones

    Copper Chaperones

    Starting from Ctr1

    Let us continue the journey from Ctr1 to some intracellular copper chaperones.  The cyoplasmic loops might have their own gating functions, as suggested by Ren (2019), see Ctr1 post

    chaperones_1
    Figure 1 Cytoplasmic loops of Ctr1 A.Ren (2019) cartoon of Ctr1 channel with cytoplasmic loops drawn in, blue. B. UniProt.org topology of human Ctr1 C. Expasy estimation of the isoelectric points and molecular wieght (Mw) of the loops.

    Just looking at the sequences, there are a lot of arginines (R) and lysines (K) Fig 1C). Both of these are positively charged amino acids, just like Cu+.  Expasy has a tool for calculating the molecular weight and isoelectric point (pI) of sequences.   The isolelectric point is the pH at which the peptide has no net charge.  At the intracellular pH of 7.5,

    • the first loop will have a net positive charge
    • whereas the second loop will essentially be uncharged.

    One may speculate that only when a chaperone neutralizes the positive charge on the first cyoplasmic loop will positively charged Cu+  be let out of the “gate.”

    What is a chaperone?

    A chaperone is a person who accompanies young people, on social occasions to prevent an illicit transfer of electrons. In some cases a protein chaperone refers to a protein that assists another protein in proper folding or unfolding. In the case of copper chaperones, both definitions are true. Copper chaperones prevent the illicit transfer of electrons from copper to molecular oxygen. They also assist in proper loading and folding of copper into proteins that use copper as a cofactor.

    chaperones_2
    Figure 2 The bucket brigade. A. Ctr1 and the His-Cys-His motif of the C-terminus of he second cytoplsmic loop of Figure 1c. B. an overview of cellular chaperones and their targets.

    Reduced glutathione is included in this transport process (Hatori 2017).
    Another twist to this story comes from the work of Maryon and coworkers. These authors demonstrated the need for a supply of reduced glutathione in order to facilitate loading of copper chaperones with copper. This suggests that only Cu+ can be loaded into the chaperones. It is curious that Ctr1 is usually depicted as wide at the intracellular lip. Is this so that copper chaperones can approach it to receive Cu+ or is this for glutathione access? HCH is another way of reiterating the histidine-cysteine-histidine motif.

    Use of thiols to transfer Cu+

    Our featured image shows two proteins engaged in a disulfide bond, just liked oxidized glutathione.  Copper chaperones do this in the process of transferring Cu+ .  We may get into the work of Banci and colleagues in a later post.

    Cu+ transported down the affinity gradient.

    Cu+  doesn’t stick around on the exit gate of Ctr1.  It travels from low affinity members of the “bucket  brigade” to high affinity enzymes. The Hatori publication has a clever way of visualizing this transfer.

    • Abundance of  the Cu+ chaperone indicated by size of the elipse.
    • Cu+  affinity indicated by the green color intensity.

    Three main destinations of Cu+ 

    1. Mitocondria: cytochrome C oxidase via Cox17
    2. cytosol: Cu/Zn superoxide dismutase 1 via CCS
    3. secreted proteins: lysyl oxidases (LOX),  ; DBH, dopamine-β-hydroxylase (DBH), Cu/Zn superoxide dismutase 3 (SOD3),  peptidylglycine-α-amidating monooxygenase (PAM) via Atox1 and ATP7A.

    Metallothionein (MT) is a high affinity place to store excess copper.

    chaperones_4
    From Hatori, 2017

    Take home

    From the entrance to Ctr1 to chaperones and insertion into enzymes, it is all about Cu+.  How enzymes use copper for functions necessary for health and life itself is another story for another post!  If you are interested in a copper supplement in the +1 oxidation state, visit the Mitosynergy store.

    References

    Banci L, Bertini I, Ciofi-Baffoni S, Janicka A, Martinelli M, Kozlowski H, Palumaa P.(2008)A structural-dynamical characterization of human Cox17. J Biol Chem. 283(12):7912-20.

    Hatori Y, Inouye S, Akagi R.(2017) Thiol-based copper handling by the copper chaperone Atox1.IUBMB Life.69(4):246-254

    Maryon EB, Molloy SA, Kaplan JH. (2013)Cellular glutathione plays a key role in copper uptake mediated by human copper transporter 1. Am J Physiol Cell Physiol. 304(8):C768-79.


  • Ctr1

    Ctr1

    Ctr1

    We are excited to share with the structure of the Cu+ transporter Ctr1 (Ren 2019).   Feifei Ren and coworkers genetically engineered the Ctr1 transporter from the Atlantic salmon, Salmo salar.  This salmon sCtr1 transporter has 78% sequence identity to our human hCtr1.  TM 1-3 are transmembrane domains.   We have been interested in this Cu+ transporter for a long time.  Because Ctr1 prefers  , our thought is that those taking a dietary copper supplement might prefer Cu(I)NA2 in the +1 over other dietary supplements in the +2  oxidation state.

    The structure of Ctr1

    -Ta6Br12

    Ctr1_1a
    Figure 1, From Ren (2019) supplemental figure 1. The green bars are the three trans membrane domains.  The selectivity methionines in TM2 are shaded in red.

    The Cu+ binding amino acids are in red.  Note the  positively charged lysines (K, 175-176)  and hydrophobic amino acids tryptophan, tyrosine, and phenylalanine (W, Y, F).  Alanine(A), leucine (L), and valine (V) are also pretty hydrophobic.

    Ctr1_1b
    Figure 2, from Ren supplemental figure 2. a. These authors shaved off the N-terminus and replaced an intracellular loop with another protein. b. a polyacrylamide gel, not shown  c. Crystal structure of sCtr1 crystal with Ta6Br12 (green and magenta spheres) bound to the fusion protein BRIL d.  How the fusion protein packs in a crystal.

    Figure 2 may be more than what the average reader wants to know.  Hopefully it will not distract from what is inside this very interesting channel.  Tantalem bromide, Ta6Br12. and the BRIL, whose structure is known, appear to be there as reference points for solving the structure of the salmon Ctr1 channel..

    Ctr1_3
    Figure 3, from  Figure 5 Ren (2019) a. Color coded charge on the interior of Ctr1 b. a cartoon version of the entrance, selectivity, filter, and central cavity.

    Red in Fig 3a is the code for negative charges.  Blue is positive, just like Cu+.  One can imagine that Cu+ will not “want ” to stay long in the central cavity with a combination of positively charged amino acids and some hydrophobic ones too. Cu+ might be drawn to the gate, and then to the intracellular space.

    Exploring on your own

    You may enjoy an interactive exploration of this structure at the Protein Databank.  These beautiful (we think) Ctr1 images were created with the NGL viewer .  The feature image was drawn using the hydrophobicity scale.  Water loving amino acids like glutamic and aspartic acid as well as lysine and arginine are red.  Hydrophobic amino acids like tryptophan and phenylalanine are green.

     Size Matters

    Size matters is part of why we thought Ctr1 Cu+ transporter prefers Cu+  over Cu2+ This is our thinking before Ren (2019)

    A monovalent cation like Na+ or Cu+ is surrounded by water. The oxygen of water has a partial negative charge (δ-) because it has a bigger nucleus with more protons and therefore likes electrons more than the single proton nucleus of hydrogen (δ+). Divalent cations like Mg2+ and Cu2+ have a higher charge density and the ability to form a larger hydration shell. This water has to be removed before going through any ion channel.

    Ctr1_2
    Figure 4 Divalent cations tend to be more hydrated than monovalent cations.

    Back in the 1990s I hung out with electrophysiologists who discussed the need of stripping the waters of hydration before they could pass through ion channels.  While divalent cations might be smaller due to fewer valence electrons, they have more waters of hydration.  It would seem that the limited hydration of Cu+  could be stripped by that methionine selectivity filter.

    Cu+ selectivity begins outside the cell

    Haas and coworkers (2011) measured the Cu+  and Cu2+ binding affinities of the extracellular domains of Ctr1 subunits. These domains help insure that Cu2+ does not enter the channel. A lot of mathematics in this publication will be skipped. Briefly, the authors took the extracellular Ctr1 metal binding domain and replaced histidines with alanines. In the figures that we present, they looked at reduction of Cu2+ to Cu+ .

    Ctr1_5
    Figure 5  Human Ctr1 assembles as a homotrimer in the plasma membrane with an amino-terminal extracellular domain equipped with His (H) and Met (M) potential metal-binding residues. All extracellular His and Met residues are indicated. The functionally critical TMD2 methionine residues and carboxyl-terminal cysteine and histidine residues are indicated.

    These authors ignored the methionine motif that previous studies showed bound  Cu+ with high affinity.   They were more concerned with the histidines that are not present in the yeast version of Ctr1.  Cu2+ binding to histidine is pH dependent.  Yeast acidify their environment.  Besides, we humans have more Ctr1 in the neutral pH of our small intestine, Figure 8.  Haas and coworkers were also interested in an ATCUN motif, or “amino terminal Cu and Ni binder” that is present in human albumin, an abundant blood protein.  We’ve covered some recent experiments on the ATCUN motif.  Some think that Cu2+  bound to this motif may contribute to Alzheimer’s Disease.  We’ve addressed this potential impact of Cu2+ bound to albumin.

    When Cu2+  binds…

    Ctr1_6
     Figure 6, adapted from Hass (2011) Absorbance spectra of Ctr1 model peptides (~500 μM) with 1 equivalent of Cu2+ at pH 7.4 in HEPES buffer. Peptides with His in the third position from the amino-terminus display absorbance at 525 nm characteristic of a typical ATCUN Cu2+ binding site. Substitution of all His-to-Ala, individual substitution of the His at position 3 (H3A) or acetyl capping of the N-terminus (Ac-Ctr1-14) results in a different type of binding site and a shift in λmax compared to the wild-type peptide (Ctr1-14). In HA all three His are replaced by Ala. The peptide labeled Ctr1-14(MNle) refers to the sequence where all 4 Met residues are replaced by Nle while all His residues remain wild type, whereas MNleH56A contains all Met-to-Nle replacements in addition to replacement of both His 5 and 6 with Ala. Finally, Ac-Ctr1-14 contains the native sequence but lacks a free amino-terminal amine due its acetyl cap.  This cap is to prevent binding to Cu2+

     Absorbance of oxidized Cu2+peptide complexes are known. let’s reduce them

    Differences in the ability of ascorbate to reduce Cu2+ complexes of the various peptides were measured in the presence of HEPES buffer at pH 7.4. The experiments were conducted under aerobic conditions where availability of oxygen would allow cycling of copper oxidation states (i.e. after being reduced by ascorbate, the Cu+ could be re-oxidized by O2 from the air). However, if the peptides are able to stabilize Cu+ then the re-oxidation to Cu2+ will be slowed and Cu+ complex should accumulate. In fact, this seems to be the case with some of the peptides and clear differences can be noted depending on the presence of the fifth and sixth position His.  It is assumed that whole human serum albumin (HSA) protein was used.  This protein has a Cu2+   binding site at His27.

    Ctr1_7
    Ascorbate-dependent reduction of Cu2+ in complex with Ctr1-14 model peptides containing the ATCUN site. Solutions of 500 μM peptide- Cu2+ complex and 1 mM ascorbate in 50 mM HEPES at pH 7.4 monitored for 1 hour with UV-Vis at 525 nm, the characteristic absorbance band due to the Cu2+ complex.

    Reduction of Cu2+  on Ctr1 is a very slow process

    Note the scale on this graph.  It takes an hour at room O2  and accorbate to reduce the Cu2+ complex absorbance by 90%.  Ctr1 expression is good in the duodenum, Figure 8.

    Ctr1_8
    Figure 8 Issues with absorbing via Ctr1 A. expression of Ctr1, from Protein Atlas. B. pH of the GI tract and transit times of food.

    So say we take a CuCl2 supplement

    Does the the Cu2+  just bind to the N-terminus of Ctr1 of our duodenum and wait for some ascorbate or another reducing agent to float by?  Will it take longer if the   O2 content of our duodenum is less than room O2 ? Many have speculated on a   Cu2+ reductase next to Ctr1.  So far, no one has found it.

    The Mitosynergy store sells   Cu(I)NA2 powder as well as an encapsulated form in  Vegan, stomach safe capsules.  Some customers report greater results from the stomach protected capsules than the powder.

    References

    Haas KL, Putterman AB, White DR, Thiele DJ, Franz KJ.(2011) Model peptides provide new insights into the role of histidine residues as potential ligands in human cellular copper acquisition via Ctr1. J Am Chem Soc. 33(12):4427-37. [PMC free article]

    Ren F, Logeman BL, Zhang X, Liu Y, Thiele DJ, Yuan P. (2019) X-ray structures of the high-affinity copper transporter Ctr1. Nat Commun. 2019 Mar 27;10(1):1386. [PMC free article]

  • Ceruloplasmin

    Ceruloplasmin

    Ceruloplasmin, the immune system

    Most of this document was written for an M.D. interested in giving the Mitosynergy product to his patients. This post is a compilation of our discussions.  Ceruloplasmin keeps copper and oxygen deep within its surface.

    ceruloplasmin_1
    A visit to the protein database of crystal structures, RCSB.org, allows for exploration. Shown here are a backbone “cartoon” and surface plot of ceruloplasmin. Copper is depicted as copper spheres.

    Here we have an image of ceruloplasm crystallized with just Cu, oxygen, glycerol and N-acetylglucosamine. No iron was used in this particular crystal structure. Sometimes X-ray crystallographers add other small molecules to enable purified proteins to form crystals. The images were produced by the software at rcsb.org. The image on the left is in “cartoon” mode. Only the backbone of the protein is shown. The image on the right is a “surface plot” of what a water molecule might see as it approaches the protein. Very little copper is visible from the surface. A region in the center of the protein with oxygen being complexed to copper is enlarged.

    Ceruloplasmin, a ferroxidase I and more

    Produced by the liver, transported by the blood, ceruloplasmin has been found in glial cells (CNS and retina) and Sertoli cells (testis) (Vashchenko 2013). Enzymatic reactions (Vashchenko 2013) include

    • Ferroxidase
    • NO-oxidase
    • glutathione-peroxidase activities
    • amine oxidase: biogenic amines, xenobiotic amine oxidase

    ceruloplasmin_2a
    Note the interaction between copper and iron in ceruloplasmin.

    Ceroplasmin’s multiple roles as a

    • monoamine oxidase via copper
    • an iron carrier
    • copper carrier

    was examined the hippocampus of the brains of ceruloplasmin knockout mice (Texel 2012). “Knockout” means that the gene has been removed from, or knocked out of, the genome.

    Serotonin

    Serotonin was one of the main neurotransmitters examined. The authors speculated that because iron is needed for the synthesis of serotonin and other monoamine neurotransmitters, ceruloplasmin might be a carrier of iron to the brain.

    Ceruloplasmin deficiency induced by knock out of the gene decreased the iron, serotonin, and norepinephrine in the hippocampus (Texel 2012).

    Corticosterone

    Corticosterone, a rodent regulator of energy, immune reactions, and stress responses, was increased in the ceruloplasmin knockout mice (Texel 2012). Some cognitive and motor function tests revealed an anxiety phenotype.

    ceruloplasmin_2b
    Iron handling in the brain

    Ceruloplasmin constitutes the largest serum copper pool. Circulating ceruloplasmin is not absolutely required for copper delivery to tissues, demonstrating that other copper-binding molecules exist (Gulec 2014).

    Transcription and translational control

    • Mazumder and coworkers (2006) found that gamma interferon (INFγ) not only induced the transcription of ceruloplasmin mRNA but also regulated its translation to protein.
    • The translational silencing of the ceruloplasmin mRNA in U937 monocytic cells was shown to require binding of a cytosolic inhibitor complex, IFN-Gamma-Activated Inhibitor of Translation (GAIT), to a specific GAIT element in the Cp 3’-UTR.
    • The authors speculated that ceruloplasmin may have injurious consequences and require down-regulation. A delay in doing so could exacerbate macrophage induction of ceruloplasmin synthesis and delay or prevent the normal resolution of inflammation.

    ceruloplasmin_3
    Creruloplasmin protein production control,    A. The level of mRNA transcripts can be controlled by repression gene silencing such as promoter methylation and transcription factors that bind specific sequences of DNA. Transcription factor complexes might also bind small molecules in the environment to give feedback control of message generation. PolA is the RNA polymerase that translates the DNA sequence to messenger RNA. B. Messenger RNA is translated into proteins at the Ribosome. There are untranslated regions (UTR) that have three dimensional structures that can bind protein complexes that are also responsive to small molecules in the environment. These complexes promote as well as inhibit translation of the message into a protein. Shown here is the GAIT complex ready to bind to the 3’-UTR of the ceruloplasmin message. If it were drawn to scale, the GAIT complex would prevent the incoming tRNA + amino acid from binding to the mRNA.

    Suggestion of circulating copper deficient ceruloplasmin

    Ranganathan and coworkers (2011) examined the impact of copper and iron excess and deficiency on the amount of ceruloplasmin in the serum of weaning rats. They not only looked at the amount of message but also the amount of translated protein and two enzyme activities of ceruloplasmin.

    • ferroxidase
    • amine oxidase (copper catalyzed)

    This table is a simplified form of the original publication. Amine oxidase and ferroxidase activity are estimated from the fig 3 bar graph of the publication. The other values were copied from table 2.

    treatment mRNA Serum protein Ferroxidase activity Amine oxidase Serum Cu, ppb Serum Fe, mg/L
    Control 1 1 1 1 460 3.3
    Cu extra 0.9 1.3 1.7 1.8 76 3.1
    Fe deficient 1.4 1.5 1.8 1.9 650 0.34
    Fe def/Cu Extra 1.7 1.5 2 2.2 790 0.64
    Cu deficient 2.3 0.15 0 0.04 30 1.6
    Fe D/Cu D 1.3 0.74 0 -0.04 20 0.33

    Highlighted cells are significantly different from the control.

    • Dietary manipulations of Fe and Cu did not change the amount of message in a way that could be distinguished from population variance.
    • Serum ceruloplasmin was changed in response to copper deficiency and Fe deficiency suggesting, but not proving, changes in mRNA translation outside the GAIT complex.
    • The changes in enzyme activity, disproportional to the amount of protein, suggested the presence of circulating copper deficient ceruloplasmin.
    • Amine oxidase, a Cu mediated reaction, increased with copper excess and Fe deficiency but not normal Cu.
    • Ferroxidase activity was very sensitive to Cu deficiency but not Fe deficiency as long as dietary Cu was normal.

    Ceruloplasmin and pathogen response

    Gitlin and coworkers (1992) examined the influence of copper sufficiency and deficiency in the diets of rats exposed to inflammatory agents:

    • lipopolysccharide (LPS)
    • interleukin 1α.

    LPS is a component of the cell wall of Gram negative bacteria and a pro-inflammatory agent.

    IL-1α is a primary mediator of inflammation secreted by macrophages.

    • Inflammatory agents like LPS and IL-1α increase ceruloplasmin transcripts
    • TNFα and the GAIT complex interfere with those transcripts being translated into ceruloplasmin protein.
    • Both IL-1α and LPS increased hepatic ceruloplasmin mRNA content.
    • Ceruloplasmin protein was measured by the ELISA assay in normal and copper-deficient animals.

    making apo ceruloplasmin

    Neither mediator increased ceruloplasmin ferroxidase activity in the copper-deficient group. Newly synthesized ceruloplasmin secretion rates were the same for isolated hepatocytes from normal and copper-deficient rats despite little or no holo-ceruloplasmin synthesis in hepatocytes of copper-deficient rats.

    Ceruloplasmin must pick up copper from somewhere

    The authors concluded that hepatocyte copper content has no effect on hepatic ceruloplasmin-gene expression or ceruloplasmin biosynthesis. The incorporation of copper into newly synthesized ceruloplasmin is not a rate-limiting step in the biosynthesis or secretion of the apoprotein (copper free) from rat hepatocytes.

    Treatment Ferroxidase activity (mol/min /L) ELISA, mg/dL serum Cu, mg/mL
    Cu-sufficient 24.5 ±4.5 27.6±1.6 0.81 ±0.17
    Cu-deficient 1.6±0.5 11.0± 1.4 0.014±0.012
    Cu-deficient + Cu injection 25.1 ±2.4 20.0±3.1 0.73 ±0.06
    Cu-deficient + IL- 1 2.3±1.0 17.5± 5.6 0.05 ± 0.03
    Cu-deficient , Cu + IL- 1 31.1±5.1 26.6± 16.8 0.74±0.10
    Cu-deficient + LPS 0 28.0± 3.4 0.04±0.04
    Cu-deficient + Cu + LPS 24.9±4.0 32.6± 10.2 0.79±0.12

    What we are seeing is that there might be a lot of ceruloplasmin in the blood that is copper depleted or apo because we see that dietary and injected copper can control the ferroxidase activity of ceruloplasmin (Gitlin 1992, Ranganathan 2011).

    Loading ceruloplasmin with “proper copper” in the gut

    In anotherblog we addressed how the Cu+ of Cu(I)NA2 might be absorbed.  We looked at one model in which Cu+ is absorbed by Ctr1 in epithelial cells and then secreted into the blood by.   ATP7A secreting Cu+ willy nilly into the blood stream just isn’t satisfying.  Since ATP7A loads cderuloplasmin in the liver, why not in the blood?

    References

    Gitlin JD, Schroeder JJ, Lee-Ambrose LM, Cousins RJ.(1992) Mechanisms of caeruloplasmin biosynthesis in normal and copper-deficient rats. Biochem J. 282 ( Pt 3):835-9.

    Gulec S, Collins JF. (2014) Molecular mediators governing iron-copper interactions. Annu Rev Nutr. 34:95-116.

    Mazumder B, Sampath P, Fox PL.(2006)Translational control of ceruloplasmin gene expression: beyond the IRE. Biol Res. 39(1):59-66.

    Prohaska JR.(2011) Impact of copper limitation on expression and function of multicopper oxidases (ferroxidases). Adv Nutr.2(2):89-95

    Ranganathan PN, Lu Y, Jiang L, Kim C, Collins JF. (2011) Serum ceruloplasmin protein expression and activity increases in iron-deficient rats and is further enhanced by higher dietary copper intake. Blood. 118(11):3146-53.

    Texel SJ, Camandola S, Ladenheim B, Rothman SM, Mughal MR, Unger EL, Cadet JL, Mattson MP. (2012)Ceruloplasmin deficiency results in an anxiety phenotype involving deficits in hippocampal iron, serotonin, and BDNF. J Neurochem.120(1):125-34

    Vashchenko G, MacGillivray RT. (2013) Multi-copper oxidases and human iron metabolism. Nutrients.5(7):2289-313.