Author: BL

  • PD-1 and Tim-3

    This post was initiated as an effort to better understand a previous post showing association of CD8 cytotoxic T cell surface proteins PD-1 and Tim-3 with Long Covid. A 2010 study documented coregulation of CD8 T cell exhaustion by Tim-3 and PD-1 during chronic lymphocytic choriomeningitis virus infection (LCM) [1] Could Long Coivd be a chronic infection enabled by exhausted T cells? PD-1/Tim-3 play a role in T cell exhaustion in cancer. A study has used H2 gas to bolster the mitochondria in human cancer patients. [2] Cuprous niacin could have an even greater potential as an immunomodulator for more than just Long Covid! For now, Long Covid is where the FDA interest seems to be. This study [1] tells us that anti viral CD8+ T cell surface receptors PD-1 and Tim-3 are something we should include in the clinical trial. Ref [2] that PD-1 has a strong mitochondrial and NAD+ connection. PD-1

    During chronic viral infections such as HIV, hepatitis B virus, and hepatitis C virus
    (HCV) , CD8 T cells become “exhausted” as characterized by [1]

    1. Inability to produce cytokines
    2. Inability to lyse virus infected cells
    3. Inability to proliferate
    Materials and Methods [1]
    • Six-week-old female C57BL/6 mice were were intraperitoneally
      infected with 2 × 10⁵ pfu of LCMV
    • Lymphocytes were isolated from tissue including spleen, liver, lung, and blood as previously described.
    • To detect degranulation, splenocytes were stimulated with individual LCMV peptides or a pool of eight LCMV epitopes for 5 h in the presence of brefeldin, monensin, anti–CD107a-FITC, and anti–CD107b-FITC. Cells were then analyzed on by flow cytometry to determine surface markers.
    • CD8 T cells were purified to more than 90% purity using magnetic beads.
    • Tim3+PD1+ and Tim3-PD1+ CD8 T and cocultured with splenocytes from Thy1.1+ C57BL/6 mice in the presence of LCMV peptides for 3 d.  Proliferation was measured suing flow cytometry.
    • For blockade of PD-1 pathway, 200 μg of rat antimouse PD-L1 antibody were administered intraperitoneally every 3 d for 2 wk.
    • For blockade of Tim-3 pathway, 100 μg of Tim-3-Ig fusion protein were injected intraperitoneally every 2 d for 2 wk.
    • Titers of virus from serum or homogenized tissue sample were determined by plaque assay on Vero cells.
    Fig 1 Intro to flow cytometry and acute vs chronic viral infections

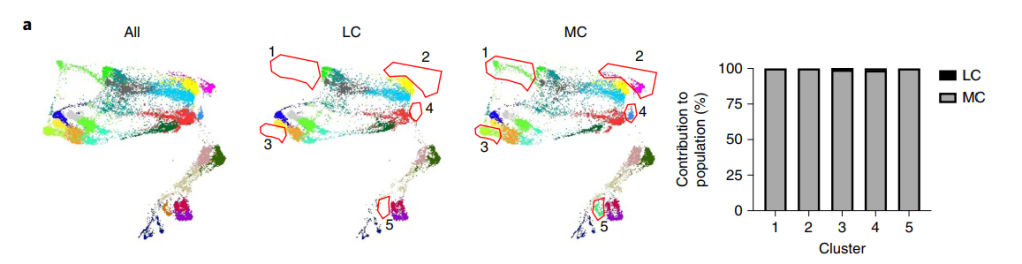
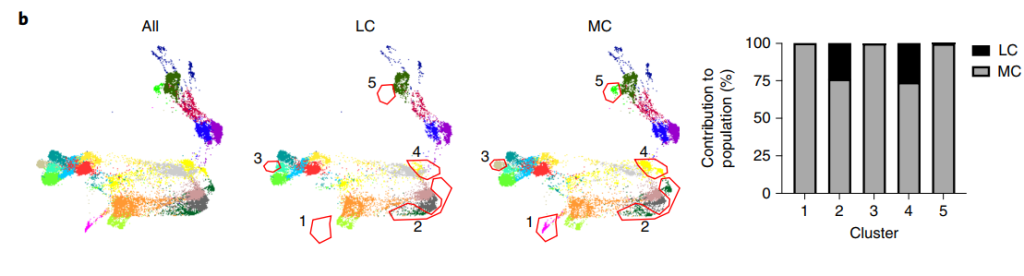
    Figure 1 Panels B and D showed flow cytometry quadrant plots for all data points. [1] The antibodies that recognize the surface markers are conjugated with different colored fluorescent tags.  Cells that are negative for both surface marker are in the lower left quadrant.  Those that are positive for both, in this case GP33 and Tim3 appear in the upper right quadrant.  Panel 1A is a series of histogram plots.  The X-axis is bins of signal intensity for the CD33 antibody.  The Y-axis is the counts, or number of cells with a given signal intensity.  GP33 appears to be a LCMV peptide.   These T cells in acute and/or chronic infections should recognize peptides from the surface of LCMV.       

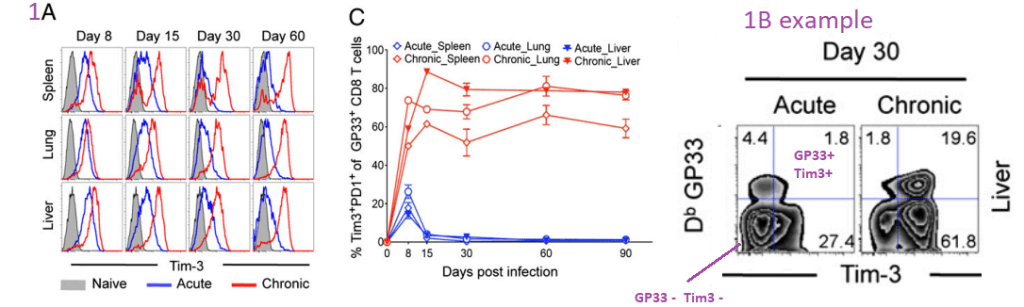
    Of all of the T tells that have receptors that bind to GP33, the majority also express Tim3 and PD1 receptors in chronic, but not acute infections. 

    Fig. 2 Co-expression of Tim-3 and PD-1 correlates with …

    more severe exhaustion of LCMV-specific CD8 T cells during chronic infection. Functions of
    Tim3+PD1+ or Tim3-PD1+ CD8 T cells were analyzed using splenocytes at day 50 after infection. [1]

    (A) This post is omitting panel on that demonstrates the isolation protocol.   

    (B) Frequency of GP33- or GP276-specific CD8 T cells producing cytokine after
    stimulation for 5 h with GP33-41 or GP276-286 peptides.  These cytokines seem to be in secretory granules or something.  Their synthesis and/or secretion is dependent on binding of peptides from the LCMV to the T cell receptors.  These panels examine the ratio of cells expressing producing cytokines to those T cells with receptors receptors that recognize LCMV peptides.  Having Tim3 and PD1 on the cell surface tends to correlate with low inflammatory cytokine

    (C) Frequency of Tim3+PD1+, Tim3-PD1+, or Tim3-PD1- CD8 T cells producing IL-10 was analyzed after stimulation for 5 h with the LCMV peptide. Data are representative of three independent experiments. Error bars represent SEM. LCMV   pool consists of GP33-41, GP276-2.  Note the lavender arrow that emphasizes the Tim3 negative status of the empty circles.  These T cells do not produce the inhibitory cytokine IL10. 

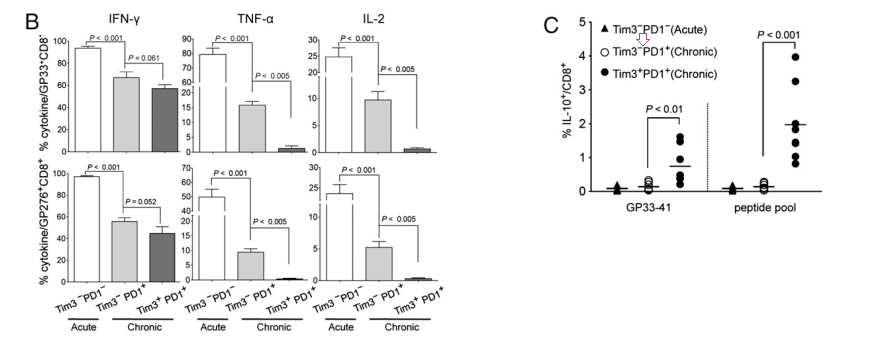
    Fig. 3. In vivo blockade of Tim-3 and PD-1 pathways

    enhances virus-specific CD8 T-cell responses during chronic viral infection. [1]

    Chronically infected C57BL/6 mice (80 d after infection) were treated every third day or every eeks other day for 2 wk with αPDL1 or Tim3Ig, respectively. Frequency of GP33-specific CD8 T cells before and after treatment of individual mouse is shown in the blood. Total number of GP33-specific CD8 T cells in the indicated
    tissues at 2 wk after treatment. Data are representative of three independent experiments with five to six mice per group in each experiment

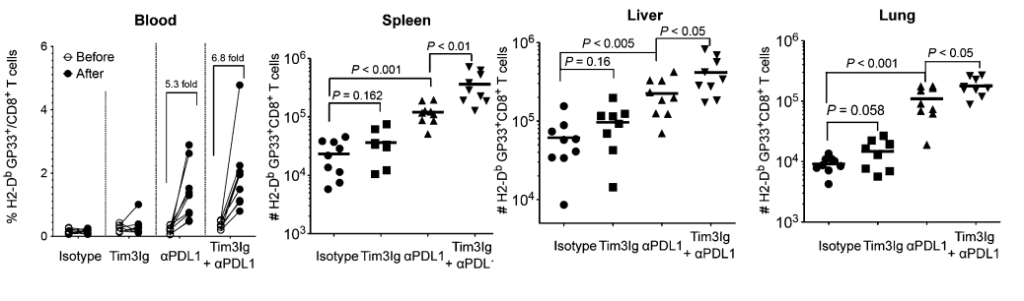
    In the three tissues but not the blood, just knocking down PDL1 increases the proportion of all CD8+ cytotoxic T cells that express the GP33+ receptors that recognize the LCMV peptides.

    Fig. 4. Dual blockade of Tim-3 and PD-1 pathways…

    enhances function in exhausted virus-specific CD8 T cells. [1]

    (A) IFN-γ production and degranulation by CD8 T cells in treated mice at 2 wk after therapy. The percentage of IFN-γ+CD107+ CD8 T cells specific for each of the LCMV peptides are summarized.

    (B) Polyfunctional (TNF-α+IFN-γ+) CD8 T cells in treated mice at 2 wk after therapy.

    (C) The proliferation of antigen specific CD8 T cell after dual blockade is shown as the percentage of Ki67+ on LCMV GP33-specific CD8 T cells. Data are representative of three independent experiments with five to six mice per group in each experiment.

    *P < 0.05; **P < 0.01

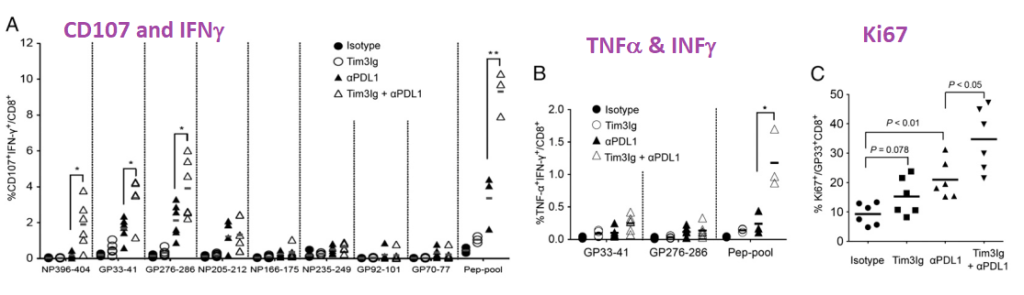
    While it takes the peptide pool to really get the T cells to crank out TNFα and INFγ, just peptides restricted to smaller regions of LCMV are effective in increasing T cell proliferation as measured by Ki67.

    Fig. 5. Dual blockade of Tim-3 and PD-1 pathways…

    enhances viral control. [1]
    Viral titer was determined by plaque assay in the blood before and after treatment. Viral load in spleen, liver, and lung at 2 wk after treatment is shown. Data are representative of three independent experiments with five to six mice per group in each experiment. Error bars represent standard error of the means.

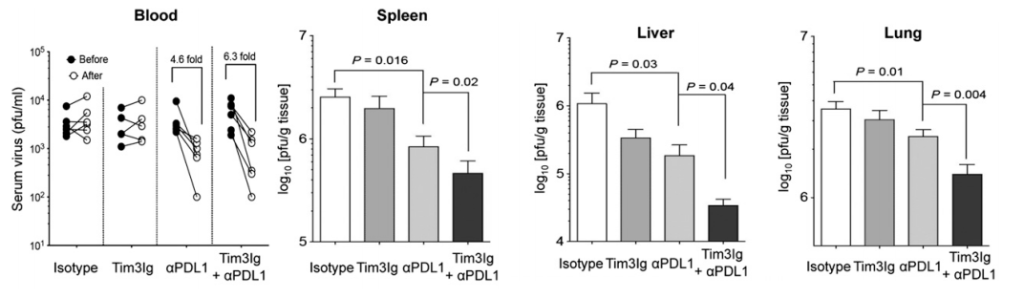
    Never mind the decreased proliferation and cytokine production by exhausted CD8+ T cells, inhibiting PD-1 and Tim-3 reduces the LCMV viral load in this mouse study. What if Long Covid really is a chronic infection that escapes the immune system? This site has covered the role of copper deficiency in T cell exhaustion. What if bolstering the mitochondria can prevent PD-1 from being expressed in the first place?

    It should also be noted that the PD1/PD-L1/Tim3 system plays a role in cancer and tuberculosis infections as well as transplanted organ tolerance and autoimmunity. [2] The Wolf review did not mention chronic Lyme Disease infections. These authors did go into the many ligands of Tim3 and the possible benefits of Tim3 ligand binding blockage.

    This story [1] is all very interesting, but what is the connection to the mitochondria?  This question was addressed by a human study of cancer patients with colorectal carcinoma on the PD1 antibody chemotherapy agent Nivolumab.  [2] Specifically, these patients had issues with CD8+ T cells that also expressed PD-1 and Tim3. [3]  Akagi and Baba covered many important points as to why they thought there was mitochondrial dysfunction and that the patients would benefit form H2 gas therapy.

    • Nivolumab cure rate of 20‑30% and needs a biomarker to distinguish responders from non-responders.  ,
    • These T cell dysfunctions of exhausted T cells are inversely correlated with decreased
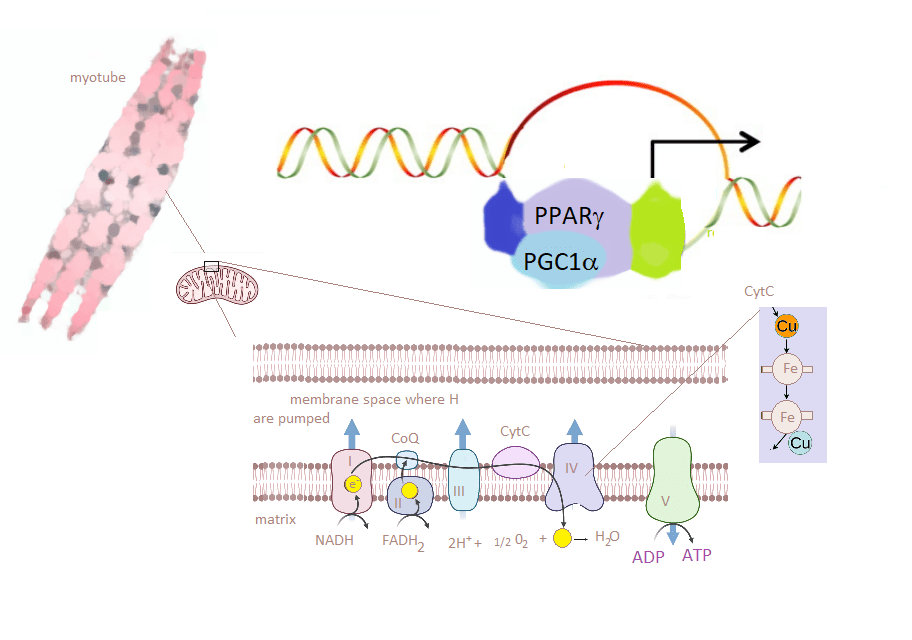
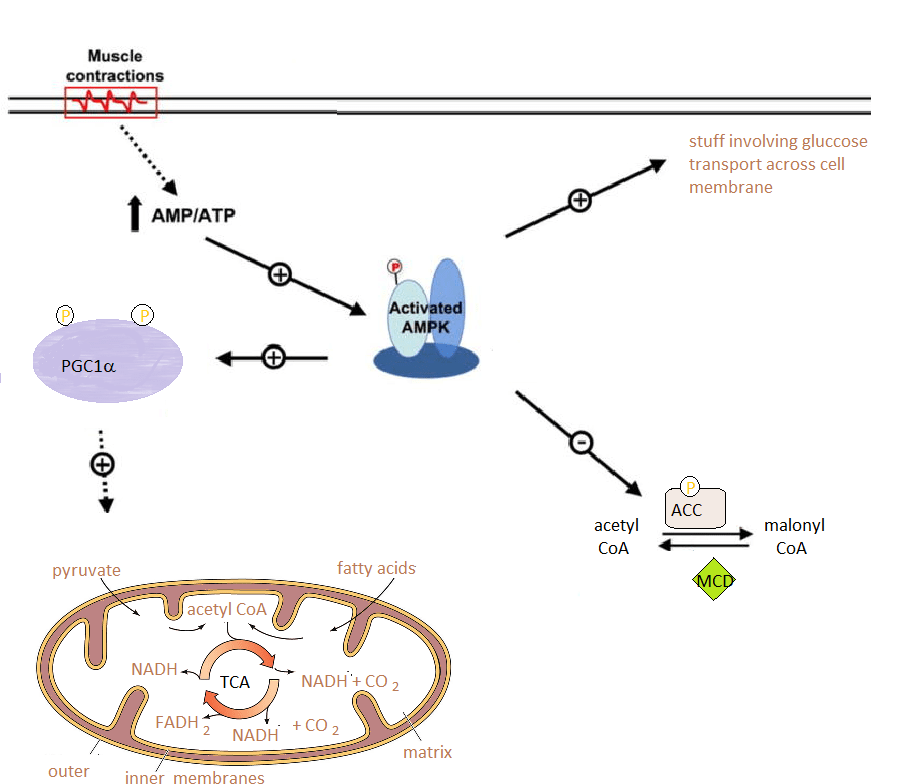
      mitochondrial function (3),
    • which is caused by progressive loss of peroxisome proliferator‑activated receptor‑γ coactivator 1α (PGC1α), a regulator of mitochondrial replication that is controlled by a variety of signaling pathways
    • (Akt, p38‑MARK, AMPK, SIRT1, PRMT1… Note that AMPK and SIRT1 pathways are connected with NAD+, ADP/ATP, and overall mitochondrial function. 
    • The authors reported that the proportion of PD‑1+terminal CD8+ T cells containing PDT+ and PDT‑ (exhausted CD8+T cells) in the peripheral blood of colorectal cancer patients was reduced by hydrogen gas, an activator of PGC1‑α,
    • They used serum coenzyme Q as a marker of mitochondrial function.  CoQ10 was in the serum was highly associated with patient prognosis.  [2]

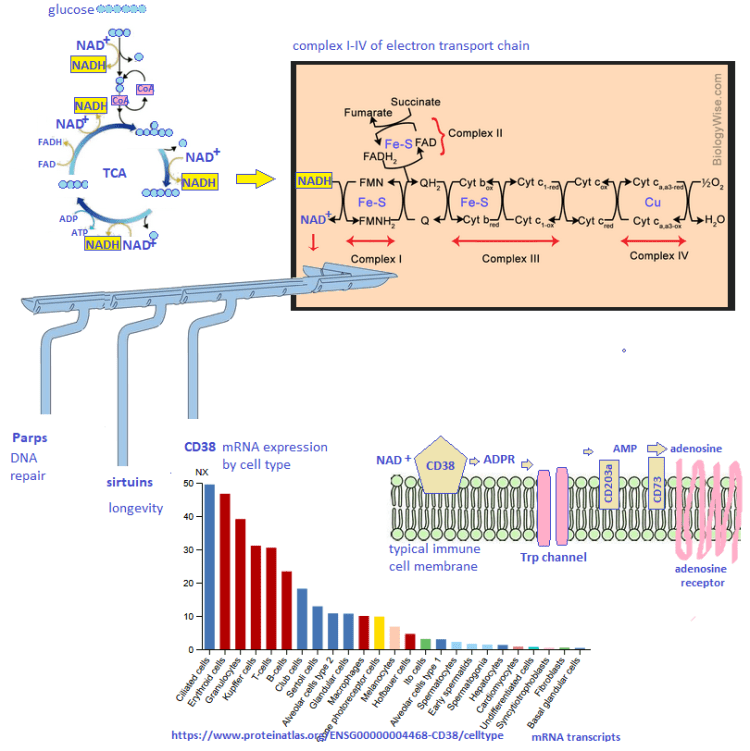
    The authors found that some patients responded to hydrogen gas and that others did not.  The PD1/Tim3 + T cells (PDT+) decreased with the H2 therapy.   PDT+ was inversely correlated with serum CoQ10.  The authors claimed no appropriate method to easily measure mitochondrial function.   They argued that CoQ10 is part of the electron transport chain.  If so, what is it doing in the serum?   The Seahorse respirometer is a not so easy way to measure cellular respiration as is cellular ATP content.  Akagi and Baba discussed NAD+ pathways and gene transcription. They also discussed the putative role of H2 in turning components of NAD+ and ADP/ATP ration gene transcription. So H2 has some benefit. It does not address the possibility that the antiviral cytotoxic T cell does not have enough nutrients to do its duty so it is expressing PD-1 so that it may be turned off.

    Onorati 2022 introduced the concept that the senescent associated secretory phenotype (SASP) upregulates PD-L1 expression.

    The Tchkonia review [4] discussed signaling pathways like p53/p21..

    Triggers may include DNA damage, reactive oxygen species, and protein aggregation. They introduced an interesting concept of “sterile inflammation” as opposed to inflammation that results from a pathogen infection.

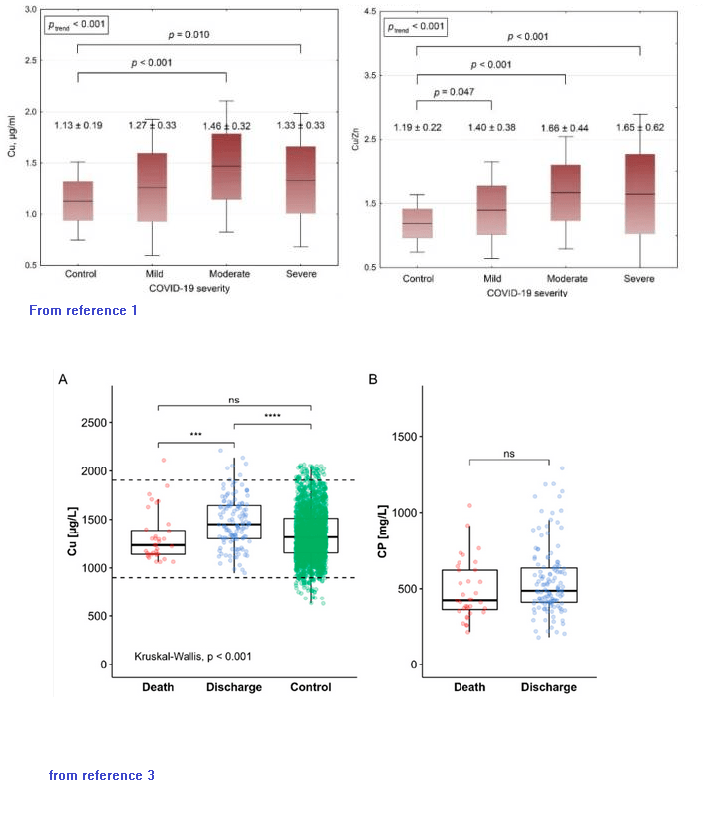
    The role of copper deficiency and mitochondria dysfunction was not discussed, but we think this may be relevant in aging. . The role of Cu/Zn superoxide dismutase was also not discussed in terms of reactive oxygen species.

    1. PD-L1 was increased in human diploid lung fibroblasts induced to undergo senescence.
    2. This induction requires the SASP
    3. The SASP “fires” through second messenger protein kinases called JAK-STAT
    4. mTOR, the nutrient sensing master regulator, is involved.
    5. PD-L1 is upregulated in interstitial lung disease.

    References

    1. Jin, H. T., Anderson, A. C., Tan, W. G., West, E. E., Ha, S. J., Araki, K., Freeman, G. J., Kuchroo, V. K., & Ahmed, R. (2010). Cooperation of Tim-3 and PD-1 in CD8 T-cell exhaustion during chronic viral infection. Proceedings of the National Academy of Sciences of the United States of America, 107(33), 14733–14738. PMC free article
    2. Wolf Y, Anderson AC, Kuchroo VK. TIM3 comes of age as an inhibitory receptor. Nat Rev Immunol. 2020 Mar;20(3):173-185. PMC free article
    3. Akagi J, Baba H. Hydrogen gas activates coenzyme Q10 to restore exhausted CD8+ T cells, especially PD-1+Tim3+terminal CD8+ T cells, leading to better nivolumab outcomes in patients with lung cancer. Oncol Lett. 2020 Nov;20(5):258 PMC free article
    4. Onorati A, Havas AP, Lin B, Rajagopal J, Sen P, Adams PD, Dou Z. Upregulation of PD-L1 in Senescence and Aging. Mol Cell Biol. 2022 Oct 20;42(10):e0017122. PMC free article
    5. Tchkonia T, Zhu Y, van Deursen J, Campisi J, Kirkland JL. Cellular senescence and the senescent secretory phenotype: therapeutic opportunities. J Clin Invest. 2013 Mar;123(3):966-72.  PMC free article
  • Long Covid Immune Dysfunction

    Phetsouphanh C, Darley DR, Wilson DB, Howe A, Munier CML, Patel SK, Juno JA, Burrell LM, Kent SJ, Dore GJ, Kelleher AD, Matthews GV. Immunological dysfunction persists for 8 months following initial mild-to-moderate SARS-CoV-2 infection. Nat Immunol. 2022 Feb;23(2):210-216. free article

    The previous post featured big data that really got out of hand became unrealistic for a small company to replicate in a clinical trial. Phetsouphanh et al from Feb 2022 really hit an realistic mark. This post features small data that we can use in a clinical trial.

    The study population

    This is what their population looked like. Long Covid patients are those who experienced symptoms four months after the active infection. UHC are unexpected healthy being those that were exposed but never got sick. The matched controls are patients who developed symptomatic Covid infections but were asymptomatic four months after the active infection.

    CharacteristicsLong Covid (LC)Matched control (MC)human coronovirusUHCs (St Vincent’s)UHCs (University of Melbourne)
    Number of samples3131251630
    Age (y), mean ± s.d.49.6 ± 14.948.9 ± 12.847.4 ± 16.937.13 ± 10.0248.13 ± 11.89
    Male, n (%)15 (48)15 (48)14 (54)8 (50)15 (50)
    Median days after positive SARS-CoV-2 PCR (IQR)128 (115–142)120 (115–142)N/AN/AN/A
    White, n (% total)28 (90)26 (84) 12 (75)N/A
    Severity, n (% total)
     Hospitalized8 (26)2/31 (6)   
     Community23 (74)29/31 (94)N/AN/AN/A
    Comorbidities, n (% total)12 (39)12 (39)N/AN/AN/A
    Transmission (acquired overseas), n (%)13 (42)15/31(48)N/AN/AN/A
    Phenotyping (n)1414N/A7–
    HCoV positive (n)––26––
    HKU-1  1  
    229E  14  
    NL63  14  
    OC43  10  
    ACE2 assay (n)  26–30
    Month 32629– â€“
    Month 52524– â€“
    Month 82729– â€“
    Age, gender, ethnicity and comorbidities within the cohorts sampled. Patients infected with HCoV who were PCR positive for 229E were also positive for NL63. N/A not applicable.

    1. Interferon β is the cytokine to watch

    An immediate surprise is that the IL-8 profiles in UHC that were different from the matched controls.

    two-tailed P values <0.05 (*), <0.01 (**), <0.001 (***) and<0.0001 (****)

    Interferon beta balances the expression of pro- and anti-inflammatory agents in the brain. ??? This one could be interesting in light of neurological symptoms in Long Covid. Interferon lambda are anti-viral and first line of defense of epithelial cells.

    CXCL9 promotes leukocyte differentiation and chemotaxis. CXCL10 is a chemotaxis factor for dendritic cells and macrophage. IL-8 us a neutrophil chemotaxic factor. sTIM-3 soluble T cell immunoglobulin mucin domain 3. The interferons were elevated in the Long Covid patients at 8 months compared to the matched controls.

    1b there’s something LC about the interferons

    Note the bars connecting the LC 8M and MC 8M showing that they are different at the p<0.01 or p<0.05 level of significance. We don’t see these differences for the other cytokines.

    two-tailed P values <0.05 (*), <0.01 (**), <0.001 (***) and<0.0001 (****)

    Soluble ACE2 enzyme activity was also measured but will not be reported in this post.

    2. What features define Long Covid?

    Because of the modest small sample size of 58 participants at month 8,
    the authors performed a technique called “bootstrapping” to randomly sample new samples from the population of 58 with replacement. The sampled population was then
    split 29:29 into test and train datasets. This seems to be some sort of machine learning thing we should consider learning. It seems to be a powerful way of sorting through big data diarrhea.

    IFN-β again comes out on top. When it comes to defining Long Covid, less (four features) is more (29 features).

    Number of featuresBest featuresAccuracyConfidence intervalF1 scoreConfidence interval
    2IFN-β, PTX30.7854±0.00190.7736±0.0025
    3IFN-β, PTX3, IFN-λ0.7968±0.00190.7852±0.0024
    4IFN-β, PTX3, IFN-λ2/3, IL-60.8159±0.00170.8053±0.0021
    29All0.7740±0.00180.7588±0.0084
    Table 2 Petsouphanh 2022.

    The next step was to ask how well do the other features predict the amount of the top feature IFN-β?

    Two-dimensional scatterplot separating LC (red dots) and MCs (blue dots) with a decision boundary (straight light) based on the concentrations of IFN-β and PTX3, IFN-β versus IFN-𝛾, IFN-β versus IFN-λ2/3 and IFN-β versus IL-6. Data points found above the decision boundary have a strong association with LC.

    These lines look like regression lines, but evidentially are not. It is interesting that IL-6 and INFγ are inversely related to the top Long Covid cytokine IFN-β. PTX3 and IFN-λ2/3 are directly related to IFN-β. This brings us back to comparing the four and eight month time frames. While all the cytokines go down in this period, only one remains elevated eight months post infection.

    Representation of the longitudinal levels of the five key cytokines. Data are shown as medians with error bars representing interquartile ranges (IQRs). Two-tailed P values <0.01 (**), <0.001 (***) and<0.0001 (****) were considered significant. A Wilcoxon t test was used for paired samples, and a Mann–Whitney t test was used for unpaired samples.

    3 from cytokines to T cell surface proteins

    These are the “clusters” of surface proteins on immune cells as defined by the figure legend for 3b.

    1. CD127lowGzmB-CCR7+CD45RA+CD27+ naive CD8+ T cells
    2. CD57+ highly cytotoxic (GPR56 + GzmB+) CD8+ T cells
    3. CD127lowTIM-3-CCR7+CD45RA+CD27+ naive CD4+ T cells
    4. CD3+CD4-CD8- innate-like T cells (may comprise natural killer T cells and γδ-T cells) and
    5. naïve CD127 low TIM-3-CD38 lowCD27-IgD+ B cells

    The color codes were not defined in the publication. Each of these cell surface markers is recognized by an antibody with a fluorescent tag.

    at 3 months

    Note that there are no representatives of any of these five populations at three months in the Long Covid population compared to the matched controls who got symptomatic Covid but were well at four months. Long Covid and Matched Control bars are the same at three months, before LC officially sets in, or something?

    a, Dimensional reduction utilizing
    TriMap and clustering with phenograph was used to visualize immune cell phenotypes. Five populations consisting of unactivated naive and cytotoxic
    phenotypes were absent in the LC group when compared to MCs at 3 months (n = 14, seven samples per group). Absent populations are outlined in red
    (middle and right panel), with median percentages of the LC and MC contribution to each cluster population shown in the bar graph.
    at 8 months

    By eight months clusters 2 and 4 are returning in the Long Covid patients.

    Unactivated naive T and B cell populations with low expression of CD127 and no TIM-3 expression remained absent in peripheral blood at 8 months in the LC group (clusters1, 3 and 5).
    Sorting out cell sub types

    CD38+ non lymphoid cells, monocytes, and peripheral dendritic cells are all elevated at 3 and 8 months post infection. The scholars on Wikipedia have posted some excellent information on CD38.

    1. As a receptor, CD38 can attach to CD31 on the surface of T cells, thereby activating those cells to produce a variety of cytokines. CD38 in some circles, perhaps the authors of this publication are one.
    2. CD38 “catalyzes the synthesis of ADP ribose (ADPR) (97%) and cyclic ADP-ribose (cADPR) (3%) from NAD+. CD38 is thought to be a major regulator of NAD+ levels, its NADase activity is much higher than its function as an ADP-rybosyl-cyclase: for every 100 molecules of NAD+ converted to ADP ribose it generates one molecule of cADPR. When nicotinic acid is present under acidic conditions, CD38 can hydrolyze nicotinamide adenine dinucleotide phosphate (NADP+) to NAADP.” The peer reviewed references on this Wikipedia post will be explore in greater detail as this is how Cu(I)NA2 must be working.
    Activated nonlymphoid (myeloid) cells with combined expression of CD38 and HLA-DR in the LC and MC groups at 3 months; levels were not significantly reduced at 8 months in the LC group. elevated levels of activated monocytes and pDCs were found in the LC group when compared to MCs at 3 and 8 months.

    CD4 is a glyco protein on the surface of T helper cells. It is a co-receptor for the T cell receptor that recognizes antigens in the MHC II complex of antigen presenting cells. There is no Long Covid action associated with this receptor. CD8 is like CD4 only it interacts with viral or cancer cell antigens in the MHC class I complex. MHC I is present in most nucleated cells. Presentation of antigens marks them for death by activating CD8+ cytotoxic T cells. MHC II is produced by professional antigen presenting cells, which may sometimes be lymphocytes. The CD4+ cells don’t matter in Long Covid. It is the CD8+ cells that matter.

    No difference in PD-1 levels was found on
    CD4+ T cells, but higher expression by CD8+ T cells was found in the LC group at both time points. Higher TIM-3 expression on CD8+ T cells was observed
    in the LC group at 3 months. Data are shown as median with IQR. Two-tailed P values <0.05 (*), <0.01 (**), <0.001 (***) and <0.0001 (****) were considered significant. A Wilcoxon t test was used for paired samples, and a Mann–Whitney t test was used for unpaired samples

    Tim-3, aka HAVCR2, is a binding partner of galectin. It may be present on the same T cell as the PD-1 programmed cell death receptor.

    This is in keeping with a mouse model of a chronic CMV infection study” In this study, we found that, although Tim-3 was transiently expressed by CD8 T cells after acute LCMV infection, it was rapidly down-regulated, whereas CD8 T cells retained high Tim-3 expression throughout chronic LCMV infection. Moreover, Tim-3 was mainly coexpressed with PD-1 on virus-specific CD8 T cells during chronic infections. Importantly, this subset of CD8 T cells coexpressing Tim-3 and PD-1 (Tim3+PD1+) showed the phenotypic and functional characteristics of more severely exhausted CD8 T cells than did those expressing only PD-1 (Tim3−PD1+). Finally, simultaneous in vivo blockade of Tim-3 and PD-1 pathways had synergistic effects in restoring antiviral immunity and viral control compared with blockade of either pathway alone. Collectively, these results indicate that Tim-3 and PD-1 pathways may cooperate and independently contribute to negatively regulate CD8 T cell responses during chronic viral infections. ” Jin et al 2010

    Where to go next...

    Things are starting to come into focus as to where we can go in this study. Here are some areas for more reading.

    1. INFβ is important in the nervous system. Could this cytokine explain some of the nervous system symptoms of Long Covid? Lot’s on PubMed to followup on
    2. CD38 in non lymphoid cells may or may not fit the Cu+ half of Cu(I)NA2, but it fits the niacin and NAD+ aspect of things.
    3. This research has backed up previous reports that PD-1 and CD8+ cytotoxicT cell exhaustion is important. We know from previous studies that Cu is important in preventing this. Even more exciting, PD-1/Tim-2 have been associated with T cell exhaustion with chronic viral infections.
  • How weight lifting increases mitochondria

    Uguccioni G, Hood DA. The importance of PGC-1α in contractile activity-induced mitochondrial adaptations. Am J Physiol Endocrinol Metab. 2011 PMC free article

    Introduction

    skeletal muscle has the ability to adapt to changes in metabolic demands by production of more proteins. Chronic contractile activity (CCA) is one of those metabolic demands. CCA results in production of more mitochondria. Only about 1% of the proteins in the mitochondria electron transport chain are coded for by mitochondrial DNA. The muscle must derive these transcripts from the chromosomal DNA in the nucleus. Prior to the featured study, peroxisome proliferator-activated receptor (PPAR)γ and its coactivator-1α (PGC-1α) were deemed critical to mitochondrial function, respiration, and biogenesis in skeletal muscle. Changes in PGC-1α mRNA correlated with changes in mitochondrial content as measured by cytochrome c oxidase (COX) activity. The scienific community had data from PGC-1α-knockout mice that were able to adapt to an exercise program and some contrasting data from animals with a muscle-specific deletion of PGC-1α. These authors used a contractile myotubule cell culture approach. To assess the role of PGC-1α they used silencing RNA to prevent the PGC-1α transcript from being translated into proteins.

    The purpose of the electron transport chain is to transport electrons (yellow circles) from NADH and FADH2 to O2. H2O is the byproduct. H+ are pumped into the membrane space. Energy from this gradient is used to generate ATP. Complex IV contains 13 subunits. Cox IV contains two coppers and irons (Fe).

    Some how or another CCA increases the protein levels of PGC-1α. We can hypothesize that this is somehow linked to ATP and its depletion by too much activity. PPAR)γ, PGC-1α and some other proteins increase the transcription of genes that code for mitochondrial proteins.

    Methods

    C2C12 murine skeletal muscle cells were proliferated in a nutrient rich medium containing some antibiotics and fetal bovine serum. When they became a bit crowded the fetal bovine serum was switched to adult horse serum. The result was myotubes that could contract in their comfy cell culture dishes.

    Two platinum wire electrodes 2 cm apart were inserted into the culture dish. Myotubes were subjected to electrical stimulation at a frequency of 5 Hz and an intensity of 9 V chronically for 3 h/day over 4 successive days shortly after they differentiated. Myotubes were allowed to rest for 21 h after each bout of contractile activity. The changed the medium 1 hr before exercise. This Chronic Contractile Activity went on for four days, proteins and messenger RNA (mRNA) were extracted.

    Results

    The cell culture model was validated by showing that CCA increased COX activity as well as O2 consumption. The silencing RNA was successful in decreasing PGC-1α mRNA levels to about 30% of the control.These results gave Uguccioni and Hood confidence in their model

    CCA increased protein levels of mitochondrial transcription factor Tfam and cytochrome C. PGC-1α silencing slightly decreased protein levels in resting but not CCA myotubules. Chronic contracting seemed to overcome this deficiency. This was not the case for COX IV. Because the silencing of was not complete, Uguccioni and Hood were able to show a nice, linear correlation between PGC-1α mRNA and COX activity.

    Chronic Contraction causes depletion of ATP and an increase it AMP. This activates autophosphorylation of AMPKinase. In addition to phosphorylating itself, PKA was shown to phosphorylate ACC which inhibits ACC and shifts the balance to acetyl CoA, which can be used by the mitochondria in the TCA cycle, which generates NADH and FADH to make ATP.

    AMP protein kinase is an enzyme that communicates decreases in ATP (adenosine triphosphate) and subsequent increases in adenosine monophosphate (AMP). AMPK accomplishes this task by attaching a phosphate to proteins starting with itself. Other targets include acetyl-CoA carboxylase 1 (ACC1) factors related to glucose trasnportacross the cell membrane. According to UniProt, PGC-1α has two AMPK phosphorylation site: threonine 178 and serine 539. Knocking down PGC-1α with silencing RNA increased some of these phosphorylations. We can hypothesize the myotubules not expanding mitochondria like nature intended them to.

    Conclusion

    This is how weight lifting increases mitochondria. There seems to be a huge link to COX IV and PGC-1α. The body builder may want to consider a copper supplement and then an iron supplement as these are cofactors in COX IV. Copper comes before iron because copper is required to absorb iron. See the ceruloplasmin post. CopperOne is just a more natural copper supplement because it is in the +1 oxidation state just like the Cox17 chaperone that loads cytochrome C oxidase of complex IV with Cu+1.

  • Protected: GSQ-30

    This content is password-protected. To view it, please enter the password below.

  • Protected: GSQ-30 for Long Covid

    This content is password-protected. To view it, please enter the password below.

  • Covid and serum copper

    Here is the latest on the subject:

    • A Russian group found that increases in serum copper as well as Cu/Zn serum ratios correlated with covid-19 severity [1]
    • A Chinese group looked at urinary trace element Levels in 210 urine specimens from the 138 severe and non-severe patients with COVID-19. [2] The reference range for Cu is [4.00–21.42] μg/L. Urine Cu was 15.84 (10.48–20.68) in mid Covid cases and 32.14 (17.22–75.43) in severe Covid cases. Urine Cu was significantly elevated in severe Covid (p <0.001). [2] When the trace elements in the urine were adjusted for creatinine, even more copper was being lost in the urine in severe Covid-19 cases. Accounting for glomerular filtration, Cu amounts were reported relative to creatinine. [2] The reference range is [4.39–13.37] μg/g creatinine. Average Cu (and range) in mid versus severe Covid were 15.55 (12.41–20.45) and 77.71 (32.04–248.28) μg/g creatine, respectively. (p < 0.001). Urinary creatinine-adjusted copper of ≥25.57 μg/g and ≥99.32 μg/g were associated with significantly increased risk of severe illness and fatal outcome in COVID-19, respectively.
    • A German group found that serum copper was higher in patients who were released from the hospital versus those that died. [3] No change was seen in ceruloplasmin. A caveat is that the ceruloplasmin activity was not measured.

    The German [3] and Russian [1] groups reported different control ranges for serum copper. The Chinese report suggests that large amounts of copper may be lost in the urine in severe Covid. [2] Could copper loading of ceruloplasmin be compromised in severe Covid?

    References

    1. Skalny, A. V., Timashev, P. S., Aschner, M., Aaseth, J., Chernova, L. N., Belyaev, V. E., Grabeklis, A. R., Notova, S. V., Lobinski, R., Tsatsakis, A., Svistunov, A. A., Fomin, V. V., Tinkov, A. A., & Glybochko, P. V. (2021). Serum Zinc, Copper, and Other Biometals Are Associated with COVID-19 Severity Markers. Metabolites, 11(4), 244. PMC free article
    2. Zeng, H. L., Zhang, B., Wang, X., Yang, Q., & Cheng, L. (2021). Urinary trace elements in association with disease severity and outcome in patients with COVID-19. Environmental research, 194, 110670. PMC free article
    3. Hackler J, Heller RA, Sun Q, Schwarzer M, Diegmann J, Bachmann M, Moghaddam A, Schomburg L. Relation of Serum Copper Status to Survival in COVID-19. Nutrients. 2021 May 31;13(6):1898. free article
  • Covid Autoantibodies

    The reports keep coming in. This update is all about muscle autoantibodies. A group out of the UK compared auto-antibodies from 84 Covid-19 patients with 32 individuals who had been in the intensive care unit for other reasons. The Covid-19 group was subdivided into 24 who had mild symptoms that did not require hospitalization, 25 with severe Covid-19 whose blood was drawn while in the intensive care, and 35 who had severe Covid-19 whose blood was drawn 3-6 months into recovery. [1] Groups 1-4 were scored via the WHO ordinal Covid-19 severity scale.

    1noCovid2acute3severe 6 mo4mild6 mo
    postot%postot%postot%postot%
    parietal cell2277.40250113630.6†42416.7
    smooth2277.40250113630.6†42416.7
    skeletal125442416.773619.4**0240
    cardiac2219.51147.1103627.8***0240
    Table 1 2 ref [1]Only showing tissues for which there are images. All autoantibodies are IgG [1]. ** p = 0.02 (group 2 versus group 3) *** p = 0.005 (group 3 versus group 4). † p = 0.006 (χ2 comparing all groups).

    The bottom line is that these antibodies are staining areas that also contain the cytoskeleton protein β-actin.

    Figure 1 Some close ups of Figure 2 ref [1]

    Rhodamine phalloidin is a dye that binds to this protein called actin. An internet search was performed to find images of gastric parietal cells minus ulcer causing bacteria, heart,

    Figure 2 Making sense of Figure 2 of reference [1]. A. Cell adhesion junctions adapted from StudyBlue. B. Actin stainiing of paretal cells. C. The sarcomer from Study Blue. Is valid for both cardiac and skeletal muscle. D. Actom staomomg of cardiac muscle. The red fluorescence corresponds to the A-band.

    There is a light area of disagreement with X-axis title in Figure 2 that is a bar graph that lists the percentage of patients in the four groups as a function of the independent variable of 0, 1, 2, and 3 auto antibodies. The heart and parietal cell auto antibody staining looks very much like actin staining with rhodamine phalloidin. Actin and α-actinin are proteins common to parietal cells and the three types of muscle. An autoantigen against α-actinin released from airway or GI tract epithelial cells may cross react with α-actinin isoforms found in smooth, skeletal and cardiac muscle. The Wikipedia actin page list the six isoforms of mammalian actin. This particular Wikipedia page has grown quite extensively in its coverage of the many binding partners of actin in multiple tissue types. The “tissue specific” auto antibodies that very much align where we expect to see actin, could be recognizing actin or anything that binds to actin.

    A group out of the United Kingdom took a different approach:

    1. They purchased recominant human IgG1 monoclonal antibodies made against Covid-19 spike protein S1 and S2 domains and SARS-CoV-2 nucleoprotein. [2]
    2. They purchased the following purified proteins: cardiolipin, actin, myelin basic protein (MBP), tropomyosin, ganglioside GM1, insulin, liver microsomes, transglutaminases (tTGs), enolase, beta-amyloid protein, tau protein, somatotropin, human serum albumin (HSA), and dipeptidylpeptidase.
    3. The ability of human and rabbit Covid-19 antibodies to react with their assortment of purified proteins was tested. They used optical density (OD) using an ELISA assay.
    4. Portions of the sequences of Covid-19 proteins were aligned with cytoplasmic actin
    AntigensSpike protein OD% reactivityNucleo
    protein OD
    % reactivityEnvelope protein OD% reactivityMembrane protein OD% reactivity
    SARS-CoV-23.4100 ++++3.76100 ++++3.68100 ++++3.78100 ++++
    Actin0.7417.6 +1.127.1 ++0.7818.0 +0.9522.2 +
    NFP1.9856 ++++0.428.5 +0.273.7 –251.1 +++
    Alpha-myosin0.7217.0 +0.8921.3 +0.366.2 +0.9421.2 +
    Tropomyosin0.211.2 –0.253.8 –0.253.1 –0.5812.1 +
    Int epi cells0.499.9 +0.469.6 +2.1356.0 ++++0.9522.2 +
    Table 2 From Table 1 reference [2] OD, optical density; NFP, ; Int epi cells, intestinal epithelial cells
    SARS-CoV-2 antigenSARS-CoV-2 sequenceMapped start to endActin sequenceID (%)
    Chain A, Spike proteinGKIQDSLSST16–25GSILASLS-T*60
    Chain A, Spike proteinSTEKSNII85–92STMKIKII*63
    Chain A, Spike proteinIGAGICAS697–704IGGSILAS*63
    Chain A, Spike proteinPS–GRLVPR1,210–1,217PSIVGR–P60
    Chain A, NucleoproteinSSSTKKS15–21SSSLEKS71
    Chain A, NucleoproteinTEGALNTPK90–98TEAPLN-PK67
    Chain A, Spike proteinSVLYNSASFSTF33–44SIL—ASLSTF**58
    Chain B, Spike proteinSVLYNSASFSTF48–59SIL—ASLSTF**58
    Chain C, Spike proteinSVLYNSASFSTF48–59SIL—ASLSTF**58
    Chain E, Spike proteinSVLYNSASFSTF37–48SIL—ASLSTF**58
    Chain E, Spike receptor binding domainSVLYNSASFSTF48–59SIL—ASLSTF**58
    FTable 3i From reference [2] regions of Covid-19/SAR-Cov2 that share homology with human β actin.

    The human cytoplasmic β-actin as protein blasted against the human database. β-actin shares 94-99% sequence homology to the other five isoforms of mammalian actin.

    Figure 3 Blastp results from www.ncbi.nlm.nh.gov/protein

    Since we have been examining cardiac tissue in Figure 1 and 2, Figure 3 shows the alignment between and cardiac actin. The top line is the sequence of β-actin, the third cardiac actin, and the middle the sequence homology. A “+” indicates substitution with a similar amino acid . Regions that share homology with Covid protein are highlighted. Note that these overlapping regions also share homology with cardiac actin. Table 5 from reference [2] contains some homology between non spike proteins and β-actin. These include some non structural proteins and helicases.

    Figure 4 Alignment of β-actin and cardiac actin with sequences homologous to all the Covid-19 proteins discussed in reference [2]

    Coivd-19 patient sera certainly seem to have antibodies that bind to actin in a variety of tissue sections. [1] This report stopped short of showing that these polyclonal antibodies actually recognized actin. [1] Another report demonstrated binding of human recombinant monoclonal antibodies can recognize purified actin. [2] This report offered some nice speculations as to molecular mimicry with the spike protein and other Covid proteins. The implication of the latter report are interesting in that they suggest the potential for developing a Long Covid auto immune disorder from the vaccine. Finally, autoantibodies against an extremely abunant protein like actin imply a major immune response to even a slight injury that releases actin into the circulation. The high degree of homology between actin isoforms of actin only more problematic.

    References

    1. Richter AG, Shields AM, Karim A, Birch D, Faustini SE, Steadman L, Ward K, Plant T, Reynolds G, Veenith T, Cunningham AF, Drayson MT, Wraith DC. Establishing the prevalence of common tissue-specific autoantibodies following severe acute respiratory syndrome coronavirus 2 infection. Clin Exp Immunol. 2021 Jun 3. free article
    2. Vojdani, A., Vojdani, E., & Kharrazian, D. (2021). Reaction of Human Monoclonal Antibodies to SARS-CoV-2 Proteins With Tissue Antigens: Implications for Autoimmune Diseases. Frontiers in immunology, 11, 617089. PMC free article
  • SPECT and brain directed nutrients

    This post covers work of Daniel Amen. .. ir just a very small bit of a large amount. Dr Amens has become a celebrity over promoting SPECT imaging, “blood Flow” through various regions of the brain, and of course brain directed nutrients to restore “blood flow” to normal. Purists may associate “flow” with a unit volume per unit time such as mL per minute. Mayo Clinic breaks down single-photon emission computerized tomography (SPECT) imaging in simple steps: (1) inject patient with γ radiation emitting compound. (2) The patient allows the compound to partition from blood to tissues of the body for 20 minutes or more. (3) The image is acquired. (4) The patient is asked to drink plenty of fluids to encourage the compound to partition back into the blood where it can be eliminated in the urine.

    What am I looking at?

    Technetium (99mTc) exametazime is very simply a radioactive agent that emits a photon of the gamma radiation wavelength. It is used to measure blood distribution in tissue. It should not be confused with Fluorodeoxyglucose (18F) used in positron emission tomography PET. The latter measures uptake of glucose assumed to be related to the metabolic activity of a tissue. The active rendering of blood flow is petty straight forward. One just needs to be constantly aware of the color code.

    Technetium tc 99m exametazime is the gamma photo emitting agent to measure blood flow. The blue and white o,age represents active flow from, reference [1] Figure 2. The rainbow images are from reference [1] figure 4. The equation was used in the reference [2] study

    The surface rendering is difficult for many to conceptualize. The colors themselves seem to have little bearing on the flow. Pure green, cyan, orange, and red are all the same flow going down into the brain. Gray shades of the colors indicate <45% of the average perfusion. [1]

    You are looking at different renderings to make statements

    On an anxiety page the Amen group makes a point that there is high relative blood flow in the cerebellum of normal and in individuals with anxiety. Basal ganglia blood flow in the person with anxiety is high compared to the normal control. The activity rendering is an excellent way to locate the region of increased blood flow and gives the patient peace of mind that there is indeed something tangible out of order in their brain. It gives the psychiatrist some insight on possible medications. Interestingly, the sight on anxiety is linked to a sight on marijuana, a plant based medicine used to treat anxiety.

    Both sets of images are from the amenclinics.com website.

    The surface rendered healthy brain has some grayish dips indicating somewhat lower blood flow in regions below the surface. The cerebellum is bright and shiny smooth in this surface rendering of a healthy brain. The marijuana user’s brain is full of pot holes indicating substantial regions of decreased blood flow. We were not told how much THC was in the system of the patient at the time of the scan. Was this patient self medicating with mmj and just missed the mark by decreasing more than the intended brain activity? The “Swiss cheese” surface rendering of the mmj patient’s brain would make a more powerful statement than a nice, calm, mostly blue activity rendering. Finding surface abd activity plots of habitual coffee drinkers before and after the morning cup is a bit more difficult.

    Excess body weight and brain blood flow

    Blood flow was compared among the following group of patients: underweight (BMI < 18.5), normal weight (BMI 18.5–24.9), overweight (BMI 25–29.9), obese (BMI≥30), morbidly obese (BMI≥40). [2] All subjects received intravenous administration of an age- and weight-appropriate dose of technetium-99m hexamethylpropylene amine oxime (99mTc-HMPAO) for brain SPECT imaging. Each subject received a resting, or baseline, scan and a task. [2] What was not clear was if 99mTc-HMPAO partitioned into adipose tissue. If so, it would not be enough to simply assume that morbidly obese patients have more blood than their underweight counterparts.

    From reference [2] Figure 6. All three subjects were 40 year old males. The arrow points to a region of hyper perfusion. This arrow did not appear in the original publication.

    The authors reported a pattern across virtually all brain regions in which a decline in cerebral perfusion inversely correlated with BMI. Flow was best in the under weight and wose in the morbidly obese. [2] The authors reported no regions that showed elevated perfusion in relation to higher BMI. [2] To have a small region of hyper perfusion (arrow) suggests that decreased flow as BMI increases is not an artifact of the detector partitioning into adipose tissue.

    The Brain Directed Nutrients (BDN) Clinical Trial

    The Goal was to determine whether supplementation with BDNs improved cerebral blood flow CBF and neuropsychological function in healthy individuals. The participants were randomized to receive the BDN or a placebo for two months. [3] Neither the investigators nor the participants knew whether they were receiving the placebo or BDN. At the end of two months the groups crossed over. The placebo group got the BDN and the BDN group crossed over to receiving the placebo. [3] This study was conducted at the Amen Clinic in Newport Beach, CA. The participants included 30 locals, 15 of which were men and the other 15 women. Five participants failed to complete the study for reasons unrelated to the study. In a cross over design participants were given a baseline brain scan and then a placebo or brain directed nutrients for two months. At the end f this time they were given another brain scan and the same tests. Then the participants crossed over: the placebo group got the BDN and the BDN group got the placebo for two months. At the end of four months the participants were given a third brain scan and the same tests.

    The treatments
    1. fish oil, 2.8 g per day
    2. multivitamins and minerals that include 1mg copper glycinate and 30 mg nicotinamide
    3. A mixture of small molecule anti oxidants and hormone modulators that included huperzine A, Ginkgo biloba, and N-acetyl cysteine and sodium/copper chlorophyllin
    4. some digestive enzymes, which are technically large molecules, were also included

    In the placebo treatment rice flour to replace all BND components except the fish oil. A mixture of undisclosed vegetable oils was used to replace the fish oil.

    Outcome measures, results

    Let’s take a look at a table reporting significant changes in well defined regions of the brain. Some images of major blood vessels in the brain are included to make a point that changes in blood flow depend on smooth muscle in the major vessels as well as smaller arterioles and venules.

    Table from reference [3] https://neupsykey.com/blood-supply-of-the-brain/

    As one might expect, cognitive test scores improve the more times the test is taken.

    aInteraction of treatment order and treatment condition for memory; means and 95% confidence intervals are shown. The response is linear
    when BDNs are given first compared to a quadratic response when BDNs are given second, regressing from baseline to treatment to placebo[3]

    Significant improvements were observed for the BDNs

    1. MicroCog—reasoning, P = .008
    2. memory, P = .014
    3. information processing accuracy, P = .027
    4. WebNeuro—executive function, P = .002
    5. information processing efficiency, P = .015
    6. depressed mood, P = .017
    7. emotional identification, P = .041
    8. BSI—positive symptom total, P = .024

    A reduction in the hostility score was seen. P = .018. Adjusting for the effect of order was required to reach significance. [3]

    Conclusions… sort of

    It is fairly easy to see why Dr Daniel Amen has achieved celebrity status with his mixture of psychiatry and SPECT imaging. He sells peace of mind of seeing proof that something no so good is going on in a person’s brain in a non insurance funded sort of way. Proper presentation of the data can encourage and/or guide healthy living. In true MD fashion, the BDN are “everything but the kitchen sink” to reduce oxidative stress that might be causing reduced blood flow, excitotoxicity, and so on. This latter was not a study to establish a mechanism. The trial did offer convincing evidence that the Amen group is on the right tack.

    References

    1. Amen D. Brain SPECT imaging in clinical practice. Am J Psychiatry. 2010 Sep;167(9):1125; author reply 1125-6.
    2. Amen, D. G., Wu, J., George, N., & Newberg, A. (2020). Patterns of Regional Cerebral Blood Flow as a Function of Obesity in Adults. Journal of Alzheimer’s disease : JAD, 77(3), 1331–1337. PMC free article
    3. Amen DG, Taylor DV, Ojala K, Kaur J, Willeumier K. (2013) Effects of brain-directed nutrients on cerebral blood flow and neuropsychological testing: a randomized, double-blind, placebo-controlled, crossover trial. Adv Mind Body Med. 2013 Spring;27(2):24-33.
  • ANS Questionnaires

    This post is not intended to make any medical claims to treat Long Covid, Post Treatment Lyme Disease, or any other post infection chronic condition. In a previous post different tests were reviewed to The maker of CopperOne would like to conduct clinical trials so that such claims could legitimately be made. Questionnaires are great. They minimize the use of needles for blood draws. Redman and coworkers administered many neurological questionnaires. [1] This test was published in a journal that seems to have died out. http://orthomolecular.org/library/jom/index.shtml

    The trouble with our last clinical trial is that the participants may have gotten bored answering the two questionnaires and and might have checked boxes without thinking. This gem published back in 1977 seems to be more interesting and to the point. The literature on Covid-19 and the autonomic nervous system is impressive. Dividing symptoms between sympathetic and parasympathetic branches is less common. We have covered how Long Covid symptoms are extremely similar to post treatment Lyme Disease (PTLD).

    As a Long Covid or PTLD patient, do you see yourself in these questions? Does the switch from the cholinergic to the adrenergic questions force you to pay attention?

    symptom15 points10 points5 points0 points
    symptomvery frequentlyoftensometimesrare or never
    diarrhea    
    heartburn    
    urge to frequent urination    
    one or more muscle feel weak    
    sleeping more than usual    
    flushing of the face    
    waterish mouth    
    excessive appetite    
    feel sexually aroused    
    have difficulty breathing    
    dry palms    
     Begin Cholinergic    
    constipation    
    one or more muscles feel tense    
    sleeping less than usual    
    palor of face    
    cold feet    
    wet hands    
    we armpits    
    heart palpitations    
    dry mouth    
    goose pimples    
    butterflies in stomach    
    poor appetite    
    From reference [2] Frequency of the symptoms were given the following values: very often —15; often —10; sometimes—5; and rare or never—0.

    If you already are a CopperOne customer, did the answers to any of these questions change when you started?

    Referees

    1. Rebman AW, Bechtold KT, Yang T, et al. . The clinical, symptom, and quality-of-life characterization of a well-defined group of patients with posttreatment Lyme disease syndrome. Front. Med. 2017;4:224 10.3389/fmed.2017.00224 [PMC free article]
    2. Neziroglul F and Yaryura-Tobias J A (1977) Development of an Autonomic Nervous System Questionnaire: Diagnostic Aid in Measurement ofAnxiety, Depression, and Aggression. Orthomolecular Psychiatry vol 6, no 3, 1977, Pp. 265-271 free article

  • Post Treatment Lyme Disease

    Post Treatment Lyme Disease

    While the world is focused on active and Long Covid, Post Treatment Lyme Disease has many overlapping symptoms. These symptoms have been discussed in the Long Haul Covid post. We have heard plenty about the Covid-19 spike protein and the ACE2 receptor. Borrelia burgdorferi, the bacterium that causes Lyme Disease is a bit more complicated. Figure 1A was taken from the Linder Lab website.

    Figure 1. The Daam1 cytoskeletal protein plays a role in internalization of Borrelia A From the Linder Lab website. B. Daam1 mRNA expression in a variety of cell types from ProteinAtlas. RNA single cell type specificity: Cell type enhanced (Basal keratinocytes)

    Some of the cell types that express Daam1 (Dishevelled associated activator of morphogenesis 1) might come into our discussion of PTLD and its similarities to Long Covid. The Gilmore Laboratory of the CDC in Fort Collins, CO, USA found that B burgdorferi surface lipoprotein, BBA66, bound the FH2 subunit domain of Daam1. [1] These authors used two neuroglioma cell lines H4 and HS683. [1] To summarize, BBA66 appears to be the equivalent of the Covid-19 spike protein and Damm1 the equivalent of the ACE2 receptor.

    Post Treatment Lyme Disease vs Long Covid

    It has been suggested that Long Covid will join the ranks of PTLD, myalgic encephalomyelitis /chronic fatigue syndrome, and fibromyalgia post infection syndromes. [5]

    Of all of these reported symptoms of PTLD, which ones are best for differentiating recovered patients from those that remain sick form Borrelia or some non related condition? A very large group used a Logistic Regression model and a Decision Tree model. [6] The model development group consisted of 14 recovered and 15 individuals with PTLD symptoms. [6] The validation group included consisted of 13 recovered and 10 with PTLD symptoms. [6] The authors used many different functional questionnaires. They narrowed them down to Three: Neuro-QoL Fatigue t-score (QoLFatigue), the

    • Neuro-QoL Fatigue t-score (QoLFatigue)
    • SF-36 Physical Functioning norm-based score (PF)
    • SF-36 Mental Health component score (MCS)

    logit (Pr(Y=PTLD))=49.66+0.14x(QoL Fatigue)-0.24x(PF)-0.76x(MCF)

    Wikipedia gives a better explanation of the logit function of the probability of having PTLD based on independent variables of three test scores. This is basically an equation of a straight line in four dimensional space. The authors also discussed correlation of individual PTLD symptoms with one another. Sleep disturbance, fatigue, pain and cognitive complaints were found to interrelate. [6] Given the role of the locus ceruleus and the copper cofactor dopamine beta hydrolase in the sleep-wake cycle. Sleep quality was reported as prominent symptom one year after the active infection in PTLD. [7]

    Post Treatment Lyme Disease vs Long Covid

    Post treatment Lyme Disease [2]Long Covid-19 symptoms [3,4]comments
    fatiguefatigue PTLD 3/4th have moderate to severe
    neck painstiff neck 
    Cough 
    Joint/muscle painJoint/Muscle pain PTLD patients tend to have both
    memory memory a problem in LC
    Finding words finding words 
    sleep sleep, insomnia 
    Head acheHead ache Almost 75% in  PTLD
     Paresthesia (hands/feet)pins and needles 
    irritability irritability and anxiety 
    Low back pain PTLD almost 75% mild to severe
    photophobia  Daam1 is in retina cells
    dizziness POTS not sure if these are same
    Visual clarity double vision & more 
    Coordination  
    sweats flushing, sweats 
     Lyme CarditisHeart palpitations part of PTLD?
     depressionDepression Tends to be mild in PTLD
     Focusing/concentratingBrain fog 
    Fever or chillsIntermittent fever Chills more common in PTLD
    Paresthesia face/scalp facial numbness 
    Breathing difficulties shortness of breath 
    Urination changes  
    Nausea diarrhea Between 25-50% in PTLD

    Table 1 comparison of PTLD and Long Covid (LC) symptoms

    It has been suggested that Long Covid will join the ranks of PTLD, myalgic encephalomyelitis /chronic fatigue syndrome, and fibromyalgia post infection syndromes. [5]

    Of all of these reported symptoms of PTLD, which ones are best for differentiating recovered patients from those that remain sick form Borrelia or some non related condition? A very large group used a Logistic Regression model and a Decision Tree model. [6] The model development group consisted of 14 recovered and 15 individuals with PTLD symptoms. [6] The validation group included consisted of 13 recovered and 10 with PTLD symptoms. [6] The authors used many different functional questionnaires. They narrowed them down to Three: Neuro-QoL Fatigue t-score (QoLFatigue), the

    • Neuro-QoL Fatigue t-score (QoLFatigue)
    • SF-36 Physical Functioning norm-based score (PF)
    • SF-36 Mental Health component score (MCS)

    logit (Pr(Y=PTLD))=49.66+0.14x(QoL Fatigue)-0.24x(PF)-0.76x(MCF)

    Wikipedia gives a better explanation of the logit function of the probability of having PTLD based on independent variables of three test scores. This is basically an equation of a straight line in four dimensional space. The authors also discussed correlation of individual PTLD symptoms with one another. Sleep disturbance, fatigue, pain and cognitive complaints were found to interrelate. [6] Given the role of the locus ceruleus and the copper cofactor dopamine beta hydrolase in the sleep-wake cycle. Sleep quality was reported as prominent symptom one year after the active infection in PTLD. [7]

    Is PTLD a disease of oxidative stress?

    A large group form John Hopkins University School of Medicine used the translocator protein ( TSPO) substrate [11C]DPA-713 to image the brains of patients with PTLD. The translocator protein TSPO is a mitochondrial membrane protein that transports Cholesterol and porphyrins and heme (By similarity) into the mitochondria. [8] A recent review [9] on the influence of TSPO activation and supression on ATP production and subsequent generation of ATP suggests heme transport to the electron transport chain. The expression of TSPO was considered a marker of activated microglia. Activated microglia are phagocytic, cytokine secreted, and antigen presenting immune cells.

    Figure 2 from reference [9]. The presence of TSPO suggests activated microglia and some trauma that resulted in their activation.

    In the brains of PTLD patients [11C]DPA-713 binding to its target TSPO was increased in the cerebellum, frontal cortex, parietal cortex, thalamus, temporal cortex, and cingulate cortex after controlling for age, BMI, and TSPO genotype. [8]

    What this may mean for CopperOne

    We don’t know for sure. We don’t know the relative contributions of super oxide and whether a little extra copper would mitigate damage that result for microglia activation. PET imaging with [11C]DPA-713 has become a popular tool for many neuro inflammatory diseases. The PET images only capture one aspect of reactive microglia. Surely the questionnaires, blood cytokines, and serum SOD activity could fill in some gaps.

    References

    1. Williams, S. K., Weiner, Z. P., & Gilmore, R. D. (2018). Human neuroglial cells internalize Borrelia burgdorferi by coiling phagocytosis mediated by Daam1. PloS one, 13(5), e0197413. PMC free article
    2. Rebman, A. W., & Aucott, J. N. (2020). Post-treatment Lyme Disease as a Model for Persistent Symptoms in Lyme Disease. Frontiers in medicine, 7, 57. PMC free article
    3. https://www.cdc.gov/coronavirus/2019-ncov/long-term-effects.html
    4. Davis HE, Assaf GS, McCorkell L, Wei H, Low RJ, Reeme Y, Redfield S, Austin JP, Akrami A.Characterizing Long COVID in an International Cohort: 7 Months of Symptoms and Their Impact Cross Ref
    5. Aucott, J. N., & Rebman, A. W. (2021). Long-haul COVID: heed the lessons from other infection-triggered illnesses. Lancet (London, England), 397(10278), 967–968. PMC free article
    6. Turk, S. P., Lumbard, K., Liepshutz, K., Williams, C., Hu, L., Dardick, K., Wormser, G. P., Norville, J., Scavarda, C., McKenna, D., Follmann, D., & Marques, A. (2019). Post-treatment Lyme disease symptoms score: Developing a new tool for research. PloS one, 14(11), e0225012. PMC free article
    7. Weinstein ER, Rebman AW, Aucott JN, Johnson-Greene D, Bechtold KT. (2018) Sleep quality in well-defined Lyme disease: a clinical cohort study in Maryland. Sleep. 2018 May 1;41(5)
    1. Williams, S. K., Weiner, Z. P., & Gilmore, R. D. (2018). Human neuroglial cells internalize Borrelia burgdorferi by coiling phagocytosis mediated by Daam1. PloS one, 13(5), e0197413. PMC free article
    2. Rebman, A. W., & Aucott, J. N. (2020). Post-treatment Lyme Disease as a Model for Persistent Symptoms in Lyme Disease. Frontiers in medicine, 7, 57. PMC free article
    3. https://www.cdc.gov/coronavirus/2019-ncov/long-term-effects.html
    4. Davis HE, Assaf GS, McCorkell L, Wei H, Low RJ, Reeme Y, Redfield S, Austin JP, Akrami A.Characterizing Long COVID in an International Cohort: 7 Months of Symptoms and Their Impact Cross Ref
    5. Turk, S. P., Lumbard, K., Liepshutz, K., Williams, C., Hu, L., Dardick, K., Wormser, G. P., Norville, J., Scavarda, C., McKenna, D., Follmann, D., & Marques, A. (2019). Post-treatment Lyme disease symptoms score: Developing a new tool for research. PloS one, 14(11), e0225012. PMC free article
    6. Aucott, J. N., & Rebman, A. W. (2021). Long-haul COVID: heed the lessons from other infection-triggered illnesses. Lancet (London, England), 397(10278), 967–968. PMC free article
    7. Weinstein ER, Rebman AW, Aucott JN, Johnson-Greene D, Bechtold KT. (2018) Sleep quality in well-defined Lyme disease: a clinical cohort study in Maryland. Sleep. 2018 May 1;41(5)
    8. Coughlin, J. M., Yang, T., Rebman, A. W., Bechtold, K. T., Du, Y., Mathews, W. B., Lesniak, W. G., Mihm, E. A., Frey, S. M., Marshall, E. S., Rosenthal, H. B., Reekie, T. A., Kassiou, M., Dannals, R. F., Soloski, M. J., Aucott, J. N., & Pomper, M. G. (2018). Imaging glial activation in patients with post-treatment Lyme disease symptoms: a pilot study using [11C]DPA-713 PET. Journal of neuroinflammation, 15(1), 346. PMC free article
    9. Betlazar, C., Middleton, R. J., Banati, R., & Liu, G. J. (2020). The Translocator Protein (TSPO) in Mitochondrial Bioenergetics and Immune Processes. Cells, 9(2), 512. PMC free article