Wikipedia has a good page on AL amyloidosis. “AL” stands for amyloid light chain. The light chains are part of the antibody molecule. AL is linked to diseases associated with increased antibody production: B cell myeloma and Waldenström’s macroglobulinemia. The Wikipedia authors did not mention of the therapeutic antibodies being injected into patients to treat what seems like every conceivable disease. We can only hope that these therapeutic antibodies are fully assembled and do not contain rogue light chains that can form amyloids and other toxic compounds with Cu(II)
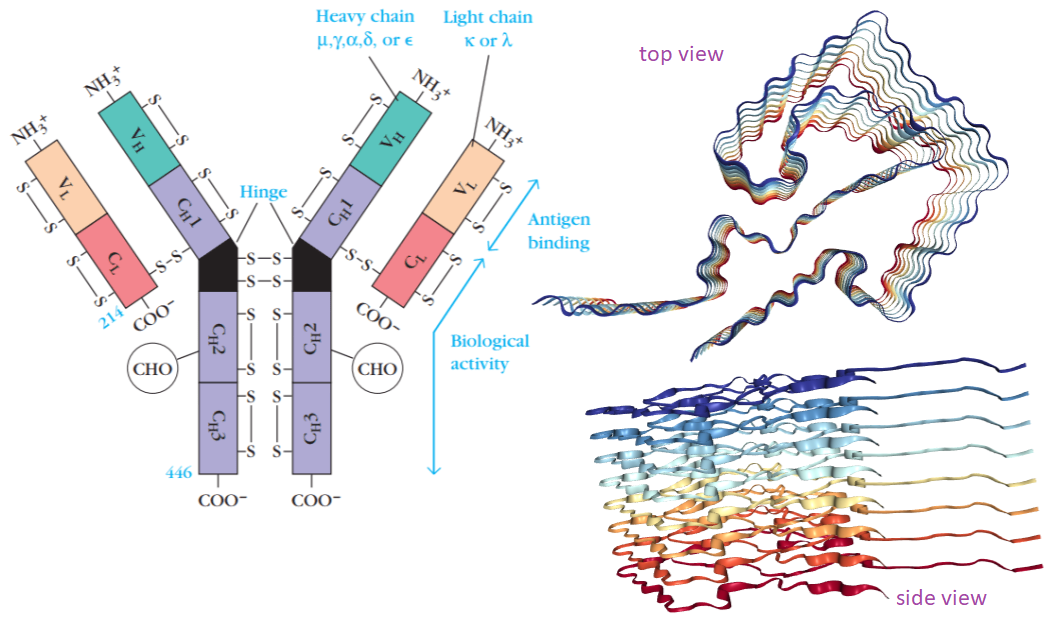
What is an amyloid anyway? The featured image comes from a structure deposited on RCSB.org, a public access database of protein structures. The image of the IgG antibody molecule was obtained from this link. Note the presence of disulfide bonds (S-S) in the light chains. Also note that the light chain has a constant CL and a variable VL region. For readers that like to attribute human characteristics to molecules, it is as if the misfolded deep red light chain says to a red/orange light chain buddy in the process of folding and getting attached to a heavy chain, “Why do you want to conform when you can be deviant like me?” Deep Red and Red Orange spoon together in the same deviant pattern. Then the deviant pair say to the orange light chain in line to be made into an antibody, “Why are you conforming when you can be deviant?” The deviant trio recruit the Bright Yellow light chain into their pack of biological aberration. The pack grows and grows until they become large enough to get trapped in places where they can cause trouble. The heart, of course the heart! The reader is invited to go to the RCSB.org, website and rotate the structure around to get a feel for what an amyloid really is. The curious thing is that this structure is based on a fibril isolated from an actual patient. [1] How scary is that?
Basics of the amyloid structure
Radamaker and colleagues from several universities in Germany isolated AL amyloid fibrils from the heart of a woman suffering from advanced heart failure due to AL amyloidosis. [1] The patient was diagnosed with a monoclonal plasma cell disorder called “smoldering myeloma” one year before she was diagnosed at the same time as AL amyloidosis. The patient was treated for the bone marrow plasma cell cancer but required a heart transplantation anyway due to amyloid deposit build up in her heart. [1] The authors used an established protocol to isolate the amyoid fibrils from her diseased heart. [1]
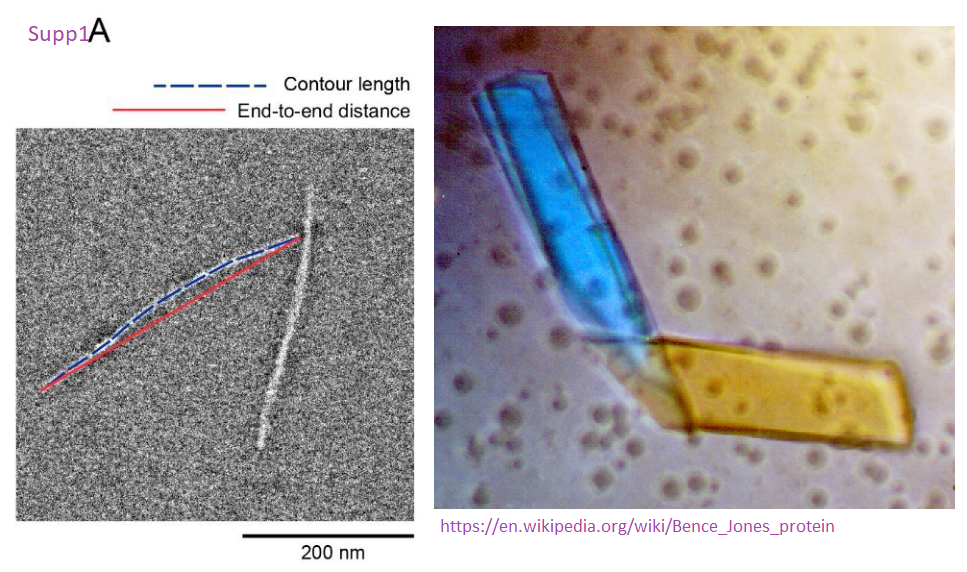
The authors used cryoelectron microscopy to predict the structure of her light chain amyloid deposits. CryoEM involves taking a transmission electron microscopy image of a structure and fitting in fitting in known structures of the protein, or related proteins, based on X-ray crystallography data. In this case the scientist used a combination of the sequence of her light chain and the 1BJM entry of the rcsb.org database. To be specific, the X-ray crystal structure was based on Bence-Jones crystals of light chains found in the urine of multiple myeloma patients.
Supplemental figure 1A from Radamker2019 showng a transmission electron microscope image of an AL fibril. also shown is are some Bence-Jones crystals of IgG light chains from Wikipedia.
Okay, now that we are dealing with IgG light chains behaving badly, let us get on to our story of how Cu2+ makes a bad situation worse. This sequel comes from collaborators from Italy. [2]
Cu(II) / Cu2+ making a bad situation worse
Histidine is generally considered an amino acid that likes to bind to Cu with the imidizole nitrogen shown in blue below. Cysteine has a thiol that also likes to bind Cu, but in our case they can’t because they are bound to each other in a disulfide bond.
The Cu2+ sites in relation to structure. A. sequence and structural information of the amyloid from RCSB.org, The golden bars are beta sheets, the structures that sort of look like folded bed sheets in the featured image. The disulfide bond cysteines are shown for reference. B. The sequence of amyloid forming light chain from Russo 2022 [2] These authors mutated the Cu2+ binding sites His188 and His197 to alanines. The magenta paint brush sweeps represent other amino acids of the IgG light chain in the vicinity of the histidines being mutated to alanines.
Only the side chains are shown just to make the point that a lot of Cu2+ binding groups are lost in going from histidine to alanine with a side chain consisting of one carbon with three hydrogens that chemists don’t generally draw unless they can come off.
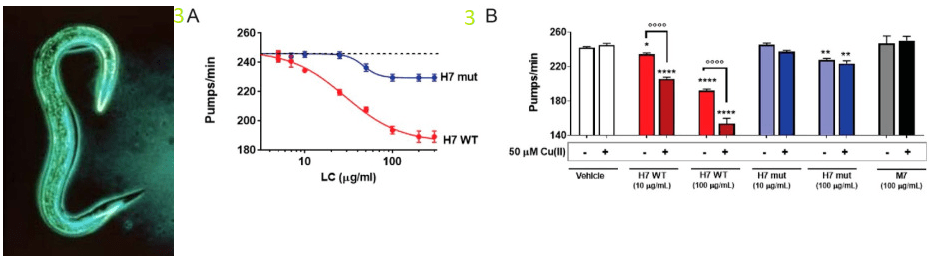
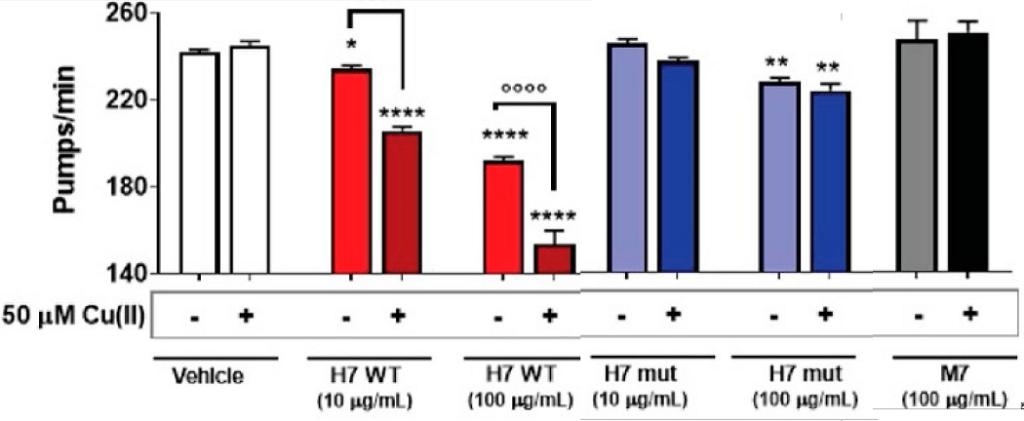
Most lay readers will want to know about toxicity. Rosso and coworkers used a nematode called Caenorhabditis elegans or C elegans for short. They have an ancestral heart and circulatory system that can be observed to “beat.” These wormies were fed eh IgG light chain proteins with and without small amounts of Cu2+. Note that the wild type H7 light chain becomes more toxic with 50 µM Cu2+. [2] In panel 3B, M7 are non amyloid genic IgG light chains from multiple myeloma patients that just happen to be non amyloid genic.
This is the link to the image on the left. H7 mutant with destabilized CL domain is less toxic to C. elegans. (A) Dose–response curves reveal the diminished toxicity of H7-H188A/H197A (H7 mut) compared to H7 (WT), as higher concentrations are required to inhibit the pumping rate of worms. Worms were fed for 2 h with different concentrations of WT or mutated H7 suspended in 10 mM PBS, pH 7.4, and the pharyngeal pumping was scored 24 h after the administration. Control worms received vehicle alone (dotted line). Each value is the mean ± SE, n = 30. IC50 was 28.9 and 46.8 µg/mL for WT and mutated H7, respectively, p < 0.01, Student’s t-test. (B) Worms were fed for 2 h with 10 or 100 µg/mL H7 or H7-H188A/H197A, or 100 µg/mL M7 dissolved in 10 mM PBS, pH 7.4, with or without 50 µM Cu (II). Control worms received 10 mM PBS, pH 7.4 with or without 50 µM Cu (II) (vehicle). Pharyngeal pumping was determined 24 h after the administration. Each value is the mean ± SE, n = 20. * p < 0.05, ** p < 0.01 and **** p < 0.001 vs. the corresponding vehicle, °°°° p < 0.001, one-way ANOVA and Bonferroni’s post hoc test.A close up to show just how toxin Cu(II) is in the presence of IgG light chains!
This post is going to skip some very complicated biophysical techniques that tested thermo stability of the amyloidgenic light chains. [2] Data not shown demonstrate Cu2+ binding to the VL of the cardiotropic H7 with a low micromolar affinity. [2] Alanine-substitution of two histidine residues in the constant domain of H7 (H7-H188A/H197A mutant) did not alter Cu2+ binding or impair H2O2 generation in vitro. [2] The His-to-Ala mutations destabilized the constant domain and reduced the toxicity of the H7 mutant. Rosso and coauthors could not explain the toxicity of Cu2+ only to the His188/His197 binding site alone. [2]
Two things to look into, in my opinion, would be
Cys221 at the end of the sequence and whether or not the disulfide bond was really there.
Free -SH groups, as opposed to -S-S- in disulfide bonds, could bind Cu2+.
This is an exciting paper in so many ways.
What if we were to take a casein digest mix of peptides, add a small amount of Cu2+ or Cu+ and feed them to C elegans? A next step could also be to use florescent dyes that bind to amyloid structures. Thioflavin T is just one example.
References
Radamaker L, Lin YH, Annamalai K, Huhn S, Hegenbart U, Schönland SO, Fritz G, Schmidt M, Fändrich M. (2019) Cryo-EM structure of a light chain-derived amyloid fibril from a patient with systemic AL amyloidosis. Nat Commun. 2019 Mar 20;10(1):1103. PMC free article
Russo R, Romeo M, Schulte T, Maritan M, Oberti L, Barzago MM, Barbiroli A, Pappone C, Anastasia L, Palladini G, Diomede L, Ricagno S. Cu(II) Binding Increases the Soluble Toxicity of Amyloidogenic Light Chains. Int J Mol Sci. 2022 Jan 16;23(2):950. PMC free article
This post is a continuation of a previous post covering a hot paper saying that Cu binding to DLAD, a pyruvate dehydrogenase complex enzyme, causes a regulated form of cell death. The Chinese are very interested in exploiting this “regulated cell death” to treat renal cancers. They explored U.S.renal cancer databases to determine if these cuproptosis proteins correlate with renal cancer prognosis. They found that these cuproptosis proteins are associated with favorable prognoses. Each time a protein is mentioned that has something to do with Cu(II), pyruvate, or lipoic acid, a ⶠwill appear in the text.
Renal cancer databases mined
The first study came out of Zhejiang University in China. These authors were interested in clear cell renal cell carcinoma. [1] They mined a U.S. database (https://portal.gdc.cancer.gov//, accessed on 15 March 2022). A total of 524 ccRCC patients and 72 adjunct non tumor samples.
The second study came from Changzhi, China. These investigators mined these databases: GEO (GSE12606, GSE53000, and GSE53757) and the TCGA-KIRC dataset. Among them, the GSE12606 dataset contains 3 cancer samples and 3 paired normal samples, the GSE53000 dataset contains 53 cancer samples and 6 normal samples, the GSE53757 dataset contains 72 cancer samples and 72 paired normal samples.
1. A Novel Apoptosis-Related Prognostic Gene Signature and Validation of Differential Expression in Clear Cell Renal Cell Carcinoma
Here we go with the 1st Chinese renal cancer data mining study.
Fig 1 RCC vs normal cuproposis gene expression
This bullet list was copied from the text. It goes along with Panel A of Figure 1. Log2 fold changes were converted to simple fold changes at this site. Log2 =0 is a 1x, or no change. The converted values are in orange. Only CDKN2A transcript, which codes two proteins, went up. The other TCA cycle related transcripts went down.
The emerging story is that it is bad to to lose some of these pyruvate metabolism related gene transcripts.
Bian 2022 Figure 2 is not being presented in this post. The biological processes of the 10 CRGs mainly involved in the GO analysis and KEGG analysis were related to aerobic production of ATP. This included Fe-S centers of the mitochondria to lipoic acid related genes.[1]
Figure 3 Survival curves
Bian and coworkers used a lot of fancy techniques to examine survival with renal cell carcinoma with over the course of months. They also looked at progression free survival. Patients who had high expression of these cuproptosis gene transcripts survived longer. For lay readers, each time there is a step down going from left to right, someone(s) dies.
from Bian 2022 [1] ⶠNote the presence of DLAT and lipoic enzyme LIAS, lipoyl synthase
These cuproptosis genes are associated with regulated cell death, yet these patients are living longer when they produce transcripts that code for pathways leading to the TCA cycle. Would lipoic acid be good to add with cuprous nicotinic acid or cuprous pyruvate?
Bian Figure 4 examined the multivariate analysis factors involved in overall survival and progression free survival. CDKN2A, FDX1, â¶DLAT, age, and gender were important predictors of the former while CDKN2A, FDX1, â¶LIAS, age, and gender were important predictors of the latter. [1]
Fig. 5 Two different datasets, the same answer
Blue is normal red is the tumor. Recall that â¶DLAT is Pyruvate dehydrogenase (acetyl-transferring)] kinase isozyme 3. This is the same enzyme that might be aggregated by the Cu when it is reduced by mitochondrial ferriredoxin FDX1. See previous post . Note that these “death” proteins are associated with health.
Bian 2022 Figure 5
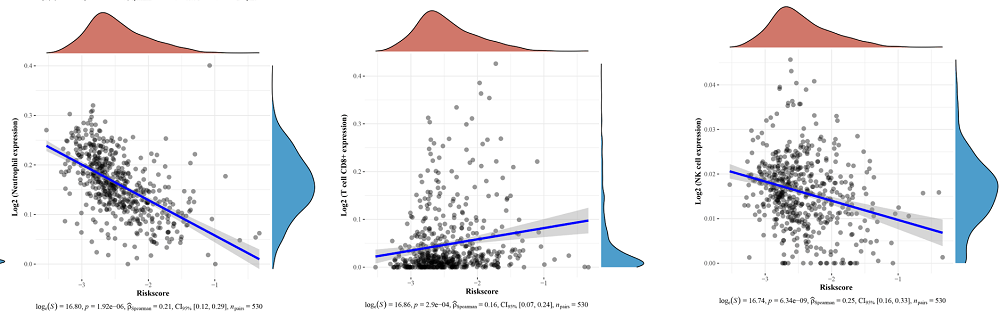
Bian Figure 6 explored whether the cancer related genes correlated with immune cell recruitment to the tumor. It is uncertain whether CRGs would influence immune cell recruitment in the tumorCDKN2A, DLAT, FDX1 and LIAS were the gene transcripts examined.
CDKN2A
â¶DLAT
FDX1
â¶LIAS
CD8+ T cell
↑ p = 2.89 × 10⁻²
Macrophage
↓ p = 2.89 × 10⁻²
↑ p = 2.93 × 10⁻¹³
↑1.73 × 10⁻²
↑ p = 1.12 × 10⁻⁵
neutrophil
↑ p = 1.89 × 10⁻⁶
↑ p = 1.15 × 10⁻³
B cell
↑p=1.40 × 10⁻⁶
↑ p = 2.33 × 10⁻³
Dendritic cells
↑ p = 1.02 × 10⁻⁴
data extracted from text associated with Bain 2022 Figure 6. [1] Up and down arrows indicate whether the transcripts are associated with a decrease or increase of a particular immune cell.
What we really do not now is what sorts of small molecules are in the tumor micro environment that might be recruiting immune cells and/or inactivating them. A general hunch is that reliance on the TCA cycle and an active electron transport chain is crucial to prevent generation of lactic acid that will do things to immune cells that is beyond the scope of this post to discuss.
Fig 8 Less expression means more disease
CCRC, clear cell renal carcinoma. This post will not examine the difference between pathologic stage and the histological grade. CDKN2A is a protein involved in cell cycle regulation that seems less important than ⶠDLD, DLAT, and LIAS that are involved in getting pyruvate into the TCA cycle.
2. Molecular Subtyping Based on Cuproptosis-Related Genes and Characterization of Tumor Micro environment Infiltration in Kidney Renal Clear Cell Carcinoma
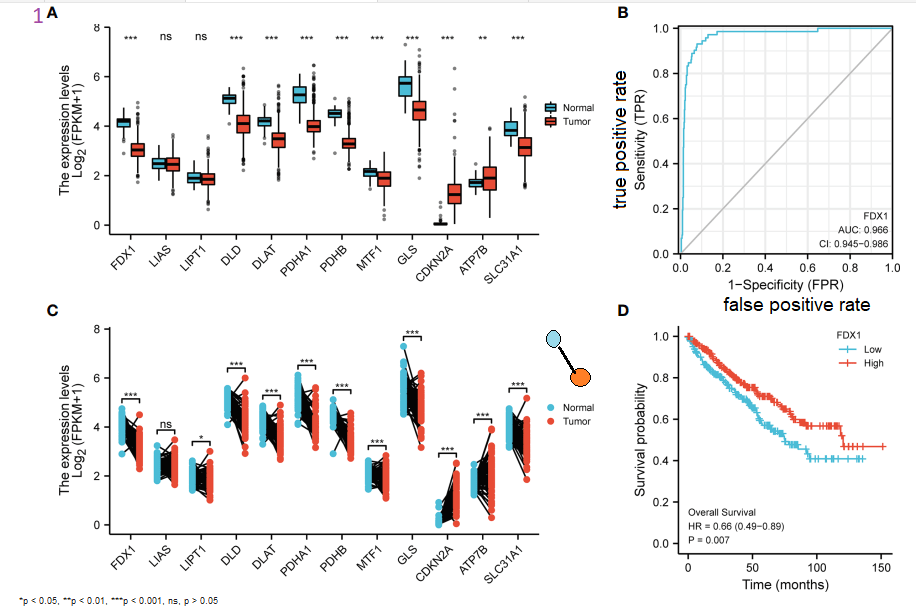
Ji and coworkers started their clear cell renal carcinoma (CCRC) database mining with the 12 cuproptosis proteins â¶. They did their comparison with adjacent normal tissue. 1C is kind of tricky to look at because the normal and tumor tissue transcripts are connected by a black line…. all stacked together. 1B gives the ability of the reductase FDX1 to predict cancer. 1D is another survival curve. Recall that â¶SLC31A1 is the Cu+ transporter Crt1.
Panel 1C is an interesting way to present tumor and adjacent normal gene transcripts from the same patient. With the Cu+ exporter ATP7B, sometimes there is more in the tumor, sometimes less. With ⶠCtr1 (SLC31A1) it sort of looks like there is a decrease in tumors (red) compared with adjacent normal (blue). The authors claim that all of these differences are significant. Panel 1D is a survival curve. Downward dips with time mean patients dying. High FDX1 producers are less likely to die. [2]
Ji Figure 2, outcomes based on cuproptosis proteins…
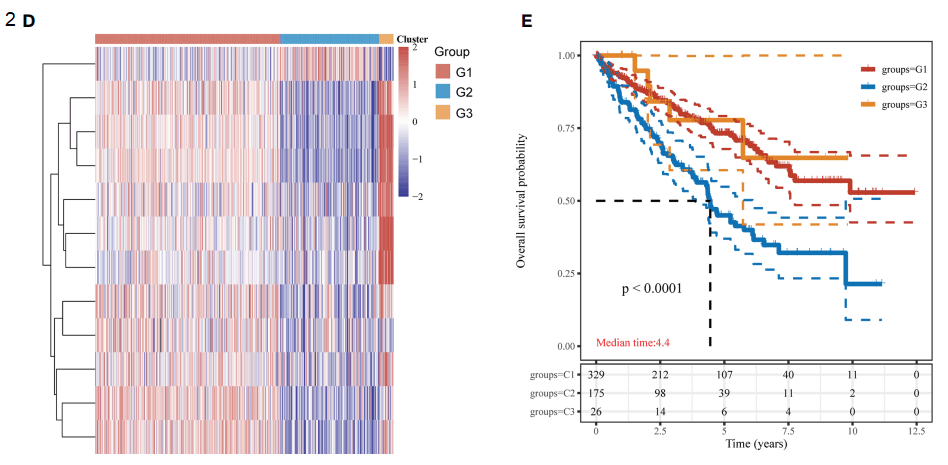
Ji 2022 attempted to break CCRC into different categories based on cuproptosis gene expression. Each row in panel 2D represents one of the 12 cuproptosis genes. Group 3, G3, is composed of patients with high levels of some of the cuproptosis genes (2D. below orange bar, red lines) In panel 2E we see that these high expressing individuals are not dropping off the survival curve (2E) as fast.
The identities of these rows was searched for in the supplemental data, but not found.
Ji Figure 3, immune cell recruitment
The investigators were able to estimate the immune cells present in the tumors based n the unique gene transcripts found in these cells.
The aspect of this interesting figure that prevents us at CopperOne from taking this too seriously is that we have no tumor microenvironment info and what role Warburg effect and the lactic acid that comes with it might have on the immune cell infiltration. Does more Ctr1 allow for more Cu+ transport and reliance on the electron transport chain?
Figure 4 of the Ji 2022 publication compared the sensitivity of the three groups to various chemotherapy agents. It was difficult to determine just how these data were curated. The data are avaible in reference [2]. Trying to correlate the mechanism of these treatments to the cuproptosis genes is beyond the scope of this post.
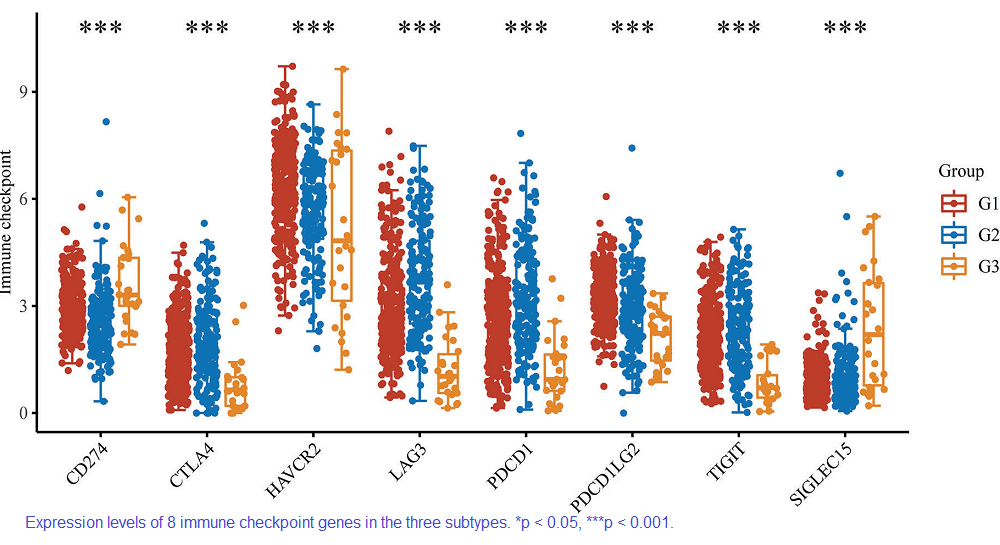
Ji Figure 5 cancer immunosuppression and escape from it
CD274 is the gene that codes for tumor produced, CD8+ T cell inhibiting PD-L1. CTL4 is the cytotoxic, CD8+ T lymphocyte associated protein 4. HAVCR2 is also known as Tim3. We’ve covered the copper connection with PD-1/PD-L1 and Tim3 on this site. LAG3 is lymphocyte activating gene 3 that maintains lymphocytes in a non -proliferative state. PDCD1 is the programmed death protein 1 PD-1. PDCDILG2 is also known as PD-2. TIGIT is expressed in natural killer (NK) cells and some T cells. It’s blockage with antibodies is being explored as a cancer immunotherapy. SIGLEC15 appears to have a role in cancer immune regulation and may be a target of immunotherapy to treat cancer. Note that G3 with the more profound cuproptosis gene signature is sometimes associated with more bad immuno suppression genes like PD-L1/CD274 and SIFLEC15 but in general is associated with less, all of the others….It is disappointing that we don’t know how the expression of these 8 genes correlates with ⶠCtr1 or DLAT that binds lipoic acid and processes purvate for the TCA cycle.
Ji Figure 6…on being a normal kidney
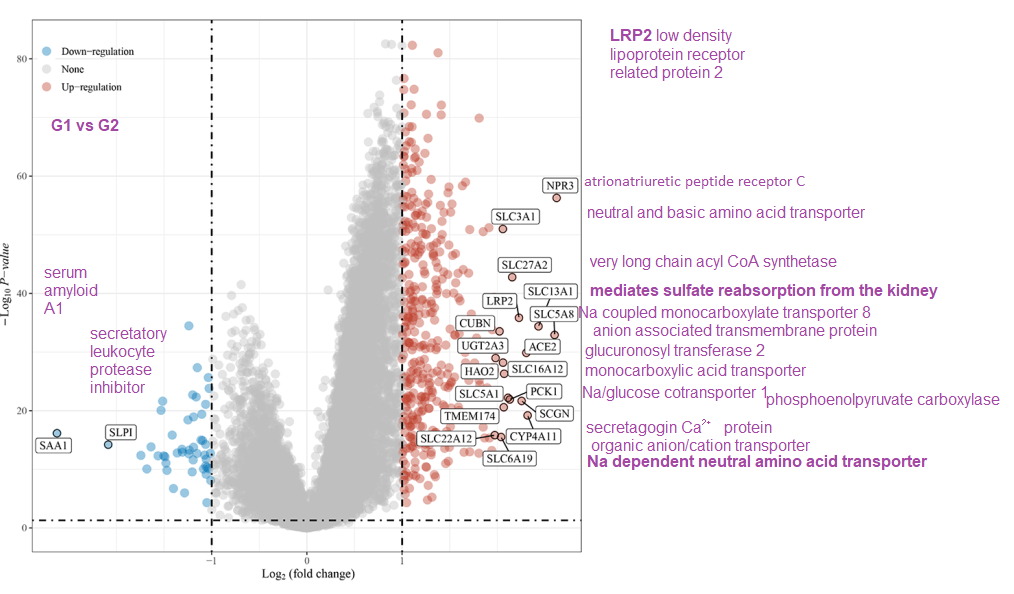
Ji Figure 6 examined the concept of differentially expressed genes in clear cell renal carcinoma. The KEGG and GO clusters of genes in related metabolic pathways revealed nothing much revealing. The G1 group had better survival compared to G2, with was the worse. Figure 6 contained a volcano plot. The fold change of a protein transcript is plotted on the X-axis. The -log P value is plotted on the Y axis. NRP3 is atrionatriuretic peptide receptor C peptide receptor 3 is part of the normal functioning of our kidneys. It’s expression in the healthier G1 group is at least 2 log10 units, or 102 = 100x more than the G2 group. Moving on to the Y-axis, its -log10 P value is just shy of 60. Lets call it 50. The -log10 of 50 is 10-50. In terms of p values we can be 99.999…9% percent sure we are not dealing iwth an artifact. We have 49 9s in place of the there … Many of the gene transcripts that drop out in the G1 group are ion and peptide transporters. It as if the G2 CCRCC tumors have stopped being anything that remotely resembles a kidney.
From Ji 2011 Figure 6. Names of many of the genes have been looked up.
Vearing away from solute transport, Ji and coworkers focused a lot on immune cell infiltration. What is it about a CCRC not being a normal kidney any more that brings in the immune cells?
Ji Figures 7 and 8, cuproptosis and cancer transcripts
Ji and coauthors used several RCC databases to determine which cuproptosis gene expression correlates with other known cancer related genes. Stars indicate genes that are immune system checkpoints. The names of other genes have been written into their Figure 7. P glycoprotein as a reputation for exporting chemotherapy giving the tumor resistance. Note that aldolase B is a glycolytic enzyme that is only weakly associated with cuproptosis genes. GPAT3, on the other hand, is very much part of the cuproptosis genes that feed into the TCA cycle. Seeing a renal chloride channel tied to the cuproptosis genes suggests a state of maintained differentiation, and less stem cell ness. The renal organic anion transporter does not seem to be as positively correlated with cuproptosis genes.
Figure 7 Ji 2022 [2]
Let’s take our SLC31A1 transcript that codes for Ctr1, the Cu+ transporter. When SLC31A1 goes up , the GPAT3 transcript goes up too. The closer the Pearson correlation coefficient is to 1, the more the two transcripts track each other. It is interesting to note that GPAT3 codes for protein involved in triglyceride synthesis. Ji and coworkers took the starred gene transcripts of proteins that control immune response. HMGCS2 is perhaps the most exciting from a metabolic standpoint. This transcript codes for 3-hydroxy-3-methylglutaryl-CoA synthase 2 (mitochondrial).
Ji and coauthors came up with a cancer related gene score. The rationale was not totally clear. It is hard to find good descriptions for all of the proteins that these transcripts code for.
A positive correlation between the CRG score and macrophages, monocytes, CD8+ T cells, and Tregs infiltration. A negative correlation was found between the CRG score and infiltration of neutrophils, NK cells, and nonregulatory CD4+T cells. The Spearman correlation coefficient between the CRG score and neutrophil infiltration was -0.62 CRG score. These plots are but a few examples from Ji 2022 Figure 8.
Does cuproptosis healthy dying require prior healthy living?
It is becoming hard to reconcile the “cuproptosis” regulated cell death genes being associated with a better prognosis in clear cell renal carcinoma. [1,2] These so called “death” genes are associated with better prognoses and normal living as a functional kidney with the assortment of proteins for reabsorption of filtrates. This post started out as an exploration of cuprous pyruvate as an adjunct cancer therapy. Hone the Cu+ to its DLAT target with pyruvate and let it oligomerize ⶠDLAT in a process called cuproptosis in a previous post . There is talk of taking CopperOne with an oil based carrier to keep it in the +1 oxidation state. Would lipoic acid be something good to add to the mix? Nonetheless, it would be interesting to see how cuprous pyruvate performs in cell based studies.
References
Bian Z, Fan R, Xie L. A Novel Cuproptosis-Related Prognostic Gene Signature and Validation of Differential Expression in Clear Cell Renal Cell Carcinoma. Genes (Basel). 2022 May 10;13(5):851. PMC free article
Ji ZH, Ren WZ, Wang HQ, Gao W, Yuan B. Molecular Subtyping Based on Cuproptosis-Related Genes and Characterization of Tumor Microenvironment Infiltration in Kidney Renal Clear Cell Carcinoma. Front Oncol. 2022 Jul 6;12:919083. PMC free article
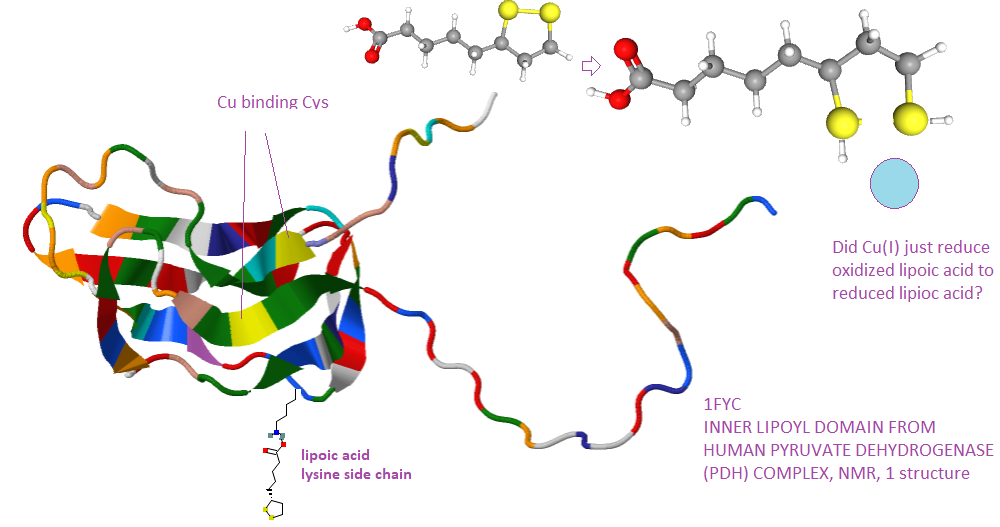
The featured image says it all. A lipoic acid binding component of the pyruvate dehydrogenase complex, DLAT, binds Cu2+ and causes the oligomerization of the DLAT subunit in such a way as to cause “regulated cell death.” There is a lot of controversy and talk as to which enzyme is most important in this new version of RCD.
Regulated cell death… so many means to choose from
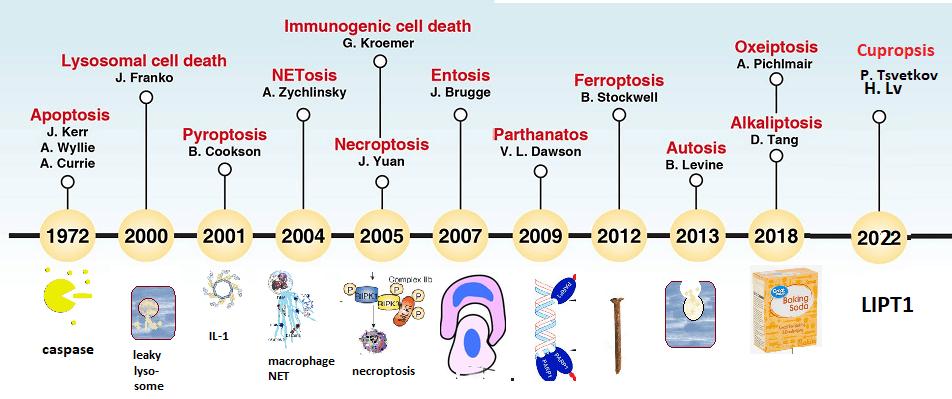
It all started with apoptosis, a form of programed cell death. The image below came largely from the public access 2019 Tang review. [1] I would say just skim through this list just enough to realize that the whole concept that death is a red hot regulated event.
Apoptosis is characterized by the mitochondria self destructing and activation of proteases called caspases. A caspase is like a PacMan chewing up proteins.
Necroptosis is a “prgrammed” form of inflammatory cell death with the programing part delivered by RIP kinase… of course!
Lysosomal cell death is when lysosomes, that function as intracellular stomachs, start leaking their cathepsin digestive enzymes.
Pyroptosis is driven by the IL-1 and so on producing inflammasomes that we’ve discussed on this site. The “pyro” part must come from the fevers that come along with cytokines produced by cytokines like IL-1
Netotic cell death has been covered on this site: macrophage and their secreted nets that kills pathogens and maybe bystander cells
Ferroptosis is, in simple terms. unbound iron generating reactive oxygen species. The rust nail is a reminder that iron reacts with oxygen.
Entosis is when one cell kills another by endocytosis, we are assuming that this is by non immune cells. .
Immunological cell death is when dying cells are cleared by phagocytosis
Parthanatos results from excessive activation PARP and loss of ATP and NAD+ PARP can bind to dmaged DNA leading to repair or apoptosis…
Alkaliptosis is mediated by mediated by intracellular increase in pH or alkalinity.
Autosis is a lysosome thing when the lysosome intracellular cellular stomach organelles fuse with autoendosomes.
Oxeiptosis is a novel oxygen radical-induced pathways.
Figure 1 from Tang 2019 with whimsical images added. The Cupropsis time point from Lv 2022 [3] was not in the 2019 review. Probablyl the first report of Cutproptosis belongs to Tsvetkov 2022 [2]
Confusing? Of course it is!
This is just the context of our next story about how Cu2+ might contribute to the death of melanoma cells. Sometimes a cell must activate programs because the good of the many cells in an organism outweigh the good of the one.
The discovery, from Boston and Baltimore
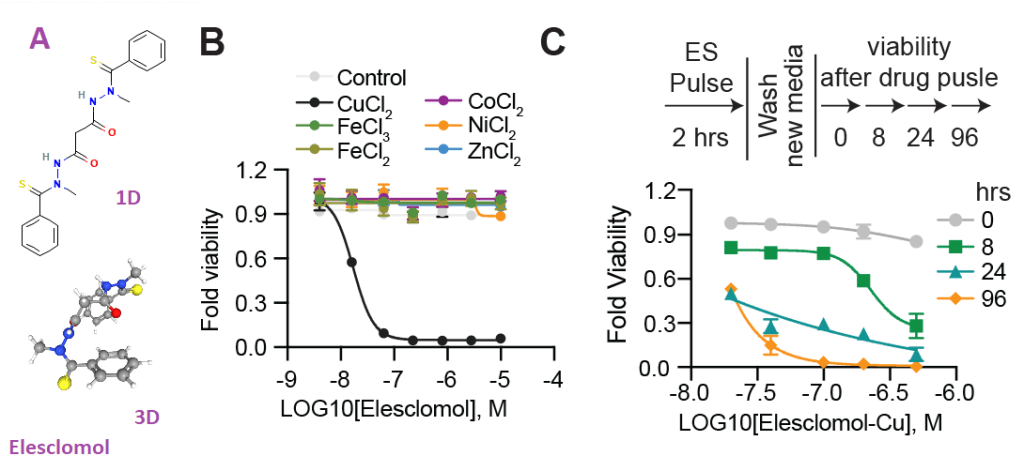
Ths studly came out of many prestigious cancer focused institutes in Boston Baltimore. Elesclomol “is a small-molecule bis(thio-hydrazide amide) with oxidative stress induction, pro-apoptotic, and potential antineoplastic activities. Elesclomol induces oxidative stress, creating high levels of reactive oxygen species (ROS), such as hydrogen peroxide, in both cancer cells and normal cells. Because tumor cells have elevated levels of ROS compared to normal cells, the increase in oxidative stress beyond baseline levels elevates ROS beyond sustainable levels, exhausting tumor cell antioxidant capacity, which may result in the induction of the mitochondrial apoptosis pathway. Normal cells are spared because the increase in the level of oxidative stress induced by this agent is below the threshold at which apoptosis is induced” according to PubChem. Elesclomol is evidentially also an ionophore for Cu and other metal ions. The authors were not really indicating the oxidation state of these metals.
PubChem and A 1D and 3D structures of Elesclomol from PubChem B) Viability of cells (MON) after treatment with elesclomol ± 10μM of indicated metals. (C) Viability of ABC1 cells was assessed at the indicated times after elesclomol-Cu (1:1 ratio) pulse treatment and growth in fresh media. [2]
The rest of Tsvetkov Figure 1 concerned programmed cell death pathways we are considering too complicated for this post. Note that while Fe can redox cycle, it is not killing cells when chelated to Elesclomol. Note that this is Cu2+ that appears to be doing the killing.
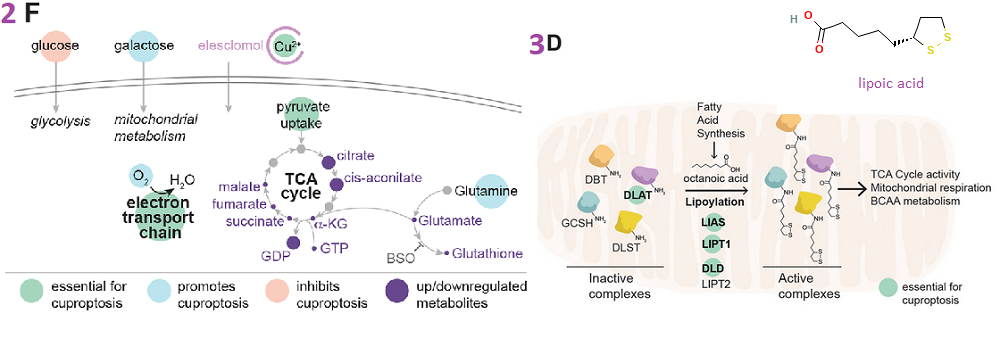
Tsvetkov and coauthors presented experiments in Figure 2 that led them to conclude that Eleschomol-Cu was not directly targeting the electron transport chain but rather the TCA cycle. These investigators knocke out seven genes they thought might rescue cell killing by elachlomol-Cu2+
Tsvetkov 2022 more figures (2F) Schematic of metabolites altered following elesclomol treatment of ABC1 cells (purple circles mark metabolites changing abundance(3D) Schematic of the lipoic acid (LA) pathway. Genes that scored in our genetic screens are marked as essential for copper-induced cell death Ï´ essential for cuproptosis
These are the suspect enzymes that were knocked out the cell culture system. Ï´ denotes enzymes that are needed for cuproptosis.
FDX1 (a reductase known to reduce Cu2+ to “its more toxic form, Cu1+ ” Accroding to GenCards FDX1 is a gene that codes for mitochondrial adrenodoxin a small iron-sulfur protein that transfers electrons from NADPH through ferredoxin reductase to mitochondrial cytochrome P450, involved in steroid, vitamin D, and bile acid metabolism
,LIPT1, Ï´ mitochondrial lipoyl transferase 1 Catalyzes the transfer of the lipoyl group from lipoyl-AMP to the specific lysine residue of lipoyl domains of lipoate-dependent enzymes
LIAS Ï´ mitochondrial lipoyl synthase This protein has Fe-S centers shown as
Figure 4 made the case that FDX1 expression tends to correlate with the abundance of lipoic acid. [1] Cancer cell line data backed this up. Wikipedia authors made the case for lipoic acid being important for TCA function. The case for Cu involvement. The authors used affinity resigns that bind metal ions and whatever proteins might bind those metal ions. To elute the metal ion binding protein, one simply elutes with excess metal ion. Figure 5 continued with some clever microbiology that also suggested Cu induced oligomerization.
(5A) The binding of indicated proteins to copper (Cu), Cobalt (Co) and Nickel (Ni) was assessed by immunoblot analysis of eluted proteins from the indicated metal loaded resins.From Figure 6 Tsvetkov 2022 A summary of the working hypothesis SLC31A1 is also known as Ctr1
Note that the working hypothesis has nothing to say about Cu+ chaperone proteins. The elesclomol is a very unnatural way to introduce Cu into the cell in a very unnatural oxidation state. It has further not been verified whether Cu+ or Cu2+ is more reactive with Fe-S centers.
What all of this means
The landmark Tsvetkov cuproptosis paper cites many enzymes in glycine cleavage system (GCS) dual function pathway, one of which is feeding the amino acid glycine into the TCA cycle. The GCS can can also be used for making glycine. The glycine cleavage system, GCS, consists of four enzymes [3]:
glycine decarboxylase (P protein)
aminomethyl-transferase (T protein)
dihydrolipoyl dehydrogenase (L protein)
and a carrier protein (H protein)
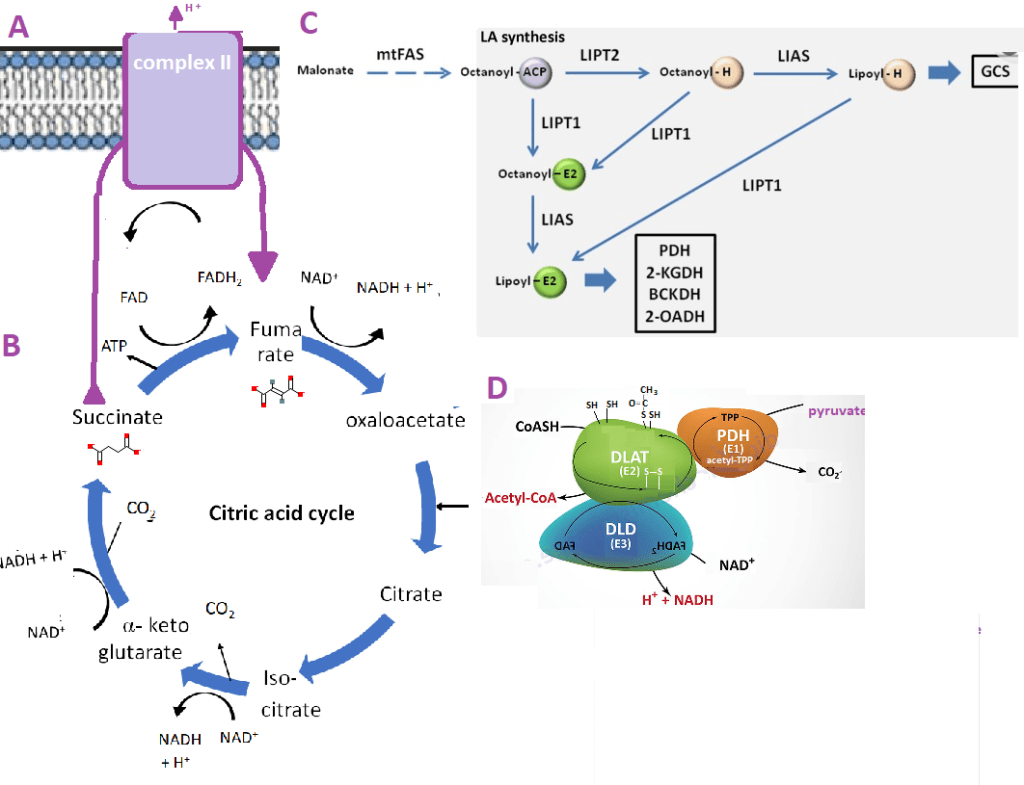
These are some images collected to tie things together A. Complex II of the miochondira all by itself. to illustrate the concept that complex II is part of the TCA cycle and electron transport chain. B. The TCA cycle. Note that succinate loses some hydrogens in going to fumarate. C. Note that many enzymes in this GSCS diagram from Bernardinelli 2017 [3] are also important for cuproptosis [2] D. The PDH image was adapted from this link.
According to Tsvetkov 2022, many enzymes in this complicated pathway are important for cuproptosis, but it is DLAT that oligomerizes in response to Cu. [2] In DLAT of panel D there are three forms of lipoic acid (1) two SH groups (2) one SH group and the other bound to an acetyl group (3) an internal (white) S-S form.
Mining melanoma databases for cuproptosis
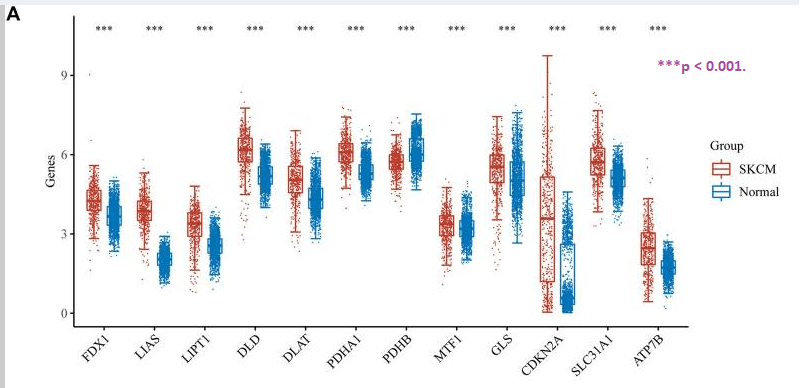
This is a big data study that probably is not that informative. It came out just a few months after the landmark Click here to proceed to a discussion on DLAT and Cu(I), Haozhen Lv and coauthors conducted a data mining experiment of mRNA transcripts of skin cutaneous melanomas from 470 patients. It is recommended that the impatient lay reader only parse through this section. The take home is that cuproptosis is red hot and poorly thought out. There were some normal controls in here too.
Fig 1 highlight from Lv 2022 {4] (B) Box plots visualized the expression patterns of cuproptosis-related genes in two SKCM clusters. **p < 0.01, and ***p < 0.001..
MTF1 … is a Zn2+ transcription factor that binds to the metal response element ( MRE) to activate transcription of genes that code for metalothionein. Also regulates the expression of metalloproteases in response to intracellular zinc and functions as a catabolic regulator of cartilages (By similarity)
GLS..glutaminase, liver isoform, Plays an important role in the regulation of glutamine catabolism. Promotes mitochondrial respiration and increases ATP generation in cells by catalyzing the synthesis of glutamate and alpha-ketoglutarate. Increases cellular anti-oxidant function via NADH and glutathione production. May play a role in preventing tumor proliferation
CDKN2A is a gene that codes for a protein that is a negative regulator of cylins that control the cell cycle and hence proliferation.
SLC31A1, aka Ctr1
ATP7B the Cu+ efflux pump
Simplifying Lv 2022 confusing Fig 5
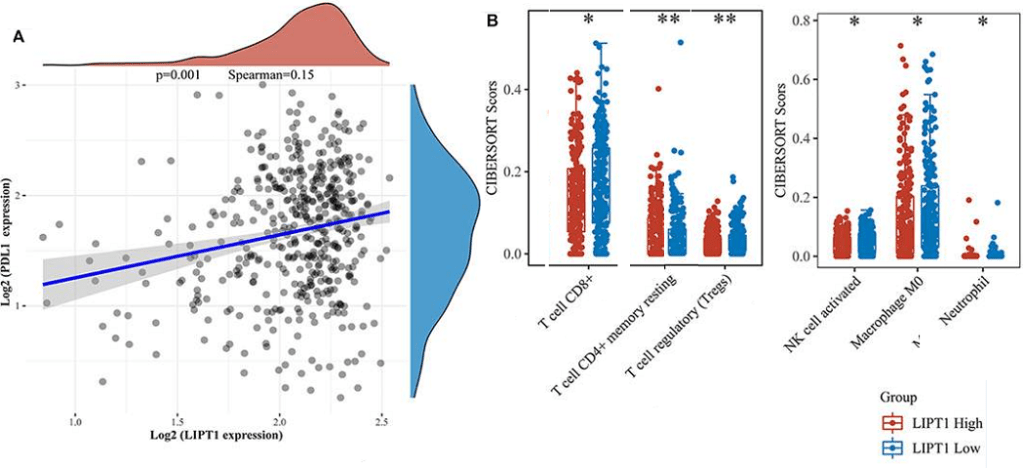
Much of the Lv [4] publication shifted to high expression of LIPT1 expression being correlated with survival. The data presented in Lv 2022 seemed excessive. The PMC link [4] was used to obtain a full size image that was edited to show only significant increases or decreases in the CIBERSORT score.
Panel 5A PD-L1 expression as a function LIPT1 expression
Much of the Lv 2022 that is not being presented in this post discussed that how more LIPT1 is expressed in melanomas than in normal tissue, patients whose melanomas have a light level of LIPT1 expression have better survival than patients whose melanomas have lower expression. [4] Then they show data the more expression the more expression of PD-L1. PD-L1 or prgramed death receptor ligand 1, is a protein on the surface of tumor cells that binds to the programmed death receptor PD-1 found on activated T cells. When the two bind, the activated T cell is turned off. Wikipedia authors discuss how antibodies against PD-L1 are used to treat cancers that include melanomas! This is confusing and makes absolutely no sense whatsoever.
Fig 5 Lv 2022 [4]Relationship between LIPT1 expression, immunotherapy and infiltrating immune cells in Skin Cutaneous Melanoma (SKCM) by correlation analysis. (A) The correlation analysis of PD-L1 expression and LIPT1 expression in SKCM. (B) The infiltrating levels of immune cells in high and low LIPT1 expression groups in SKCM patients. More survival curves in FIg 5 are not shown in this post
Panel 5B, individual immune cells
Lv did not go into great detail on how they used the CIBERSORT score. For now we will assume that they are looking at mRNA markers of various immune cells in the tumors of 470 melanoma patients with low or high levels of expression of LIPT1. The differential infiltration of some immune cells was found between LIPT1-high and LIPT1-low groups.
CD4+ memory T cells resting ↑
CD8+ T cells ↓
regulatory T cells (Tregs)↓
activated NK cells ↓
M0 macrophages ↓
neutrophils ↓
To summarize Lv and coauthors found that LIPT1 was upregulated in melanoma by analyzing the data downloaded from the TCGA and GEO databases, respectively. They also found that LIPT1 could be an indicator of the favorable prognosis of melanoma. They just assumed that up regulated LIPT1 might inhibit tumorigenesis by disrupting the TCA cycle. [4] This is what they claimed. LIPT1 actually supports the TCA cycle. In general it is better that tumors have an active TCA cycle and electron transport chain because to do otherwise would force them into the glycolytic Warburg Effect. The high lactic acid tumor microenvironment tends to be immuno suppressant.
Targeting DLAT
Recall that DLAT is the pyruvate dehydrogenase complex component that binds to lipoic acid. It also oligomerizes in response to high copper. [2] D-lipoic acid has been explored as a means of chelating Cu(I) from Cu(I) binding proteins in Wilson’s Disease. [5] The C50 concentration needed to chelate 50% of the Cu(I)Cox17 was 0.498 ± 0.098 mM. The Kd (affinity) was 8.05 × 10−17 M, 10 to 100x than some of the other chelators examined as possible Wilson’s Disease therapeutics for this copper overload disorder. [5] Note, 0.498 mM lipoic acid is not going to happen.
References
Tang D, Kang R, Berghe TV, Vandenabeele P, Kroemer G. (2019) The molecular machinery of regulated cell death. Cell Res. 2019 May;29(5):347-364. PMC free article
Tsvetkov P, Coy S, Petrova B, Dreishpoon M, Verma A, Abdusamad M, Rossen J, Joesch-Cohen L, Humeidi R, Spangler RD, Eaton JK, Frenkel E, Kocak M, Corsello SM, Lutsenko S, Kanarek N, Santagata S, Golub TR. Copper induces cell death by targeting lipoylated TCA cycle proteins. Science. 2022 Mar 18;375(6586):1254-1261. PMC free article
Bernardinelli E, Costa R, Scantamburlo G, To J, Morabito R, Nofziger C, Doerrier C, Krumschnabel G, Paulmichl M, Dossena S. (2017) Mis-targeting of the mitochondrial protein LIPT2 leads to apoptotic cell death. PLoS One. 2017 Jun 19;12(6):e0179591. PMC free article
Lv H, Liu X, Zeng X, Liu Y, Zhang C, Zhang Q, Xu J. (2022) Comprehensive Analysis of Cuproptosis-Related Genes in Immune Infiltration and Prognosis in Melanoma. Front Pharmacol. 2022 Jun 28;13:930041. PMC free article
Smirnova J, Kabin E, Järving I, Bragina O, Tõugu V, Plitz T, Palumaa P. Copper(I)-binding properties of de-coppering drugs for the treatment of Wilson disease. α-Lipoic acid as a potential anti-copper agent. Sci Rep. 2018 Jan 23;8(1):1463. PMC free article
Song, M., Li, X., Zhang, X., Shi, H., Vos, M. B., Wei, X., Wang, Y., Gao, H., Rouchka, E. C., Yin, X., Zhou, Z., Prough, R. A., Cave, M. C., & McClain, C. J. (2018). Dietary copper-fructose interactions alter gut microbial activity in male rats. American journal of physiology. Gastrointestinal and liver physiology, 314(1), G119–G130. PMC free article
These authors started with the knowledge that too little and perhaps too much copper can lead to non-alcoholic fatty liver diseae (NAFLD). Fructose was also considered a contributor to NAFLD. What we at CopperOne think is really cool is that these investigators also looked at the intestinal bacteria.
Male weanling Sprague-Dawley rats (35–45 g) were fed a purified AIN-76 diet with Cu(II)CO3. A purified AIN-76-based diet containing nearly 40% sucrose (wt/wt).
1.6, marginal Cu
6.0 adequate Cu
20 ppm supplemental Cu
The mice were given distilled water to drink ± 30% weight/volume fructose.of copper as marginal, adequate, or supplemental doses, respectively, for 4 wk. Control animals
How much sugar, presumably fructose, is in Coca Cola? This site says that there are 25 g sugar in 7.5 oz. Using the online conversion, this is 213 mL. This comes out to 12% w/v! These little animals were drinking water that had almost 3x as much sugar as Coca Cola. Does this measure the human condition? Humans who are consuming high fructose corn syrup sweetened beverages are probably also consuming foods sweetened with the same.
Copper and copper proteins
Ceruloplasmin…The Cu carrier protein in the plasma saw a big reduction in the Cu marginal rats. Drinking fructose resulted in a ~25% reduction in the Cu adequate rats.
Plasma Cu, The plasma is the portion of blood not containing cells and clotting factors. Fructose in the drinking water increased the serum Cu in the Cu supplemented group.
Liver Cu, Both marginal and supplemented Cu diets showed liver Cu than the fructose free Cu adequate rats.
Duodenal Ctr1 Fructose in the drinking water decreased mRNA levels that code for the protein Ctr1 in Cu marginal and Cu supplemented rats. Fructose has no effect on Ctr1 mRNA in Cu adequate rats
Liver Ctr1. All treatments decreased liver Ctr1 mRNA compared to the Cu adequate rats that were not drinking fructose.
Two liver enzymes and a cytokine
When liver enzymes end up in the blood, it is a sign of liver damage. These authors looked at ALT and AST. These enzymes did not track each other from one diet to the next. The high fructose/Cu supplement diet seemed to be most consistently associated with liver damge. MCP-1, macrophage chemoattractant protein 1, recruits immune cells to he site of an infection. Cu marginal and supplemented diets tended to increase MCP-1 in their Cu adequate counterparts.
Bacteria and leaky guts
Endotoxin/lipopolysaccharide is a lipid component of the cell membranes of Gram negative bacteria. Marginal Cu increased the amount of LPS in the blood. LPS binding protein LBP is produced in the intestine, liver, and adipose tissue. In each of the three diet groups, fructose increased LBP relative to unadulterated drinking water. FD-4, 100uL of FITC-dextran (molecular weight 4,000, FD-4, 40 mg/ml) were injected into the lumen before the gut was ligated to form a sac. The gut sac was then placed in Krebs-Henseleit bicarbonate buffer and incubated at 37°C for 20 min. The FD-4 that penetrated from the lumen into the incubation buffer was measured spectrofluorometrically with an excitation wavelength of 485 nm and an emission wavelength of 530 nm. Only the combination of Cu supplementation and fructose adulterated drinking water caused leaky gut.
Of mucin secreting goblet cells, tight junctions….
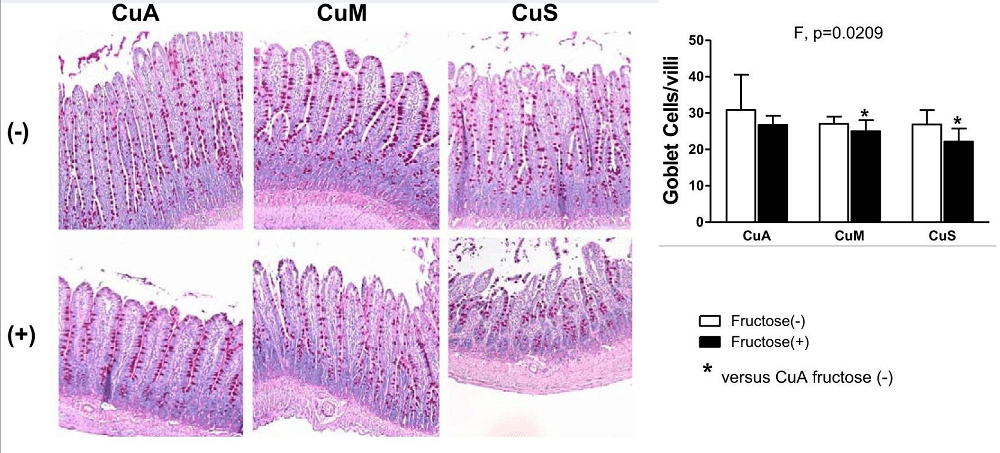
Goblet cells are mucin secreting cells of the GI tract. The PAS stain, periodic acid is reacting with mucin
From SOng (2018)
In copper adequate and copper supplemented, the presence of fructose in the drinking water seems to decrease the length of the villi.
Counting bugs
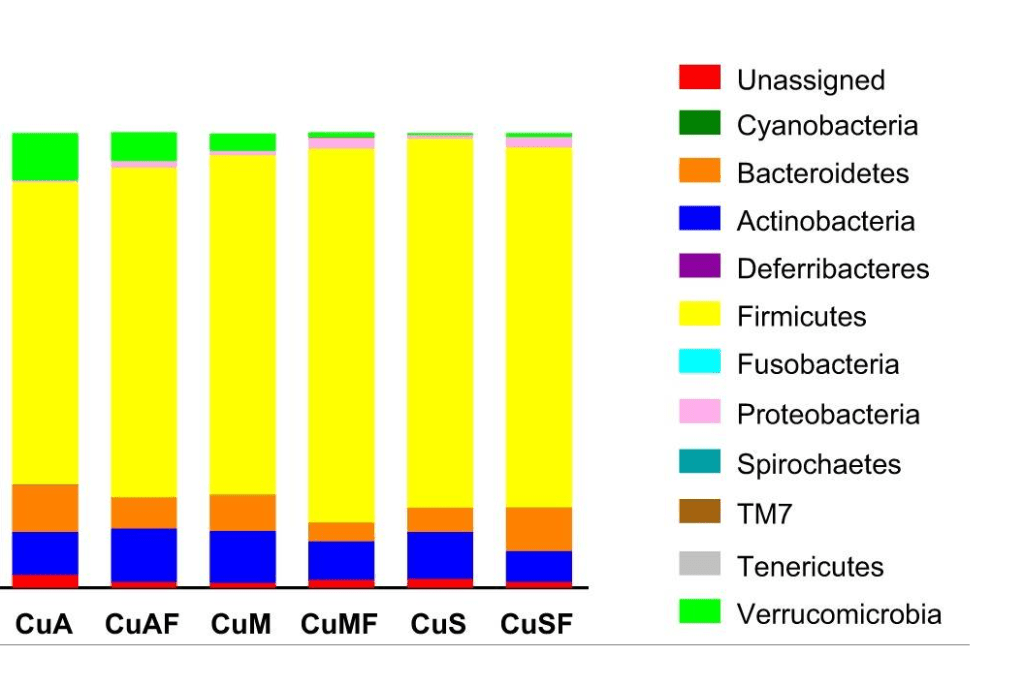
Song and coworkers got quite sophisticated in their counting that we will not get into. Instead we will only present a bar graph in figure 4.
Part of Fig 1 SOng 2018
The one thing that stands out is the down sizing of Verrucomicrobia, that Wikipedia authors have little to say about. Given the high sugar content of these rat’s diets, any difference needs to be taken with a certain level of skepticism.
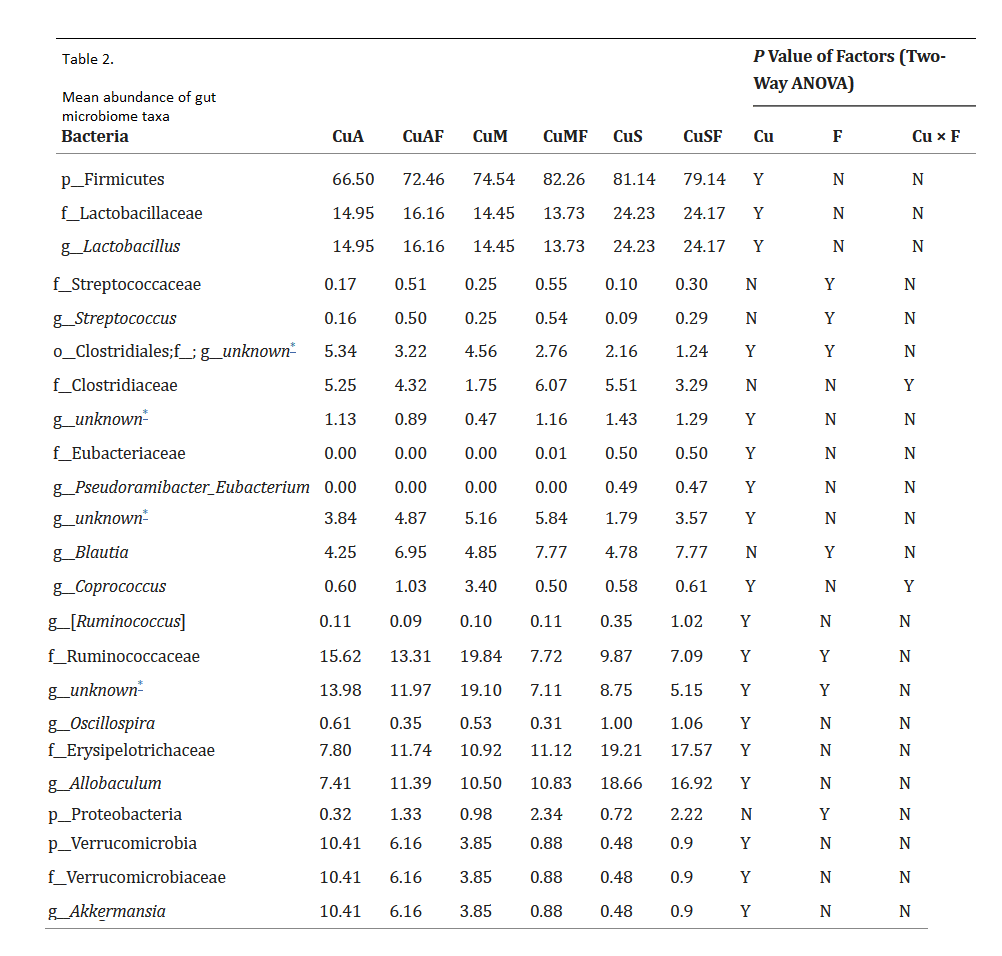
Table 2 from Song 1018. Non significant values have been edited out. A Y in the Cu column tells us that Cu significantly affects bug counts at p<0.05. A Y in the F column says that fructose significantly affects the bug counts for the genus in the row.
We’d like to make note of a second time, Cu used in this study was Cu(II)CO3. We at CopperOne would tend to think that the results would have been different with Cu in the +1 oxidation state.
This is just a reminder that the interior mesenteric vein drains blood from the descending colon. If Cu(II) has deleterious effects on our gut bacteria, it will be felt in our livers. Changing the makeup of intestinal bacteria will change short chain fatty acids, polyamines, metabolites will affect our livers. If Cu(II) makes our guts more permeable, the LPS will be seen by the liver. It would be interesting to repeat this study with a diet that is a bit lower in sucrose.
We at CopperOne have been telling customers to add cuprous niacin to an oil to keep it in the +1 oxidation state. Why not olive oil? Oleuropein is “the most important phenolic compound present in olive cultivars. It has a role as a plant metabolite, a radical scavenger, an anti-inflammatory agent, an antineoplastic agent, an antihypertensive agent, a NF-kappaB inhibitor, an apoptosis inducer, an antioxidant and a nutraceutical.”
While olive leaves are the main source of oleuropein sold by neutraceutical sorts, olive oil is a common dietary source. We at CopperOne will not go there. We are just mentioning this because customers are intrested in the use of oils to keep their CopperOne in the plus +1 oxidation state.
A high fat diet study and copper handling proteins
Santini, S. J., Tarantino, G., Iezzi, A., Alisi, A., & Balsano, C. (2022). Copper-catalyzed dicarbonyl stress in NAFLD mice: protective effects of Oleuropein treatment on liver damage.Nutrition & metabolism, 19(1), 9. https://doi.org/10.1186/s12986-022-00641-z
Mice were fed a normal or high fat diet for 8 weeks. At the end of this time mice were split into four different groups with four females and four males in each group
Normal dietary oleuropein may be found in olive oil. Oleuropein has a carboxyl group (top) that may bind Cu2+. The authors conducted two 16 week experiments. The first gave a general background of a normal diet (ND) vs a high fat diet (HFD). There were 12 mice, 6 per group in the fist experiment. Had four groups with four males and four females in each group.
normal protein/carbohydrate/fat 24/58/18
high fat protein/carbohydrate/fat 15/43/42
normal diet plus 5.6 mg/kg body weight oleuropein
high fat plus 5.6 mg/kg body weight oleuropein
About a third of the carbohydrates in the high fat diet came from sucrose. Values are in percent total food calories. The gap in the logic of this rather fascinating publication is the focus on methylglyoxylal, a byproduct of glycolysis.
This image was adapted from publication on glyoxylase 1, a focus of the Santini publication that this post is reviewing. DHAP dihydroxyacetone phosphate, GA3P glyceraldehyce 3-phosphate, which feeds into the TCA cycle to produce reducing equivalents for the electron transport chain.
Note the three blue nitrogens (Ns) on the side chain of arginine. They carry a positive charge. When methylglyoxal reacts with them, there is no longer a positive charge on the arginine side chain and whatever biochemical interactions that come from it.
1. Why Cu2+ and a high fat diet are toxic
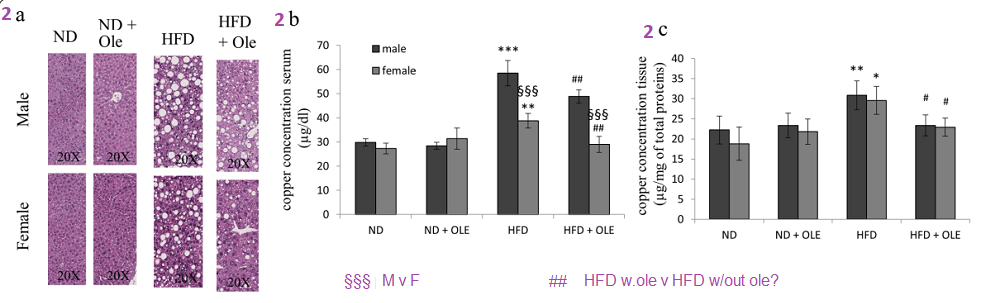
What is frustrating is that we cannot easily determine what the oxidation state is of the copper is in the diet of these mice. Only small portions of the much larger H&E stained images are shown in the panel 1a presented in this post. The take home are the large fat droplets in the liver slices in the liver from a high fat diet (HFD) mouse.
a. some close ups of H&E stained liver sections. The droplets are fats. b. copper is higher in the serum and the liver C only transcripts for the Ctr2 influx channel and the ATP7B efflux pump are increased.
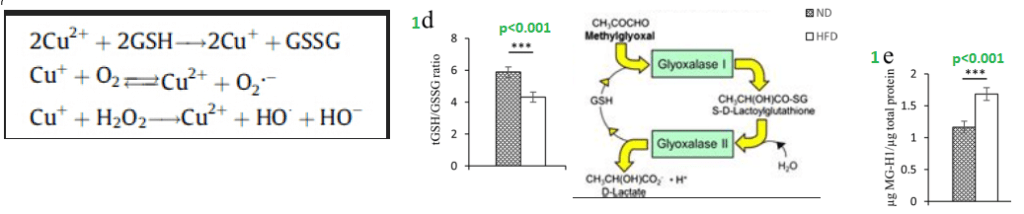
The authors think that oleuropein is chelating Cu2+. Why does Cu2+ need to be chelated? For starters, Cu2+ may oxidize glutathione (GSH), a small molecule needed to maintain redox balance. Oxidized glutathione, GSSG, might also form mixed thiols with protein thiols, i.e. PSSG.
From Santini 2022 with images added for visualization of mechanisms being examined.
Glyoxylases are enzymes that detoxify methylglyoxal and other aldehydes before they have a chance to form adducts on proteins. They rely on reduced GSH for detoxification.
The Code Before moving on to looking at bar graphs, this is the code the authors used to make comparisons:
* is a comparison between the ND (normal diet) and the HFD (high fat diet)
# is a comparison between HFD and HFD with oleuropein
§ is a comparison between males and females
3 symbols in a row, for example ####, means significant at the p<0.001 level
2 symbols in a row, ##, means significant at the p<0.01 level
just one symbol, #, means significant at the p<0.05 level, or 95% certain that the observed difference is not due to random chance. The lower the p value, the more sure we are the results are not due to chance.
2. Oleuropein blunts Cu accumulation
Here the authors are only looking at hepatic and serum Cu. Other tissues were not examined, probably for practical reasons. Small sections of the larger H&E stains are shown only to make the point that a high fat diet results in lipid accumulation in the liver. Male female differences (§, 2c) are not seen in liver Cu content but are seen in the the serum (§, 2b). Oleuopein in the HFD( #, 2b) seems seems to be specific to the female serum but seen in both genders in determining hepatic Cu content (2c).
Figure 2, click here if you have forgotten what the symbols mean.
The male mice on the HFD seem to have the greatest elevation of serum copper. Oleuropein seems to blunt this increase. We do not know if this increase in serum copper is protective or detrimental. The changes in hepatic copper (2c) are really not that great.
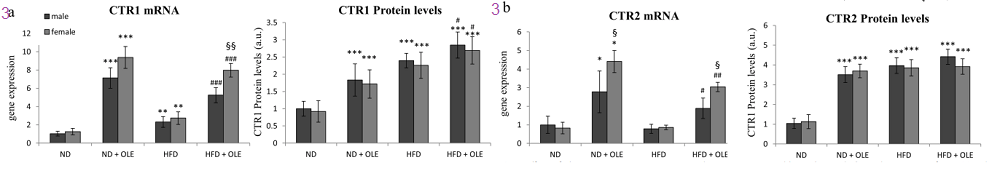
3 Ramping up of Cu+ channel translation
Many times scientists look only at mRNA transcripts of a given gene because it is easy to perform quick and relatively inexpensive analysis of these transcripts. Not every protein for which transcript are produced in the nucleus get translated into proteins. The scientist has to use a technique known as Western blotting to quantify the levels of a given protein. This post will not show the Western blots. Oleuropein increases the Ctr1 protein levels in male and female mice fed a high fat diet at the p<0.05 level of significance. (#, 3b, second panel.
Figure 3, click here if you have forgotten what the symbols mean.
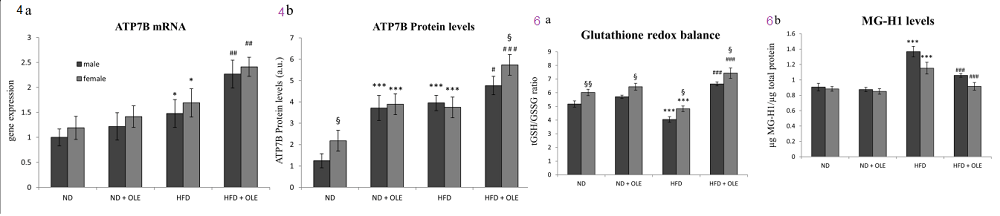
4 Getting Cu out and more GSH
Figure 1d,e speculated that the increase in Cu2+ with a high fat diet could cause GSH to decrease and methylglyoxylate to increase. This next figure combines Figures 4 and 6 from the study. Recall that ATP7B is the Cu+ efflux pump.
Combined figures 2 and 6 from the Santini publication. The Western blot images have been removed for lay viewers. Click here if you have forgotten what the symbols mean.
Oeuropein increases the protein levels of the Cu efflux pump (6b) in males and females, but more so in females. Similar improvements are seen in the increased ratio of GSH to GSSG (6a) and decreased MG-H1 levels.
5. Three Cu chaperones
This image was taken from Figure 5 of the Santini 2022 publication. Some images have been added to document the Cu cofactor enzymes that receive the Cu.
Figure 5 from Santini (2022) Click here for the meaning of the symbols. Western blots used to measure protein levels have been removed for lay readers.
Let’s concentrate on protein levels because not every mRNA transcript for a protein produced in the nucleus gets translated into a protein. Oleuropein really increases the transcripts for the Copper Chaperone for Superoxide dismutase (CCS) without a similar increase in actual protein levels (5b). Cu/Zn Superoxide dismutase scavenges the reactive oxygen species superoxide. Cox17 transfers Cu+ to cytochrome C oxidase in the mitochondria. We need this transfer for production of ATP. This transfer needs to occur to burn fat too! Finally, Atox1 transfers Cu+ to both Cu+ ATPases: ATP7A transports Cu into the cerebral spinal fluid for the brain and into the golgi for making secreted copper based enayzmes. ATP7B exports extra Cu into the bile.
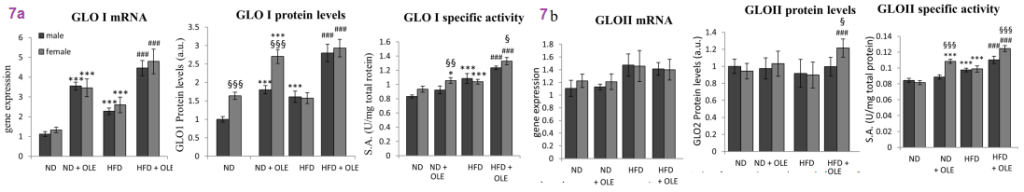
7 detoxifying methylglyoxal
Figure 6 of the Santini publication was presented with Figure 4 because the authors propose that Cu2+ can catalyze the depletion of GSH that is used as a substrate for glyoxylate enzymes that detoxify aldehyde groups that are the precursors to advanced glycation end products. Panels 7a and 7b follow a logic similar to seen in previous figures from the Santini publication.
An mRNA transcript is produced in the nucleus… doesn’t mean it gets translated into a protein
Just because the ribosomes translate mRNAs into proteins… doesn’t mean they are active enzymes.
Just because a protein is made, doesn’t mean it is active. It might require a post translational modification like attaching a phosphate group to a key amino acid. It might also require a cofactor, such as GSH in our case.
Click here to go up to the cartoon of Glo1 and Glo2 enzyme action. Note that only Glo1 uses GSH. The authors added exogenous GSH in their assays so that lack of reduced GSH in the liver homogenate would probably not have been a factor.
Figure 7 from Santini 2022.
Santini and coathors presented one last piece of data suggesting which transcription factor oleuropein works via to produce more Glo1 and Glo2. Let’s first summarize what has been presented so far.
Summary
In a mouse model, a high fat diet decreases reduced glutathione that is needed for detoxifying protein modifying methylglyoxal. Toxic Cu2+ may be the reason.
Oleuropein, a compound n olive oil, blunts Cu accumulation in the liver and serum. We don’t know if the Cu is getting to other tissues.
Oleuropein increases mRNA transcripts for Cu+ channels Ctr1 and Ctr2. We at CopperOne think that this is a good thing.
In mice fed a high fat diet, oleuropine increases the transcripts for the Cu+ efflux pump too. We don’t’ know about the Cu+ pump ATP7A that delivers Cu+ for making proteins that are exported from the cell.
Oleuropein increases mRNA and Cu+ chaperone proteins themselves that deliver Cu+ to enzymes we need to make ATP, combat reactive oxygen species, and making critical Cu enzymes that are exported from the cell.
Oeleuropein increases reduced GSH in mice on a high fat diet. The toxic glycolysis byproduct methylglyoxal is decreased too.
Oleuropein increases the activity of enzymes that metabolize this toxic byproduct of too much sugar.
Santini and coauthors have given us some insight as to why Cu2+ is toxic, particularly when we eat way too much sugar. We’ve been thinking of oils for keeping CopperOne in the +1 redox state. Why not olive oil with oleuropein to increase the expression of Ctr1 an copper chaperones? Naturally more studies will be required to prove this one.
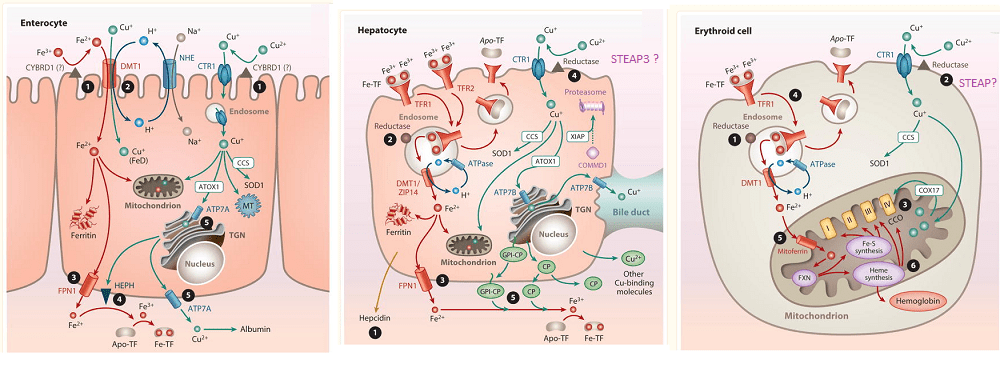
This post addresses the existence of a putative Cu(II) reductase that sits adjacent to the Ctr1 Cu+ channel. Sukru Gulec and James Collins wrote an excellent review on absorption of iron (Fe) and copper (Cu). This is a composite of three images going from the entry of Cu in the duodenum, transfer to the hepatocyte, and the red blood cell, erythroid cell.
Images from Gulec& Collins (2014), Liberty has been taken to write the names of putative Cu(II) from the figure legends of these images from the public access manuscript.
Let us start our journey with the
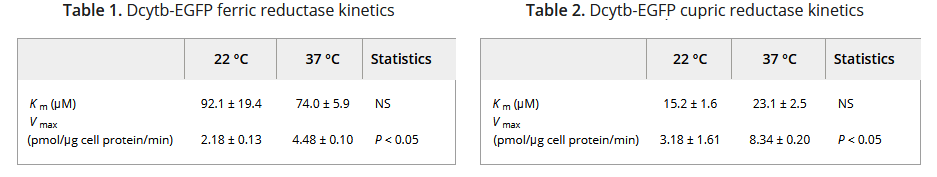
CYBDR1 , aka DCytB is a small membrane protein for which UniProt lists the following catalytic function:
Note that Cybdr1 has a lot in common with cytochrome P450s in the liver, hence the “Cy” as part of the name. The “D” must have come from “duodenum,” a location in the proximal small intestine responsible for absorbing Fe and Cu. The 31 kDa Cybdr1 gene was fused to the gene for Green Fluorescence protein and expressed in a kidney cell line. The kinetics of reducing Fe3+ and Cu2+ was measured. [2] The Fe(II)-ferrozine complex formation was detected by the absorbance at 562 nm. Capture of Cu(I) by BCS was monitored by the change in absorbance at 482 nm. [2]
Data from ref [2]
This particular kidney cell line expresses the divalent metal ion tansporter, DMT1. The authors demonstrated that the Kcyb1 transfected cells had absorbed 5x as much 59Fe originally added in the +3 ferric oxidation state as non transfected cells. [2] The authors cited literature showing that DCYTB knockout mice seemed normal and that no mutations in the human DCYTB gene have been associated with human disease at the time of the manuscript published in 2008. [2]
STEAP: Six Transmembrane Epithelial Antigen of Prostate
In 2006 a group from Millennium Pharmaceuticals and Children’s Hospital of Harvard characterized the tissue expression and reductase activity of Steap isoforms. [3] Tissue expression of STEAP1-4 was determined by use of radioactive RNA hybridization probes and whole body sections of mice. STEAP1-4 were expressed in HEK293 cells. [3] Fe3+ reduction to Fe2+ was measured with ferrozine, that absorbs 562 nm. The reduction of Cu2+ to Cu+ was measured with BCA that absorbs at 482 nm . [3]
From ref [3] with minor modifications for easier reading.
Note that Cu2+ uptake was already pretty high with just the empty vector used to insert the Steap gene into HEK293 cells. Cu2+ does seem to compete with Fe3+ for reductase activity.
Uptake of both metal ions was measured with radioactive analogs. [3]
the final figure from [3] with some cell line specific mRNA expression data from Protein Atlas. HepG2 cells are a liver cell line. Caco-2 are an intestinal line.
All in all, these data are really not that convincing that the Steap and DCyb1 reductases are really doing that much for copper absorption.
References
Gulec, S., & Collins, J. F. (2014). Molecular mediators governing iron-copper interactions. Annual review of nutrition, 34, 95–116. PMC free article
Wyman S, Simpson RJ, McKie AT, Sharp PA. Dcytb (Cybrd1) functions as both a ferric and a cupric reductase in vitro. FEBS Lett. 2008 Jun 11;582(13):1901-6. Free article
Ohgami R. S., Campagna D. R., McDonald A., Fleming M. D. (2006) The Steap proteins are metalloreductases. Blood 108, 1388–1394 PMC free article
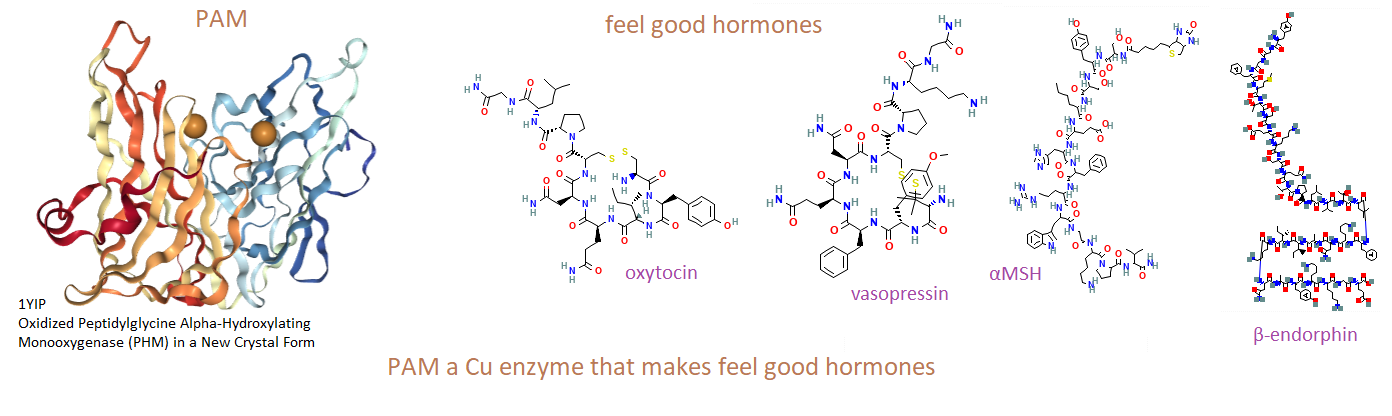
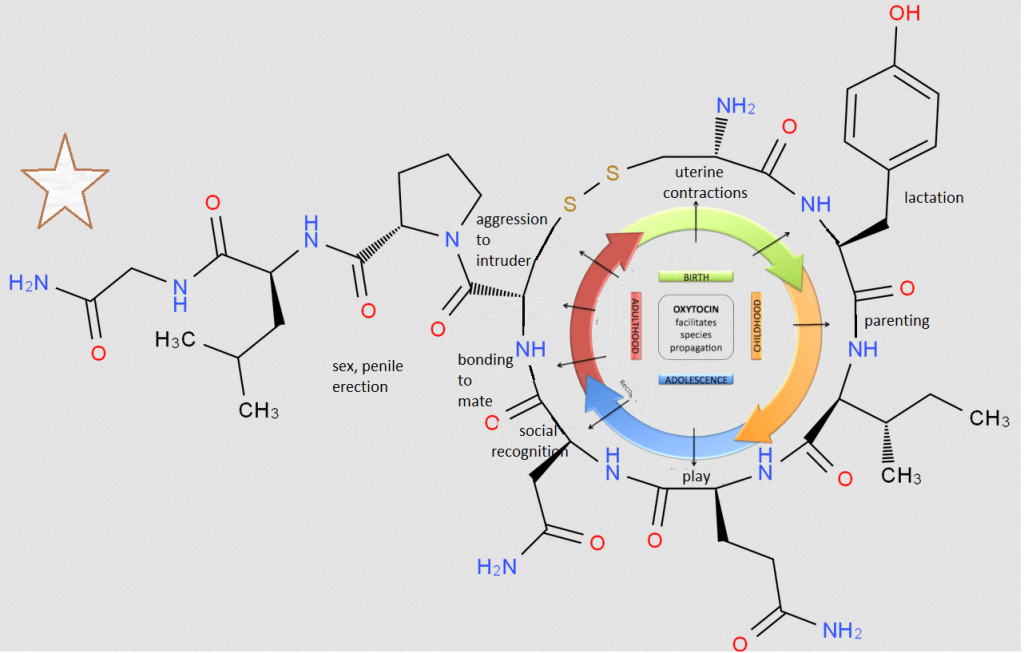
This post is about peptide hormones that make us feel good. It is not about dopamine and serotonin… The copper enzyme Peptidylglycine α-Amidating Monooxygenase (PAM) is responsible for the clipping of peptides to form common hormones we know as vasopressin, oxytocin, α-MSH, and β-endorphin. [1]
How PAM works
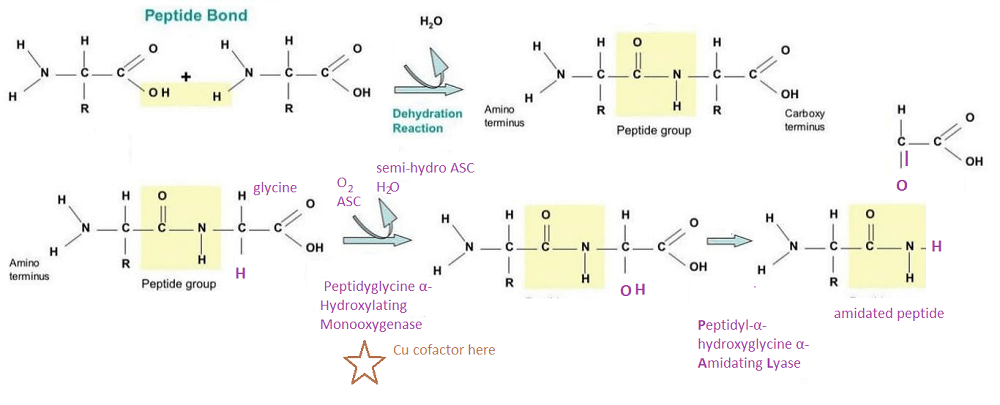
PAM is actually two enzymes in one. PHM uses copper to tag with oxygen. PAL snips at the tagged carbon.
Top, How a peptide bond is formed. R can be one of 20 groups unique to each amino acid. This includes H for glycine. Bottom: The enzyme PAM
The top panel covers what a peptide bond is. The bottom panel describes how the dual function enzyme PAM tags and clips the peptide resulting in the N-terminal (butt) of glycine. This is just something to think about. Copper is required for the production of some very important peptide hormones. We still do not know why the C-terminal amidation is so important. Many think it neutralizes the charge and increases binding to the hormone receptor.
PAM+/- mice are just messed up
A 2011 study found that mice with only one functional copy of the PAM gene, PAM+/-, had increased anxiety and decreased cold tolerance. [2] Copper deficiency in wildtype mice mimicked these symptoms. Discussion was given to PAM sometimes ending up in the nucleus. Gene transcripts for copper handling proteins were found to be altered in two key locations: the heart and the pituitary gland. Note that Thyrotropin-releasing hormone (TRH) is released from hypothalamic neurons that act on neurons of the pituitary gland.. that product ACTH, that acts on the adrenal gland to release cortisol… All of these feeds back on TRH.
highlights from reference [2] TRH-Gly has not been cleaved by PAM.
Why these mice felt anxious and whether the bad feelings were due to TRH-Gly getting stuck in the hypothalamus was not really a topic of discussion. Just that the hypothalamus connects to the pituitary gland brings us to the next topic.
PAM and amidated pituitary hormones
Some quick comments before getting into hard core science.
Oxytocin is the cuddling a cute puppy or a baby peptide. It is involved in all aspects of making more of one’s own species…. or a suitable surrogate of another species.
Vassopressin, also arginine vasopressin (AVP), is released by diurnal variations in sunline as well as changes in the osmolality (salt content) of the blood. AVP is similar to oxytocin, but does some very different things too such as increasing water channels in the kidney to aid in water absorption. The Wikipedia page on Vassopressin does a good job of comparing and contrasting AVP and oxytocin.
α-Melanocyte stimulating hormone, or α-MSH, is what tells our melanocytes to start producing melanin in response to sunshine. Is α-MSH the “Sunshine on my shoulders makes me happy” hormone? Maybe yes, maybe no. α-MSH is cleaved from same precursor as
Endorphinsbind to the same receptors as opioid pain killers. Endorpins are the eating chocolate, listening to music, meditation, sex, laughter, and sunshine hormones.
Oxytocin
A pictorial overview of oxytocin throughout the lifespan of the animal.
Adapted from Lee 2009 {3}
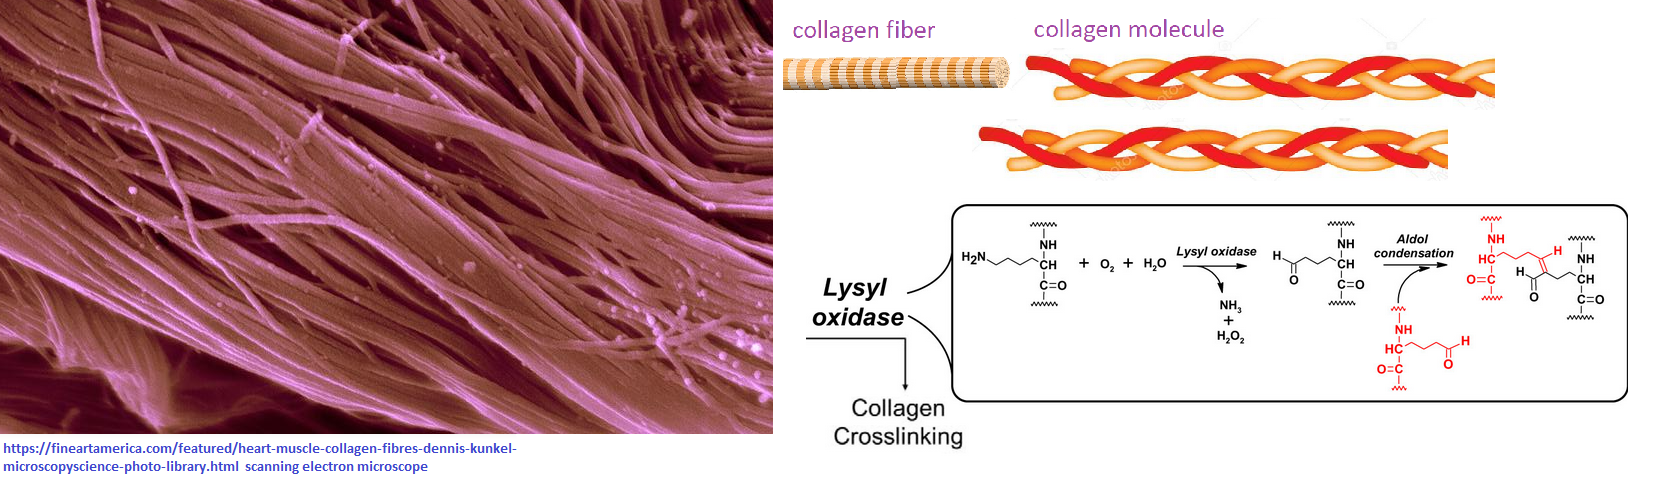
A study from 1992 demonstrated that guinea pig dams made copper deficient (0.8 microgram Cu/g diet) required 0.5 to 6.2 U oxytocin to injections to induce delivery of pups. [4] Many of the pups died of internal hemorrhaging, possibly due to lack of lysyl oxidase crosslinking of collagen. [4] In Cu adequate dams, pup survival was at 79%, Only 28% of pups survived in copper deficient dams.
In another study pregnant rats were placed on the copper-deficient or copper-adequate treatment 7 days after mating. The “purified” diet contained 0.35 mg Cu/kg and 42 mg Fe/kg by chemical analysis. Offspring and dams on the copper-deficient treatment drank deionized water, whereas copper adequate treatment groups drank water that contained 20 mg Cu/L by adding CuSO4 to the drinking water. [5] Decreased PAM activity showed up in the mid brains and atria of the heart. [5] We will not get into whether Cu(II) in drinking water is optimally bioavailable. Decreased superoxide dismutase SOD and cytochrome C oxidase CCO activity was noted.
Vasopressin aka AVP
The Yoshimura review made no mention of PAM being involved in AVP synthesis. They did state that AVP is made in the hypothalamus in response to stress. [5] The reader is invited to consult [6] for a comprehensive review of the tissue distribution of the three receptors of AVP and their physiological functioning. The Song and Albers (2018) review made the point that many rodent studies have demonstrated that oxytocin and AVP can bind to each others receptors, all of which are G-protein coupled receptors. [7] IF we can trust Wikipedia, AVPR1A couples with Gαq/11, AVPR1B couples with Gαq/11 , and AVPR2 with Gαs, while the oxytocin receptor couples with Gαq.
Three variety of alpha subunits that couple to heterotrimeric G protein coupled receptors. The other two units of the heterotrimer has another function.
In summary, AVP and oxytocin are very similar in sequence and structure. They can bind to the same receptors. The oxytocin and AVPR1 rceptors have similar down stream signalling via PLC.
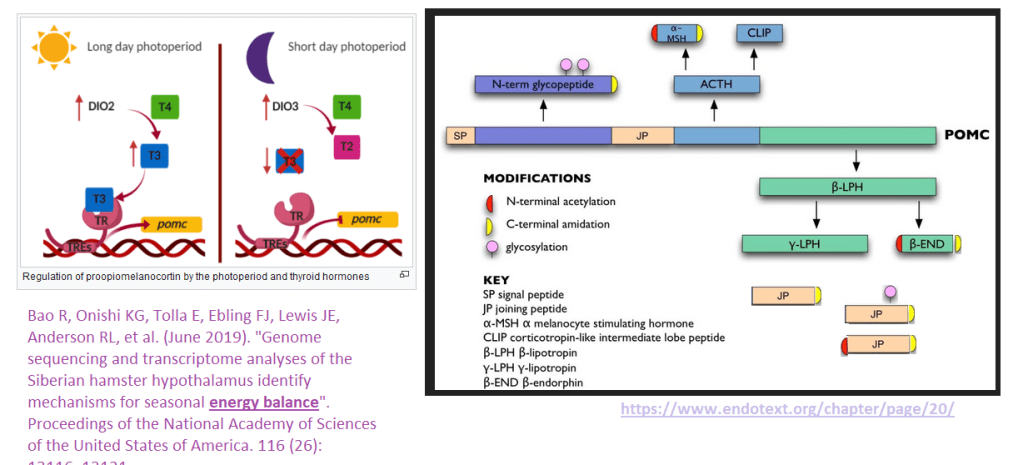
Pro opiomelanocortin
This gene contains many peptide hormones in one transcript. Then a protease comes and cleaves the new protein into many peptide hormones.
Left Iodothyronine deiodinase 2 rohormone thyroxine (T4) to the active hormone triiodothyronine (T3) via an iodine removal such that T3 can bind to the hormone receptor (TR), which then binds to thyroid hormone response elements (TREs) in the promoter of the POMC gene. In periods of less sunlight, there’s a conversion to an inactive form of thyroid hormone. See also: Barrett P, Ebling FJ, Schuhler S, Wilson D, Ross AW, Warner A, et al. (August 2007). “Hypothalamic thyroid hormone catabolism acts as a gatekeeper for the seasonal control of body weight and reproduction”. Endocrinology. 148 (8): 3608–17. doi:10.1210/en.2007-0316. PMID 17478556 Right: The POMC gene. Only a few of the peptide products are C-terminal amidated, yellow cap. The original image was modified based on dta in reference [9]
A short term copper deficient human study…
A 1998 human study investigated the effect of a low copper diet on plasma opioid peptides. In this study in 11 healthy young volunteers were fed foods low in copper but adequate in all other nutrients. [7]
0.66 mg/day for 24 days (marginal Cu)
0.38 mg/day for 42 days (low Cu) ↓ ceruloplasmin & plasma Cu, ACTH
2.49 mg/day for 24 days (adequate Cu). ↑ ceruloplasmin & plasma Cu
TPlasma β-endorphin, Leu-enkephalin, Met-enkephalin, and Adrenocorticotropic hormone (ACTH), as measured by immunoassay, did not significantly change between the start and finish of each study period. [8] intake.
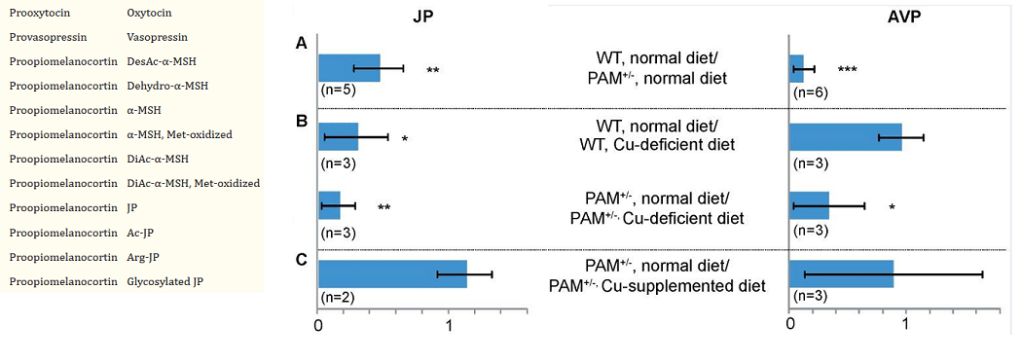
PAM+/- mice and a mass spectrometry technique
Yes ground up pituitary glands were involved in these experiments. Not only were the masses of these peptides measured with mass spectrometry, but also the masses of the fragments of busted up peptides. This allowed the investigators to detect new modifications of the peptide hormones. Recall that JP is the joining peptide between
ManyC-terminal amidated peptides were detected. Just a few showed statistically significant change. It has been hard to pin down a function for the joining peptide. More interest seems to be in AVP in terms of cardiovascular health than emotional health.
Where PAM is expressed
This image was derived from proteinatlas.org. The expression of PAM in the brain is limited. It is assume that this image from Protein Atlas is from the atrium.
In spite of PAM being involved in production of “fee good”hormones, it’s most abundantly expressed in the heart and a few other organs we are interested in This particular immunocytochemistry image of the heart from Protein Atlas looks like PAM is in some sort of vesicle. In spite of its abundance in the heart, its function is kind of hard to pin down. mRNA data indicates that PAM is comparatively abundance in the hypothalamus of the brain. The heart expression is kind of hard to ignore. There is an interest in measuring secreted PAM as an indicator of heart disease. A 96 well plate assay for detecting PAM activity in the serum has been developed by a company called Pam-t.com. [10]
References
Bousquet-Moore, D., Mains, R. E., & Eipper, B. A. (2010). Peptidylgycine α-amidating monooxygenase and copper: a gene-nutrient interaction critical to nervous system function. Journal of neuroscience research, 88(12), 2535–2545. PMC free article
Bousquet-Moore, D., Prohaska, J. R., Nillni, E. A., Czyzyk, T., Wetsel, W. C., Mains, R. E., & Eipper, B. A. (2010). Interactions of peptide amidation and copper: novel biomarkers and mechanisms of neural dysfunction. Neurobiology of disease, 37(1), 130–140. PMC free article
Lee, H. J., Macbeth, A. H., Pagani, J. H., & Young, W. S., 3rd (2009). Oxytocin: the great facilitator of life. Progress in neurobiology, 88(2), 127–151. PMC free article
Prohaska, J. R., Gybina, A. A., Broderius, M., & Brokate, B. (2005). Peptidylglycine-alpha-amidating monooxygenase activity and protein are lower in copper-deficient rats and suckling copper-deficient mice. Archives of biochemistry and biophysics, 434(1), 212–220. PMC free article
Yoshimura, M., Conway-Campbell, B., & Ueta, Y. (2021). Arginine vasopressin: Direct and indirect action on metabolism. Peptides, 142, 170555. PMC free article
Song, Z., & Albers, H. E. (2018). Cross-talk among oxytocin and arginine-vasopressin receptors: Relevance for basic and clinical studies of the brain and periphery. Frontiers in neuroendocrinology, 51, 14–24. PMC free article
Bhathena SJ, Werman MJ, Turnlund JR. Opioid Peptides, Adrenocorticotrophic Hormone and Dietary Copper Intake in Humans. Nutr Neurosci. 1998;1(1):59-67.
Yin, P., Bousquet-Moore, D., Annangudi, S. P., Southey, B. R., Mains, R. E., Eipper, B. A., & Sweedler, J. V. (2011). Probing the production of amidated peptides following genetic and dietary copper manipulations. PloS one, 6(12), e28679. PMC free article
Kaufmann, P., Bergmann, A., & Melander, O. (2021). Novel insights into peptide amidation and amidating activity in the human circulation. Scientific reports, 11(1), 15791. PMC free article
We at CopperOne think that any copper in the cuprous, Cu+, oxidation state is best because entering through the specific Ctr1 channel is like entering a hotel through the front door. Once you enter, you have a bell hop and concierge to help you find your way to your room and make sure that electron you’ve got in your outer valence shell doesn’t go where it shouldn’t. Like O2!!!
Only copper in the Cu+ oxidation state is allowed to enter the hotel of the cell through Ctr1.
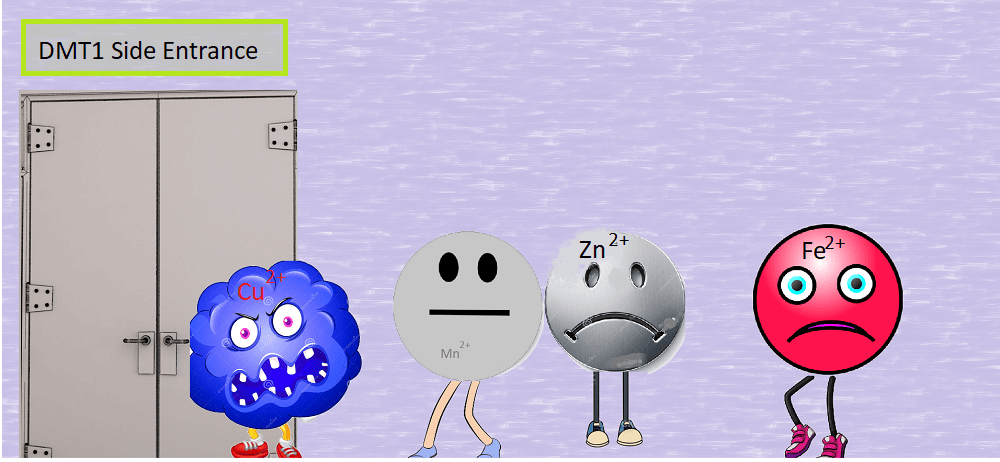
DMT1 is like a side door
We at CopperOne call the +2 oxidation state Cu2+ “toxic copper.” Well, it is better than nothing if one is a cow or goat eating copper deficient vegetable matter and made more copper deficient with molybdenum. (For a very technical post, follow this link.) We hear stories of humans taking mega doses of copper sulfate. Why??? Sure, it can enter through the divalent metal cotransporter (DMT1) side door. Why should some of the other divalent minerals that our bodies need have to stand in line?
These are some of the divalent metal cations that
Sure, Cu2+ entering through the DMT1 side door will eventually get reduced to Cu+ via glutathione or something. Not that this is speculation waiting to be experimentally verified. It will make its way to its room, we hope. It just seems profoundly ill advised to take mega doses of any form of Cu2+… to us anyway.
It should be noted that both Cu+ and Cu2+ can bind to the transcription factor Sp1 to shut down the expression of Ctr1.
This post examines a report from the laboratory of Dr Christopher Fahrni at Georgia Tech University. What this group is saying is that the small molecule glutathione can chaperone intra cellular Cu+ to really low femptomole levels. [1]
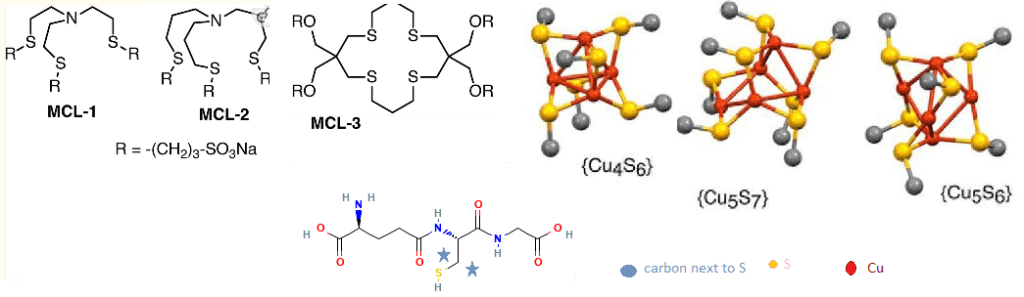
This is a glutathione molecule. The carboxy C-terminus (had end) is a glycine. A carboxy group is -COOH. The “butt end” N-terminus of glycine is –NH2, an amino group. The middle amino acid is cysteine with the yellow –SH side chain. The Carboxy group of csyteine can come behind the butt end of glycine and take a big ole bite and kick off a H2O in the process. An amide bond is formed. The tail end of glutathione is formed when the -COOH of the side chain of glutamine comes in and takes a big ole bite of the butt of cysteine. Again, a H2O is formed from the OH of the glutamine side chain and a Hof the -NH2 amino terminus of cysteine. The The pKa values are from UCLA.
a molecule of glutathione (GSH) . Note, biochemists call the butt end the N-terminus. The “head” end is called the C-terminus.
The pKa, to be protonated or not
The pKa in very simple terms is the pH in which 50% of the green circled “H” are there are dissociated leaving no charge in case of the amino (butt) terminus -NH2 group or the carboxy terminus -COO– group.
The official macroscopic pKa values corresponding to sequential deprotonation of glutathione are as follows:
the Glu-α-COOH, 1.98
Gly-COOH, 3.49
–SH, 8.64
Glu-NH3+ , 9.36.
with the note that GSH exists primarily as a mono anion at neutral pH. [1]
The Fahrni group used three water soluble monovalent Cu ligands (MCL1-3) with known affinities for Cu+ to compete with GSH. We will not present the sophisticated optical techniques they used to use these competing MCL1-3 copper ligands to measure the interaction of GSH molecules for Cu+.
the concept of glutathione clusters
Quoted from the publication:
“Free GSH exists primarily in mono anionic form at pH 7, whereas cluster formation presumably entails S-deprotonation to the corresponding dianion, which we represent as GS−. An equilibrium between clusters differing in Cu(I)/glutathione ratio would therefore depend on [GS−], which is influenced by both [GSH] and pH. Once the latter is significantly below the thiol pKa of 8.75, each further unit drop in pH will decrease the GS−/GSH ratio by 10-fold. We therefore measured pairs of solutions containing either 1 mm GSH or 10 mm GSH at 1 unit lower pH.” The typical GSH-Cu complex was determined to be [Cu4(GS)6] as the dominant species over a wide pH range, from 5.5 to 7.5. [1]
MCL1-3 are probes the group used to compete with GSH for Cu+. Cu4S6, Cu5S7, and Cu5S6 are theoretical models based on other studies in the literature. Only the carbon next to the Cu binding S is shown for clarity.
Skipping some complicated techniques, the Fahrni group came up with an equation for “parts” Cu+ that is analogous to parts H+, or pH. pH is the –log base 10 of the concentration of H+ in molar. The log10 of 0.1 M H+ is “-1” Minus the log10 is pH 1. Going in the opposite direction, the concentration of H+ at pH 10 is 10-10 moles per liter H+, or 0.0000000001 moles per liter!
Say some catastrophic even occurs and results in 10 mM GSH being oxidized to 4 mM GSSG leaving only 2 mM GSH.
The first term goes from 1.5x -2 = -3 to 1.5x-2.7 = -4
For the 2nd term, say we go from 1.5 x pH 7.4 = 11.1 to 1.5 x acidic pH 6 = 8
10uM total Cu = -0.25x (-5)= 2.5 and 1uM = -2.5x (-6)= 1.5
Good conditions: pCu= -3 + 11.1 – 2.5 + 8.26 = 14 10 -14 M free Cu is really low. We could be at 10-15 M or 1 fM free copper if we went even lower in total copper.
Not so good conditions: pCu = -4 + 8 -1.5 + 8.26 = 10.8 = 10-11 M free Cu. pH and reduced glutathione are far more important determinants of free copper, than total copper.
Prior to the Fahrni group’s study, scientists had known for decades that Cu+, in the very reducing interior environment of the cell, formed complexes with reduced glutahione. This is the genius of cuprous nicotinic acid that we call CopperOne.
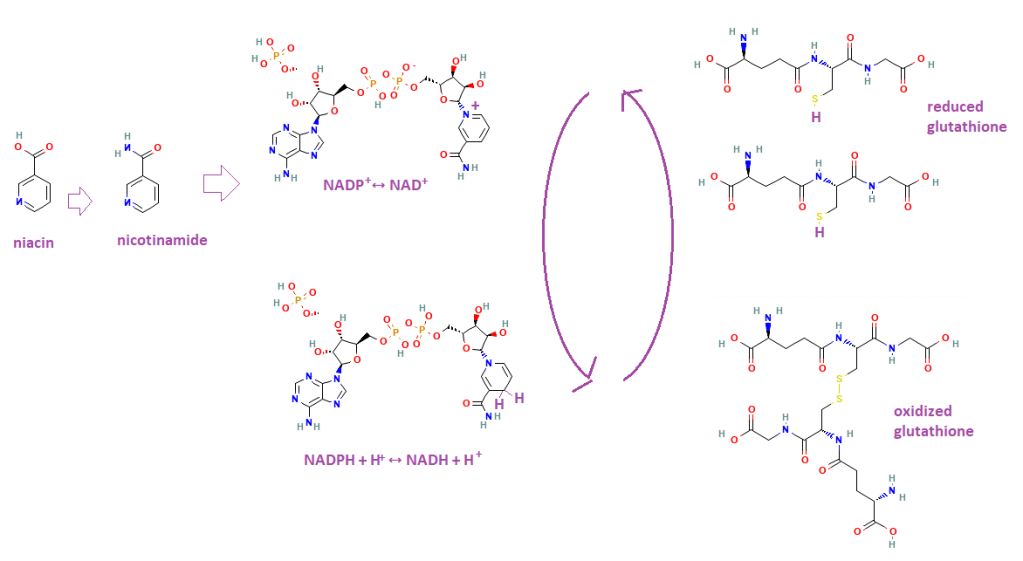
Why we need niacin and NADH/NADPH
Niacin is a precursor to nicotinamide, which is part of nicotinamide adenine dinucelotide (NAD) that may be phosphorylated shown as a phosphate not totally attached to a ribose group. The NADPH/NADP of source of reducing equivalents maintains the reduced state of the GSH thiol.
Bernt and coauthors have written a nice review on the role of thioredoxin and glutaredoxin in maintaining the reduced state of glutathione and protein thiols. [2] This figure only shows GSH in a GSSG disulfide bond that prevents proper buffering of intracellular copper. Further oxidation states are also possible. if it were not for NAD/NADP and thio and glutaredoxin. [2]
We become so worried about an increase in total copper in our cells and forget that free copper is more deleterious.
If we have a decrease in electron transport chain activity because complex IV lacks Cu, we have an increase in glycolysis and a decrease in pH. This increases free Cu. If we do not have fully active Cu/Zn superoxide dismutase, the same -S group in GSH might also become oxygenated to cysteine sulfenic acid -SOH that is a precursor to -S-S- disulfide bond. [2] Higher order cysteine oxidation products are possible. [2] Perhaps we should worry less on the affect of extra copper on free copper when we also should think about the role of niacin and NAD that contribute to this remarkable balance of nature that keeps the free copper in our cells insanely low!
References
Morgan, M. T., Nguyen, L., Hancock, H. L., & Fahrni, C. J. (2017). Glutathione limits aquacopper(I) to sub-femtomolar concentrations through cooperative assembly of a tetranuclear cluster. The Journal of biological chemistry, 292(52), 21558–21567. PMC free article
Berndt C, Lillig CH, Holmgren A. (2007) Thiol-based mechanisms of the thioredoxin and glutaredoxin systems: implications for diseases in the cardiovascular system. Am J Physiol Heart Circ Physiol. 2007 Mar;292(3):H1227-36. free article
What is new (to us) for Cu(I) in cardiovascular disease
We at CopperOne have been obsessed with Covid. In the process of honoring our late colleague George Brewer, we are reexamining the Cu(I) literature. In 1973 Leslie Klevay was perhaps first to sound the alarm that a high ratio of zinc to copper in the drinking of rats fed egg white protein, sucrose, and vegetable oil could raise cholesterol and contribute to heart disease. [1] Eight years later Klevay and Viestenze published a report that rats on a copper deficient diet had abnormal electrocardiograms as well as a 39% increase in blood cholesterol. [2] It’s been close to 50 years since Dr Klevay’s first report. What have we learned? What we are learning is that maybe the copper dependent collagen cofactor enzyme lysyl oxidase may be an important player that is being overlooked. Lay readers might want to skip to the end for a cartoon summary of our journey through the literature.
Three reviews, back up of animal data
We have posted much on copper handling proteins on this website. What do experts in heart disease say in their reviews on copper? More importantly, what do the latest animals studies say on copper deficiency and heart disease?
Who authored these reviews?
[3] James J DiNicolantonio is part of the Mid America Heart Institute and author of The Salt Fix. Dennis Mangan is a sales and scientific communication guy. James H O’Keefe is a scientist at CardioTabs, a dietary supplement company, and on the staff at the Mid America Heart Institute.
[4] Tohru Fukai and Musuko Ushio-Fukai are affiliated with the Vascular Biology Center at the Medical College of Georgia in Augusta. Jack Kaplan is in the Department of Biochemistry and Medical Genetics at the University of Illinois, Chicago
[5] Yun Liu is part of Guangzhou Medical University in China. Ji Miao is now at Boston Childrens. Dr Miao studies copper deficiency in a number of rodent models of human diseases.
back up Cu deficient animal studies
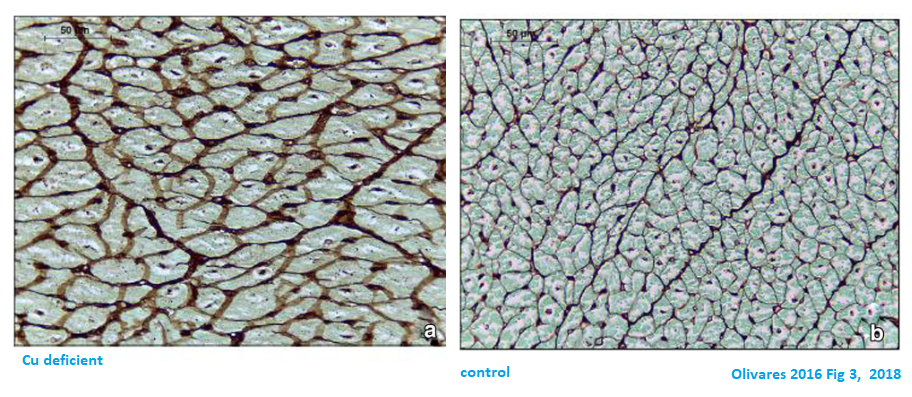
Roberto Olivares is a professor at the Universidad de Buenos Aires. Cattle were made Cu deficient with a diet supplemented with sodium molybdate (11 mg of Mo/kg). The other group received 9 mg/kg copper sulfate. Each group and nine bovine that were followed for close to a year. [6] After almost a year Cu deficiency had no significant influence on weight but halved the serum Cu and decreased the heapatic Cu to less than 5% of the control. [6]
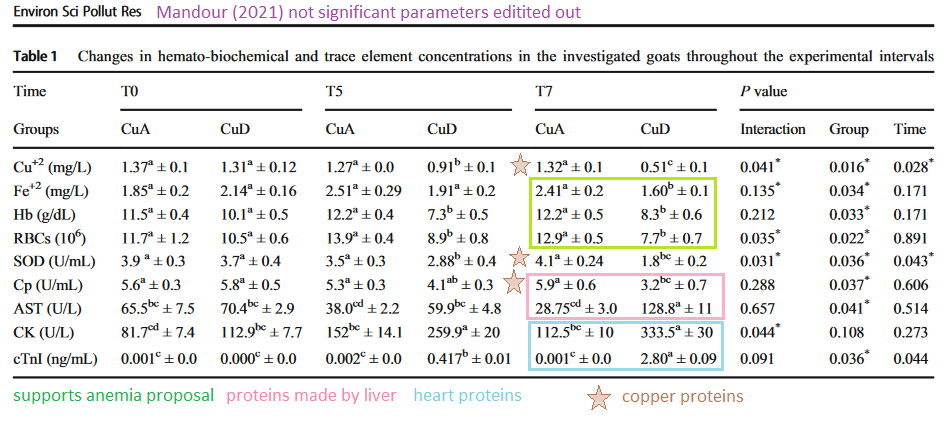
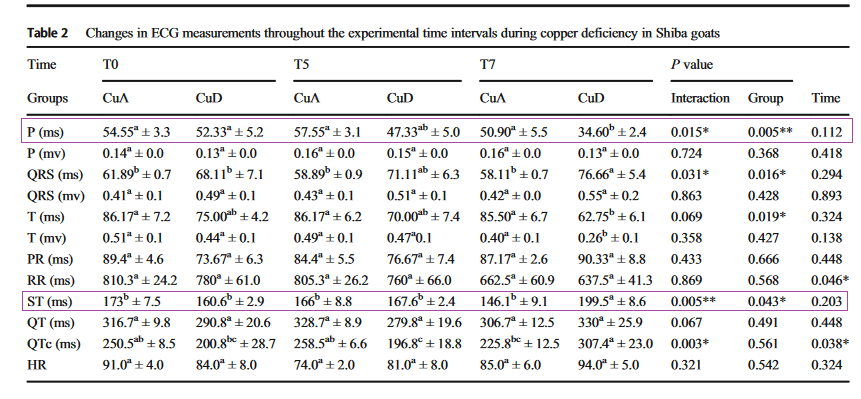
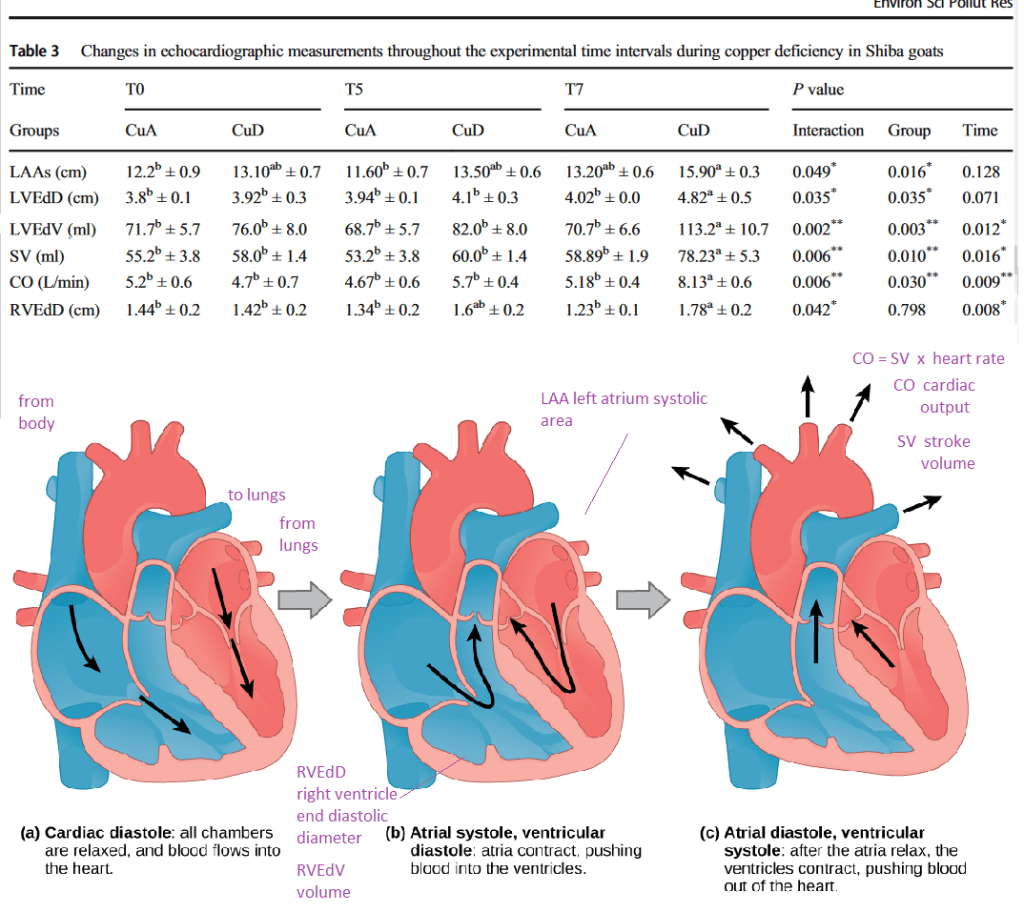
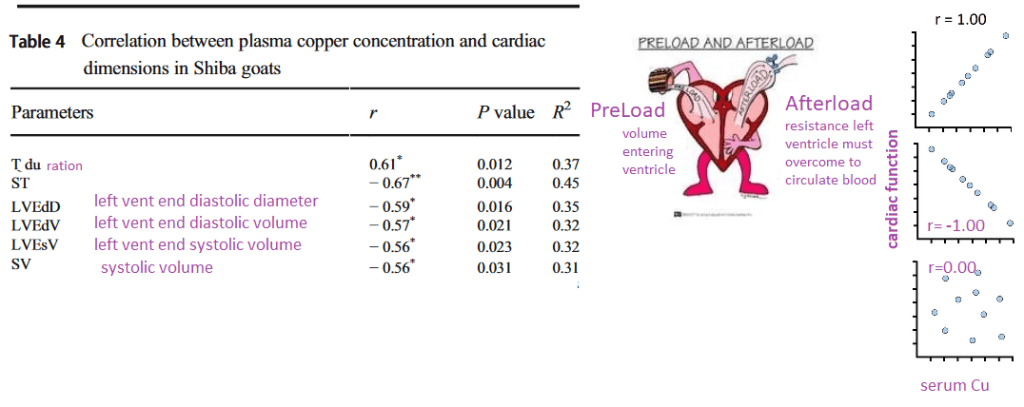
Ahmed Mandour of Suez Canal University and other authors from Egypt and Japan compared cardiovascular measurements of copper adequate and deficient goats. [7] Male Shiba goats were fed a diet of alfalfa hay cubes supplemented with 11 mg of Cu+2/kg dry matter. Molybdate sulfate was used to induce Cu deficiency. [7] These animals were followed for seven months with electrocardiograms, echocardiograms, and routine blood work. [7]
Ctr1
The DiNicolantonio review did notCtr1. [3] The Fukai gave a good discussion of structural components in transporting Cu+ [4]. The Liu/Miao review alsocovered the need for prior reduction of Cu2+ to Cu+, perhaps by STEAP, for transport by Ctr1 [4,5] The Liu/Miao review also discussed the consequence of Ctr1 down down in rodent heart disease models. [5]
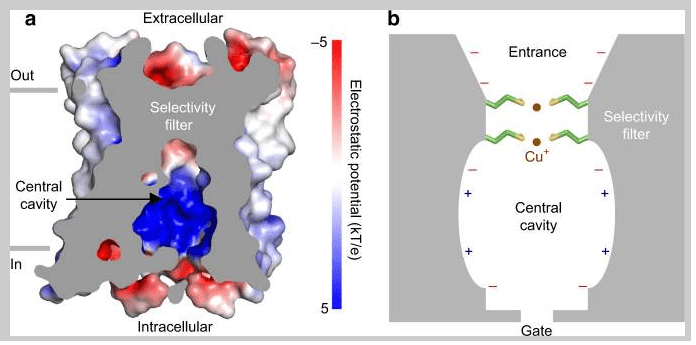
Figure 3, from Ren (2019). A charge on the interior of Ctr1 b. a cartoon version of the entrance, selectivity, filter, and central cavity.
We’ve discussed this image on our own Ctr1 post. Personal communications with Ji Miao reiterate our conviction that Cu+ is most natural and least toxic way to absorb copper.
atox
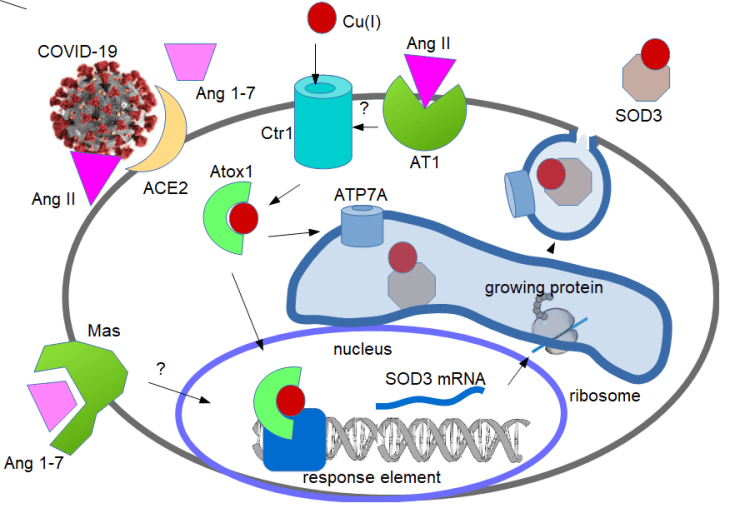
The Fukai review mentioned the anti oxidant protein 1 (Atox1) being both a chaperone ferry from the Ctr1 to the nucleus as a transcription factor [4] The Liu/Miao review discussed the interplay between Atox1, angiotensin II, and expression of Cu/Zn SOD3. [5] We’ve discussed this in another post on Atox1 in Covid… of course.
Copper in the +1 oxidation is involved in several levels in producing Cu/Zn SOD3 (1) as acquired by Cu(I) channel Ctr1 (2 ) in chaperone/transcription factor Atox1, (4) in channel ATP7A that loads Cu in Golgi where SOD3 is being processed for secretion.
Atox1 in Covid post went into more details into the cardiovascular function of angiotensin II in increasing blood pressure and how Cu/Zn SOD3 mitigates this response.
Other chaperones
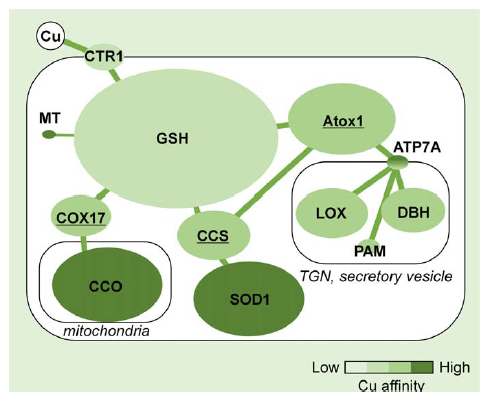
We have covered copper chaperones in another post. The DiNicolantonio review had very little to say about chaperones, but much to say about SOD. [3] Not yet covered on this site is the production of peroxy nitrite when NO reacts with nitric oxide. NO. is needed to relax blood vessels. The Liu/Miao review makes brief mention of SCO1-2, the cytochrome C oxidase assembly protein, and mutations that can cause heart disease [5]. The Fukai review mentioned SCO and went into more detail about CCS, the chaperone for Cu/Zn SOD. [4]
From Hatori, 2017 [18]
GSH chaperone of Cu+was covered in another post. The affinity of GSH complexes for Cu may not be as it was pictured in the Hatorie review covered on the copper chaperones post. We have largely ignored PAM, peptidylglycine alpha-amidating monooxygenase. Dopamine beta hyroxylase (DBH) is also largely off the radar in terms of cardiovascular disease reviews. What are the important copper cofactor enzymes in heart disease?
Cu/Zn SOD
All reviews agree that the ability of Cu/Zn superoxide dismutase to scavenge superoxide is important. [3-5] In the bovine study, cardiac Cu/Zn SOD activity decreased from 23.8 ± 7.2 to 16 ± 5.4 U per gram tissue in the Cu adequate versus deficient animals. [6] Thiobarbituric acid reactive substances (TBARS) are formed as a byproduct of lipid peroxidation. These were increased from 76.9 ± 27.2 to 154.3 ± 37.4 moles per gram heart in the Cu adequate versus deficient bovines. [6]
Table 1 from Mandour 2021 Values are expressed as mean ± SEM (n = 4). Hematological and biochemical parameters in copper adequate (CuA) and copper-deficient (CuD)groups analyzed using two-way ANOVA. The lowercase letters are fitted for comparing means between groups. LSD < 0.05. * P < 0.05 fitted to compare the significance of group, time, and interaction. These are blood values. Cardiac TnI is a blood marker for cardiac injury. Comments are those of CopperOne.
By the seventh month, the copper deficient goats had a notable decrease in SOD activity and ceruloplasmin ferrioxidase activity. Cardiac troponin I is a heart protein that only appears in the blood when the heart has been damaged. Ceruloplasmin, Cp, is also a carrier for iron. Dr Mondour and coauthors made a argument that the cardiac problems seen in the goats could have resulted from iron deficient anemia. [7] Creatine kinase is found in heart, skeletal muscle, and brain; finding it in the blood is a sign of damage.
lox, lysyl oxidase
Lysyl oxidase is a copper cofactor enzyme that cross-links collagen fibrils. DiNicolantonio and coauthors presented a compelling argument that this cross-linking contributes to the mechanical properties of the heart. [3] This group also thinks that advanced glycation endproducts are a problem in Cu deficiency. [3] The Fukai group discussed lox from the standpoint of vascular wound and the consequences of lacking the caperone Atox1 and the transporter ATP7A. [4] Liu and Miao also focused on collagen cross linking and mechanical properties of the heart. [5]
Fig. 2 Olivaras Area occupied with connective tissue. IS, interventricular septum;LV, left ventricle; RV, right ventricle; WM, whole myocardium. *Statistically different (P < 0.05) with respect to control Images have been added to show the chemistry of collagen cross linking and formation of advanced glycation end products.
The GMS stain reacts with carbohydrates. If lysyl oxidase is under active, the aldehyde form of glucose could react with the side chains of lysine that have not undergone the oxidation to the allyl lysine form (above).
Fig. 3 Histopathological image of left ventricle myocardium stained withGMS, × 400. Deficient animals showed a severe thickening of myocytes basement membranes (a) with respect to control group (b)
cytochrome C oxidase..ATP to power the heart beat
Or not. Copper deficiency may be linked decreased Cox activity and ultimately cardiac hypertrophy. [3,5] Cardiac Cox was not significantly different between the adequate and deficient bovines. [6]
ATP and the action potential
Cytochrome C oxidase is a component of the mitochondria that makes ATP. ATP is an absolute requirement for the action potential That signals a post synaptic neuron to
Steps of the actin potential that apply to post synaptic neurons and to muscle.
Action potentials, in neurons and muscles require the ATP fueled Na Pump to return to the resting membrane potential. Muscle contraction requires to other ATP intensive processes. The action potential in muscle travels to the DHP Ca2+ channel that signals the Ryanodine (& caffeine) receptor to release even more Ca2+ from the sarcoplasmic reticulum. Ca2+ binds to TnC of the troponin complex that moves tropomyosin aside so that myosin heads may move about on actin. This of course requires ATP! Getting Ca2+ back into the SR requires ATP!
The makers of CopperOne have a tendency to want to make everything about ATP and the mitochondria. Let us continue this journey that leads to Cu/Zn SOD and lysyl oxidase.
Mandour et al ECG and echo data
This is an extremely nice study by a group of physiologists.
ECG data
Electrocardiogram (ECG) is a recording of the heart’s electrical activity during the cardiac cycle. The ECG is a graph of electrical potential difference detected by electrodes placed on strategic places on the skin … as a function of time.
Fig. 1 Mandour (2021) Illustrative electrocardiography obtained from the base-apex lead in Shiba goats. Normal sinus rhythm of goats showing rS (a) and qRs (b)patterns. Paper speed 50 ms;voltage 20 mv
Only specific intervals of the cardiac cycle were prolonged in the Cu deficient goats.
Mandour 2013 “Note: Values are expressed as mean ± SEM (n = 4). ECG obtained from base apex lead at three interval times presented as two-way ANOVA. Thelowercase letters are fitted for comparing means between groups. LSD <0.05. * P < 0.05 fitted to compare the significance of group, time, and interaction ms millisecond, mv milli volt, QTc corrected QT, HR heart rate”
In the ECG data the P wave duration and the time between the QRS and T wave were the most influence by copper. Note that there was no change in heart rate as a result of copper deficiency. Changes in the ST segment are usually associated with ischemia. Indeed, a significant negative correlation was observed for the ST interval as a function of serum copper, see table 4 edited for only significant values. Graphs on the right hand side illustrate hypothetical correlations. The more copper, the longer the T segment duration.
Echo cardio data
Table 3 from Mandour 2021 has been edited to show only the significant results. Some images of the cardiac cycle have been added for the non cardiologists. The cardiac output and stroke volumes have increased, the end volumes and diameters have also increased. It’s as if blood is moving through
Correlating heat data with serum copper content…
A highly edited version of Table 4 from Mandour 2021. Cartoons explaining preload and after load and correlation coefficient have been added for clarity.
Dr Mandour and colleagues attributed the prolongation of the ECG parameters in the Cu deficient group at five and seven months to ventricular enlargement via hypertrophy or dilation. [7] They proposed that the reduced ECG T-wave duration may be due to cardiac damage as based up by increases in systolic volume, cardiac output, left atrium area, and so on in Table 3. Increased preload and cardiac dilatation were cited as possible explanations. [7] The preload is the extent of which the sarcomers are stretched before the heart contracts. Mandour and coauthors favored cardiac remodeling in response to anemia as the explanation. [7] Anemia results in decreased systemic peripheral resistance and thus a decreased afterload. Interestingly. anemia may arise from decreased plasma and cardiac Fe2+ secondary to the decrease in Cu. [7] In spite of these alterations, the copper deficient goats did not develop severe cardiomyopathy or heart failure. these are some images of goat hearts in the Mandour 2021 study. [7]
Mandour 2021 Fig. 3 Necropsy examination of the heart at the end of the experimental CuD in goats. a Normal appearance of the heart from the CuA (control) group showing no gross lesion. b Goat’s heart from CuD group showed a widespread of paleness, grayish streaks of myocardial degeneration, and necrosis (black stars). c Focal necrotic lesion on the external surface of the heart (white arrow)
Conclusions…
We’ve known from early studies of Leslie Klevay that Cu deficiency is associated with heart disease. [1,2] What we have posted about copper in regards to Covid-19 is more or less consistent with what experts in the heart have written about Cu deficiency and heart disease. [3-5] Olivares and coauthors found increased extracellular matrix and decreased serum and hepatic Cu in Cu deficient bovines. [6] Much of the Olivares report focused on mitochondrial defects. [6] Mandour and coauthors conducted and extensive cardiology study on Cu deficient goats. A concluding suggestion that secondary iron deficiency anemia might be cause of decreased after load and accompanying cardiac changes. [7] We could just as easily argue that a decrease in Cu/Zn SOD could allow super oxide to react with the blood vessel relaxing small molecule nitric oxide. We could also argue that changes in lysyl oxidase cross linking of collagen in blood vessels is important. The cartoon of Hatori and coauthors says it all. CCO might get first dibs when Cu is deficient. Lysyl oxidase being further down in the Cu “lunch line” may create long term problems.
Thoughts which copper enzymes are important in copper deficiency after reading the literature. The ones that are most important for short term survival may get Cu+ first based on affinity [8] but they may all be important in long term heart health.
This is the CopperOne summary_cartoon. Thank you for reading.
References
Klevay LM. (1973) Hypercholesterolemia in rats produced by an increase in the ratio of zinc to copper ingested. Am J Clin Nutr. 1973 Oct;26(10):1060-8.
Klevay LM, Viestenz KE. Abnormal electrocardiograms in rats deficient in copper. Am J Physiol. 1981 Feb;240(2):H185-9. doi: 10.1152/ajpheart.1981.240.2.H185. PMID: 7468813.
DiNicolantonio JJ, Mangan D, O’Keefe JH. Copper deficiency may be a leading cause of ischaemic heart disease. Open Heart. 2018 Oct 8;5(2):e000784. PMC free article
Fukai, T., Ushio-Fukai, M., & Kaplan, J. H. (2018). Copper transporters and copper chaperones: roles in cardiovascular physiology and disease. American journal of physiology. Cell physiology, 315(2), C186–C201. PMC free article
Liu, Y., & Miao, J. (2022). An Emerging Role of Defective Copper Metabolism in Heart Disease. Nutrients, 14(3), 700. PMC free article
Olivares RWI, Postma GC, Schapira A, Iglesias DE, Valdez LB, Breininger E, Gazzaneo PD, Minatel L. (2019) Biochemical and Morphological Alterations in Hearts of Copper-Deficient Bovines. Biol Trace Elem Res. 2019 Jun;189(2):447-455. free article
Mandour AS, Elsayed RF, Ali AO, Mahmoud AE, Samir H, Dessouki AA, Matsuura K, Watanabe I, Sasaki K, Al-Rejaie S, Yoshida T, Shimada K, Tanaka R, Watanabe G. The utility of electrocardiography and echocardiography in copper deficiency-induced cardiac damage in goats. Environ Sci Pollut Res Int. 2021 Feb;28(7):7815-7827. free article
Hatori Y, Inouye S, Akagi R. Thiol-based copper handling by the copper chaperone Atox1. IUBMB Life. 2017 Apr;69(4):246-254. free article