Author: BL

  • Bacteria Surface Charge

    Bacteria Surface Charge

    Wilhelm MJ, Sharifian Gh M, Wu T, Li Y, Chang CM, Ma J, Dai HL. Determination of bacterial surface charge density via saturation of adsorbed ions. Biophys J. 2021 Jun 15;120(12):2461-2470. PMC free article

    The goal of this post is to introduce lay people to the work of the Michael Wilhelm and colleagues at Temple University in Philadelphia, Pennsylvania.  The question has been asked if Cu+ or Cu2+ changes the surface of bacteria more than the other.This report is full of insights and one tidbit as to why Cu+ might be the better biocide.

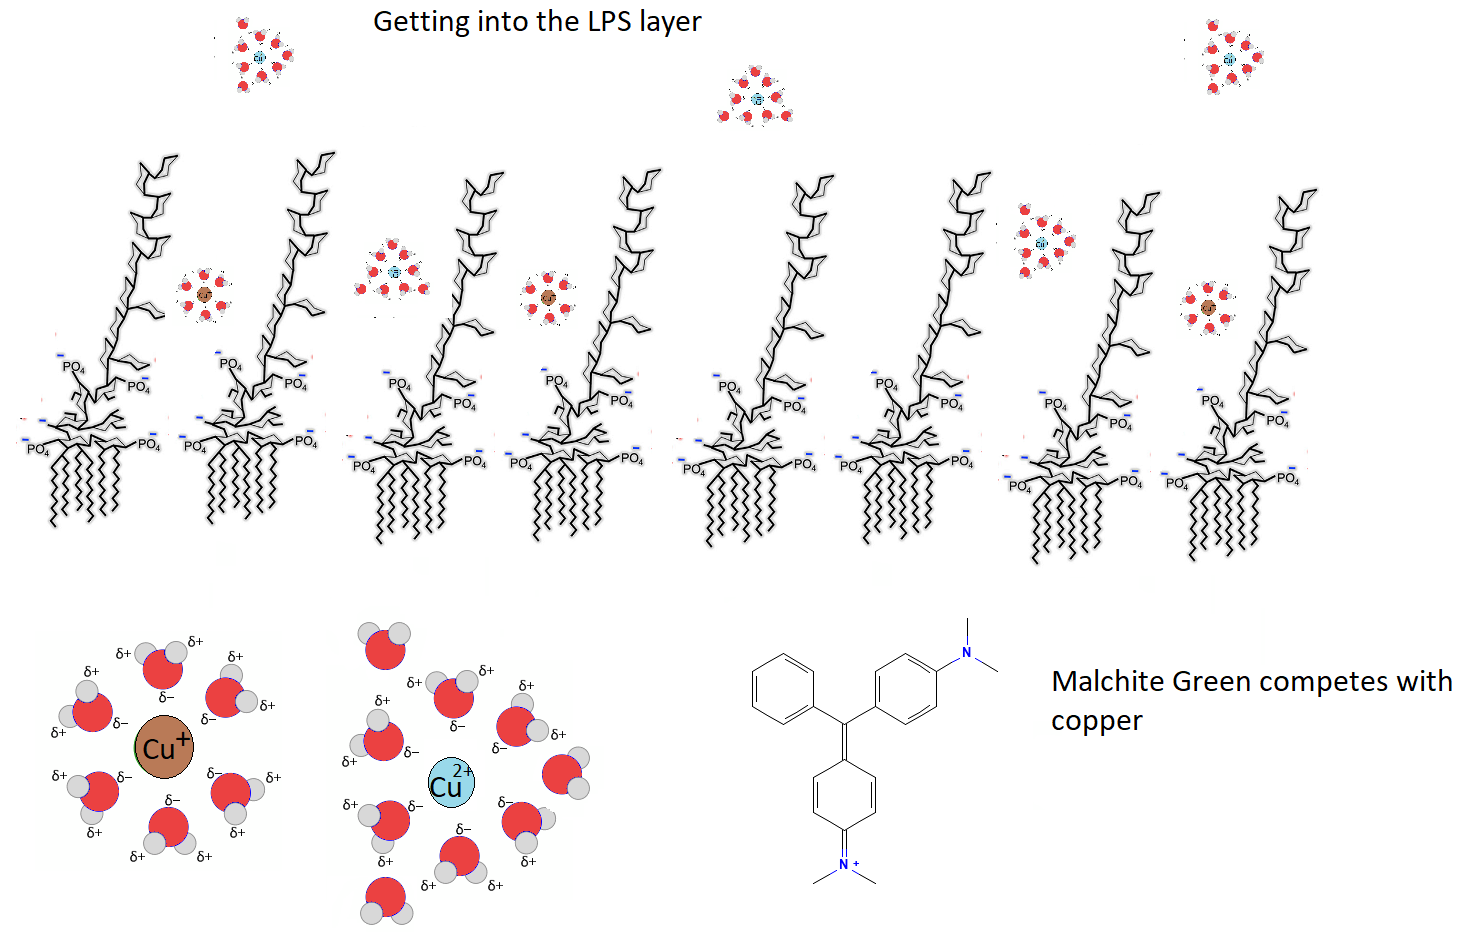
    The feature image tells the hypothesis this paper inspired. Malachite green is a reporter probe that binds to negative charges on bacteria cell walls just like Cu+ and Cu2+ do. The hydrated radius of Cu+ is predicted to be smaller than that of Cu2+and can more easily diffuse into the cell wall. Neutralization of phosphate negative charges should prevent binding of the MG reporter.

     Structures of bacteria cell walls

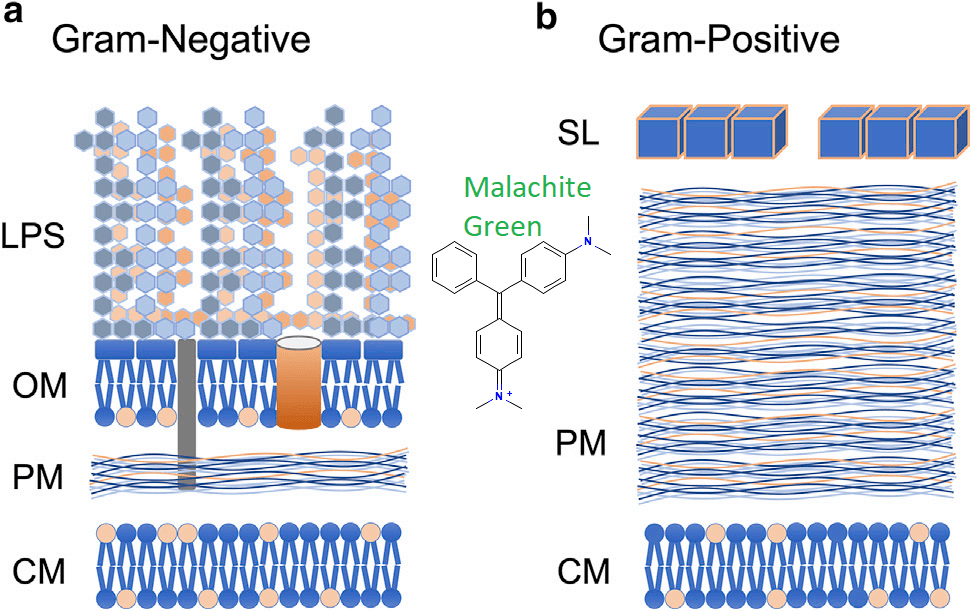
    • OM  The outer membrane of phospholipids.   In gram negative bacteria, lipopolysaccharide, LPS is part of this layer.  The authors estimated 2-8nm wide water channels in this layer.
    • PM  Gram positive bacteria have comparatively more piptidoglyan mesh (PM)   Both have an inner cytoplasmic membrane (CM). Note the comparative thickness of PM in Gram positive bacteria.  Pores in these structures are 7-12nm wide.
    • CM Gram-positive cells have only a single phospholipid membrane, the inner cell membraneCM.  The PM layer is much thicker. which is surrounded by a substantially thicker PM.  Gram-positive bacteria also have an S-layer of crystalized proteins on their surface.  All of these substances have the potential to bind copper and other antimicrobial compounds.
    • SL is a shell of crystallized proteins on the surface layer of  Gram positive bacteria. The bacterial S-layer is a homogeneous protein wall, self-assembled into a crystalline lattice with regularly spaced pores of distinct symmetry (e.g., oblique, square, hexagonal)  Negatively charged amino acids predominate this protein layer.
    • MG, malachite green, a 1nm wide hydrophobic dye that is 5-% in the +1 charge state at pH 6.9.  This makes it small enough to diffuse to the cell membrane. The MG cation has an electronic absorption band near 400 nm and consequently its second order nonlinear polarizability is resonantly enhanced when exposed to fundamental light of 800 nm. Neutral MG lacks these electronic transitions.  Only surface bound MG cations can be observed.  MG may diffuse across lipid bilayers.  These appear to be SHG.

    All of these layers tend to have a negative charge and therefore the potential of binding mono and divalent cations and the malachite green probe used in these experiments.  There is a time component of diffusion through these layers too. In these experiments Lactobacillus, L. rhamnosus was the representative Gram-positive bacterium and Escherichia, E. coli the representative Gram-negative bacterium.

    Three techniques were used

    1. SGS/SHG Second Harmonic Light Scattering occurs when a portion of an incident light of frequency ω is converted to 2ω after interacting with a material.  This is a two photon process by which two photons of the same initial energy interact with a nonlinear material and combine to produce a single photon of twice the energy, twice the frequency, and half the wavelength… s new color that is blue shifted from the initial incident light. Probes that generate such signals are SHG.
    2. Light phase microscopy to estimate cell surface area
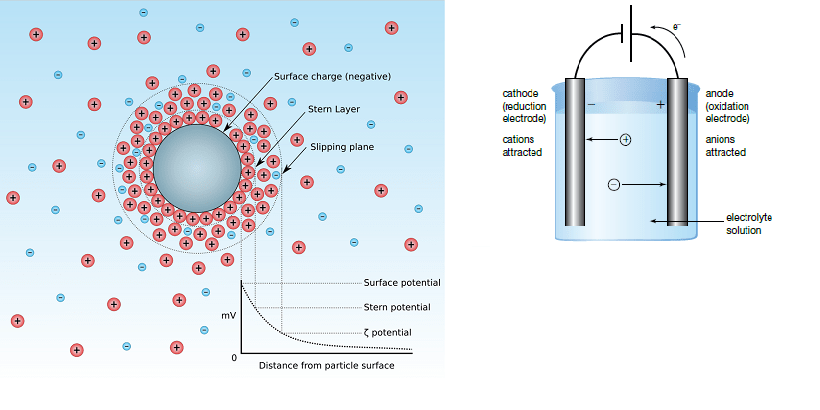
    3. Zeta potential was used to measure total charge absorption

    On MG binding to cell membranes

    Adsorption of MG cations onto bacterial surfaces occurs primarily through an attractive electrostatic interactions with the OM of LPS or the S layer of Gram positive L rhamnosus. Then it migrates inward with the final destination of the cell membrane.  It was not if the peptidoglycan layer is electronically silent.  In Figure 7 we see that there are multiple components of LPS.

    The concentration dependent signal response at each interface allowed the authors to construct Langmuir adsorption isotherms, which allowed for the calculation of charge density. Brightfield transmission microscopy was used to estimate the surface area that would ultimately be used to determine the charge density. 

    Both cell types exhibit an outer layer responsible for rapid binding.  Diffusion through water filled channels to the cell membrane might represent the drop in the SHS signal.

    Saturating negatively charged groups with MG+

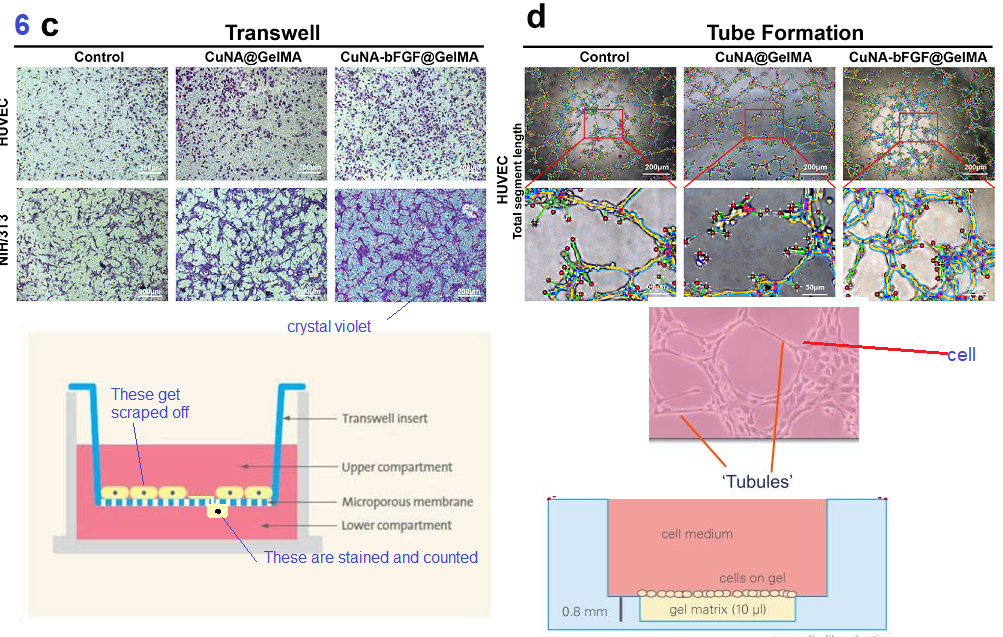
    Once saturation is achieved and no more can be absorbed, there is no further increase in the SHS signal. The authors noted that any SHG-active cation, not just MG ion, can be used as the surface charge probe.  Crystal violet, the basis of staining Gram positive, is SHG active as is propidium.

    To determine the saturation density of MG cations adsorbed on the external surface of the bacteria, the authors measured Langmuir adsorption isotherms by plotting the SHS peak intensities (deduced from data in Figure 4,

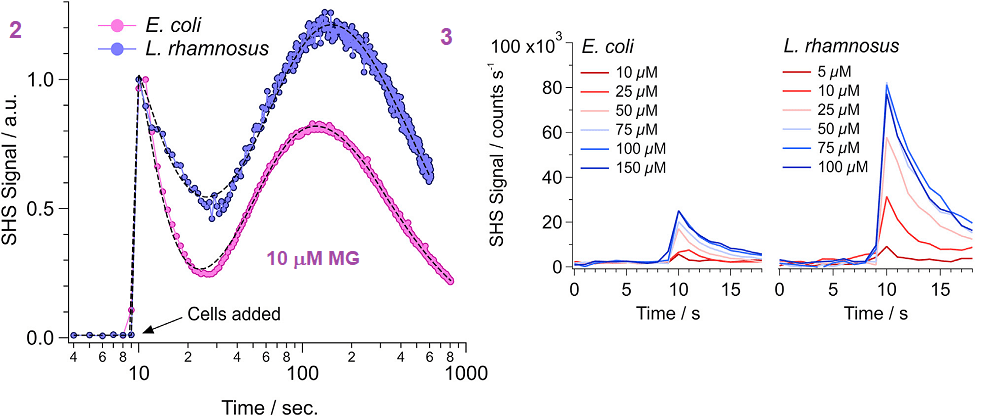
    Figure 4  Each point is the average of three experiments ± the standard deviation of the mean.  Note that Gram negative E coli requires significantly more MG to saturate the outer layer of the surface.  These experiments were performed at the pKa of MG, pH 6.9 at which half the MG will be by definition carry a charge of +1.  As the MG cation concentration increases, the magnitude of the measured SHS signal likewise increases. 

    • The flat portion of this curve represents all accessible negatively charged sites being occupied by MG.   If Cu+ were present, this saturation would be predicted to occur at a lower MG concentration.  For L. rhamnosus, saturation occurs at 5.8 mM, whereas and70.3 mM for E coli
    • At saturation, four times more SHS signal is measured for MG cations interacting with L. rhamnosus (~80,000 counts/s) than E. coli (~20,000 counts/s).

    Unlike SHG, zeta potential measures the total charge and is not specific to the outermost bacterial surface (e.g., the outer surface of the OM). Zeta-potential results from the cumulative charge of the entire bacterial cell wall complex, including contributions from both sides of both the OM and inner membrane, as well as the peptidoglycan. Cationic MG has access to all anionic-binding sites within the bacterial cell wall complex and is able to neutralize them all.

    Calculating charge density

    This process was repeated for more than 325 cells of each strain.  E. coli and L. rhamnosus are very similar in size: 2.8 mm long by 1 mm wide.  E. coli has a slightly larger average surface area of 11.0 ± 1.5 mm2 compared with 10.1 ± 1.4 mm2 for L. rhamnosus.  Mathematical analysis took into consideration the total quantity of MG in the solution and on the bacterial surfaces is constant thus  permitting the  determination of surface density (Nmax) as well as the equilibrium adsorption constant  These parameters allowed for the calculation of the free energy of adsorption (ΔGads).

    Discussion

    In Gram Pos bacteria MG” is restricted to the surface layer of proteins with a lot of negatively charged amino acids, 7b. Gram Neg surface charge is really a 3D matter of vertically packed phosphates on LPS that can bind multiple MG+ cations. In panel 7b MG+ is binding to multiple phosphate groups on one small plot of surface area.

    MG cation saturation density of 6.6 ±1.3 nm-2 suggests an average net anionic charge of q = 5.5 ± 1.6 for each of the LPS in the strain of E. coli used in this study.  This agree with results of previous studies that the authors cited.

    This value is reasonably consistent with previously deduced

    • Salmonella minnesota (q ≥≥ 5),
    • Chromobacterium violaceum (q ≥ 4),
    • Rhodobacter capsulatus (q ≥ 4.5),
    • Paracoccus denitrificans (q ≥ 5)
    • E. coli (q ≥ 5) 

    Apparent contradictions in these data

    • MG bond on the surface of L. rhamnosus yields ~4x the SHS signal  compared with E. coli.
    • 7x more MG binds to E coli

    MG may simply be more aligned and a better SHG in the Gram positive bacterium.  This adsorption geometry is expected to yield a larger coherent nonlinear polarization from the adsorbed ensemble of MG cations through constructive interference. MG cations are predicted to be more tilted toward the surface plane when bound to LPS resulting in partial cancellation of the nonlinear polarizability and hence a smaller SHS signal.

    Surface charge

    • Gram positive, one cation per nanometer squared
    • Gram negative, seven cations per nanometer squared

    The SHS observations also allowed the measurement of Langmuir adsorption isotherms of MG cations on the outer surfaces of the two bacteria were strikingly different.  The S-layer of Gram + has a small charge density compared to Gram negative:   ~1.0 ± 0.2 nm-2 vs    ~6.6 ± 1.3 nm-2  .    Mathematical analysis on a biophysical level indicate that charge-charge interaction based on charge density is the driving force for binding.

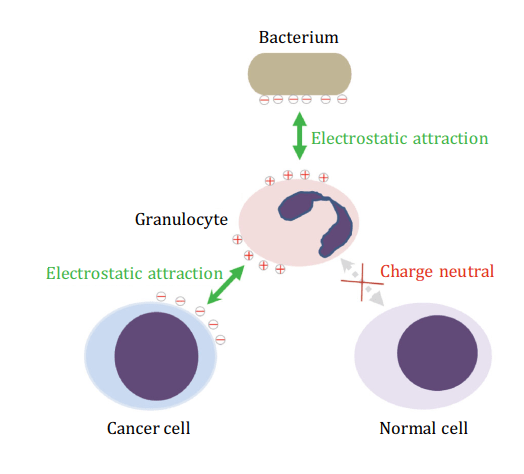
    The inspired hypothesis

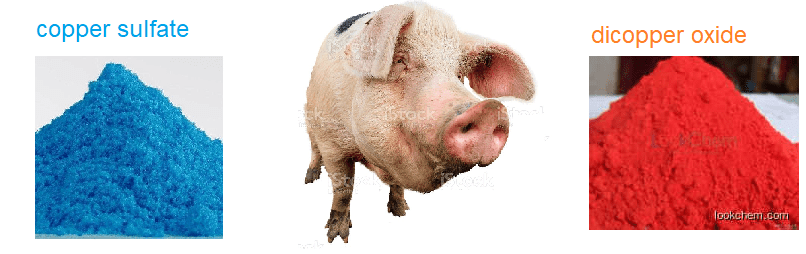
    The makers of CopperOne claim that in spite of having only one +1 charge, Cu+ is more bactericidal than Cu2+.  The former is predicted to have a smaller radius of hydration and perhaps more able to navigate the water channels of the cell surface and into the cell membrane where damage may be the most severe.  Can SHS detect changes in the geometry of Gram Pos and Gram Neg bacteria cell walls upon binding to Cu+ and Cu2+?

  • Conidia charge and basal lamina binding

    Wasylnka JA, Moore MM. Adhesion of Aspergillus species to extracellular matrix proteins: evidence for involvement of negatively charged carbohydrates on the conidial surface. Infect Immun. 2000 Jun;68(6):3377-84. PMC free article

    This study came out of Simon Fraser University in Burnaby, BC, Canada. 

    Those of us in the desert southwestern U.S. are very familiar with fungal lung infections.  Wasylnka and Moore mention in their introduction that cytotoxic chemotherapy patients and those with AIDS are immunocompromised and more susceptible to fungal infections.  Here in the United States where advertising drugs on prime time t.v. is legal, immunosuppressive therapies for autoimmune diseases are advised not to be taken by patients who visit areas where “certain fungal infections are prevalent.”  Indeed, most countries require testing for Aspergillis species on marijuana used for both medical and recreational purposes.  Wasylnka and Moore followed the literature suggesting that conidia of Aspergillis species may adhere to components of the extracellular matrix of our airways.  They tested the hypothesis that the conidia adhere to our airways via electrostatic interactions of negatively charged glycosaminoglycans to positively charged regions of these matrix proteins

    Panels A and B came from the CDC. Panel C is from an extensive blog on medical mycology and shows conidia of A fumagatis.

    MATERIALS AND METHODS

    Aspergillus strains and growth conditions.

    The Aspergillus strains were purchased from the American Type Culture Collection, ATTC, or isolated from patients in B.C.  The fungi were grown on a standard fungal agar until the spores/conidia were ready to harvest and enumerate.  

    Preparation of basal lamina from cultured lung cells.

    The type II pneumocyte cell line A549 was also obtained from ATCC.  These cells were gown in culture dishes in a  a standard medium.  The cells were removed with 0.1 M NH4OH (ammonium hydroxide) and then rinsed.  The protein remaining consisted of what is called the basal lamina. 

    Peroxidase labeling of A. fumigatus conidia

    Biotin is a small molecule that can be attached to large molecules like proteins while still exposing the Vidin site.  Avidin can be attached to other molecules like peroxidases that make the whole assemble easy to detect.  Peroxidase labeling of conidia was determined by previous work to not interfere with adhesion of the conidia to fibronectin, laminin, or type IV collagen….proteins of the basal lamina.

    Adherence assays on glass slides.

    Non specific sites on the fibronectin or authentic cell culture basal lamina were blocked with albumin, a major blood protein which was subsequently rinsed off.  Conidia were allowed to adhere to the protein in PBS, phosphate buffered saline, a solution that buffers the mix to the same pH as blood using the same major buffering salts.  After giving the conidia a time to bind, the slides were rinsed with a mild detergent to remove nonspecific, weakly bound conidia.

    The strategy in images

    The basic experimental strategy. A. Domains of a fibronectin dimer. Image can be found at this link to a slideshare presentation of the extracellular matrix..

    Summary of results

    The bar graphs of Figures 1-4 illustrate These findings also available PMC free article in full form.

    • This site has discussed the D614G mutation in the Covid spike protein giving it the ability to bind to integrins on the surface of many cells, that recognize the RGD peptide sequence.  A slightly longer version of this sequence, GRGDS, failed to result in statistically significant less binding of the conidia to fibronectin compared to a sequence SGGDR.    In simple lay terms, the conidia are not pretending to be endothelial cells binding to RGD motifs on the fibronectin.
    • The ability of three fragments of fibronectin were tested for their ability to bind spores.  Only the glycosamino glycan binding domain was able to bind the spores, albeit at a lower affinity than full length fibonectin.   Neither the 45-kDa gelatin-binding domain nor the 120-kDa cell binding domain were able to  bind conidia.
    •  Removal of glycosylation of fibronectin did not affect conidia binding.  Denaturization (unfolding) of the fibronectin did affect binding.
    • Removal of sialic acid glycosylation had no effect on conidia binding.
    • We must remember that the conidia also have glycosylation.  Three different polysaccharides were used to complete with conidia for sites of fibronectin and the cell culture grown basal lamina:  dextran sulfate, chondroitin sulfate,  keratan sulfate, and dextran.  All four inhibited conidia from binding to  fibronectin and cell culture basal lamina.  High concentrations of NaCl also inhibited binding further implicating ion-ion interactions.

    While electrostatic interactions were claimed to be part of the interaction, charges of strong binders versus weak binders were not measured.

    Discussion highlights

    The Wasylnka and Moore study presents evidence that negatively charged carbohydrates on the surface of A. fumigatus conidia may mediate adherence to fibronectin and intact basal lamina.  These are some highlights of the discussion and some comments on possible copper binding:

    • Alveolar basal lamina is a specialized ECM composed of laminin, type IV and V collagen, entactin, chondroitin sulfate proteoglycan, heparan sulfate proteoglycan, and fibronectin that might originate from the circulation and therefore be absent from the cell culture produced substrate.
    • Extracellular matrix damage is thought to predispose a patient to aspirgilliosis.  CopperOne and lysyl oxidase
    • Diseased lungs were thought to have more fibronectin than healthy lungs.
    • In the damaged lung, inhaled conidia may have increased access to fibronectin and other ECM proteins as a result of detached epithelial cells.
    • The finding that A. fumigatus binds to fibronectin correlates with the observation that  A. fumigatus infections account for over 90% of all cases of invasive aspirgiliosis
  • cancer cell negative charge

    This journey started with a request to look up the charge on different types of cancer cells. This request may have started with a layperson’s understanding of chemistry and charge. Donglu Shi of the University of Cincinnati postulated that the folic acid receptor might be a common tumor cell target whose charge may change when confronted with excess lactic acid [1] from glycolysis not coupled to the TCA cycle and electron transport chain, aka the Warburg Effect. We will conclude that micro domains of the folic acid receptor is where CopperOne might work its therapeutic effects.

    The idea is for the supramaramagnetic nanoparticles with the positive surface chare to capture cancer cells for both diagnostic and therapeutic purposes. 

    The strategy is to separate tumor cells from normal cells that have less of a negative charge, perhaps because of the lactate production, from sialic acid, or from a combination of the two.  These are HeLa cells.  Breast cancer cells may be in the range 20–30 m, while the typical dimension of the nanoprobe is on the order of 200–300 nm.

    Douglas Shi and his laboratory at the University of Cincinnati have designed magnetic nanoparticles that bind to charged surfaces on cells.  Dr Shi reminds us that one of the hallmarks of cancer cells is their over reliance on glycolysis and the overproduction of lactic acid/lactate.  Numerous sources tell us that the tumor micro environment is acidic due to lactic acid.  How can this be so?  If we have lactic acid, the tendency would be to donate some of its protons to negatively charged amino acid side chains like glutamate and aspartate.  The export system for cancer cells is mono carboxylate transporter 4, or MCT4, or MOT4.  This transporter not only removes lactate in the “conjugate base” form from the cell but also releases H+.  Lactate is then left to “steal” H+ from uncharged glutamic acid and aspartic acid side chains leaving them with negative charges of their conjugate bases glutamate and aspartate.

    The strategy is to separate tumor cells from normal cells that have less of a negative charge, perhaps because of the lactate production, from sialic acid, or from a combination of the two.  Breast cancer cells may be in the range 20–30 m, while the typical dimension of the nanoprobe is on the order of 200–300 nm.

    Close to 100% of some cancer cell lines are isolated on these magnetic beads with positively charged groups.   (PMC) We can hypothesize that cells that are close to 100% captured like HepG2 cells (liver cancer) have a greater negative surface charge than say LM-3 cells with less than 50% captured.   The other intriguing twist is that the normal cells, turquoise lettering, are not captured by nanoparticles with positive surface charges.  Normal liver cells are weakly captured by negatively charged nanoparticles.  Most interestingly to CopperOne is the evidence for large positive charge on peripheral mononuclear cells (PMN).  Granulocytes are part of the PMC family of white blood cells.  When granulocytes encounter bacteria that secrete positively charged peptides called defensins.The following image is from the second Shi Laboratory review [2]

    Another research group used a slightly different technique to measure surface charge on just one particularly aggressive cancer cell type.

    Zeta Potential and cell surface charge

    Perhaps another review on zeta potential is in order. The Wikipedia authors have compiled an excellent review that is probably beyond most lay readers. Suffice it to say, the Stern double layer is the layer of counter ion charges associated with a charged surface.

    A illustration of zeta potential and the electrophoresis technique used to measurement. Note: Surface charge on any cell will not be uniform as illustrated for this sphere with a uniform negative charge with a collection of positive counter ions.

    The slipping plane is the place where charged solutes associated surface start to resemble the bulk solution. This is the zeta potential. For particles with charged surfaces, such as cancer cells, the potential is measured by electrophoresis, that is movement through a solution in an electric field between two electrodes.

    A Slovakian and Polish group used this approach to measure the surface charge of a glioblasoma multiforme cell line LN-229.  GBM is a particularly hard cancer to teat because of its heterogeneity and inaccessibility.  Naturally occurring plant phenolics cinnamic acid and ferulic acid were explored as treatments.  Electrophoretic mobility was used to measure the surface charge density of LN-229 cells.  Treatment of both phenolics caused a decrease in negative charges at high pH and a decrease in positive charges at low pH.  PubChem lists two very similar values for the pKa of ferulic acid: 4.42 and   4.58.  The pKa is the pH of which half of the groups with an exchangeable H+ are in the protonated form. Pubchem lists two experimental values for the pKa of lactic acid: 3.79 and 3.82.

    Based on electrophoretic mobility values, the surface charge density δ was determined according
    to the above equations in which: η—the viscosity of the solution, u—the electrophoretic mobility, d—the diffuse layer thickness.  The diffuse layer thickness was determined using the formula in which R is the gas constant, T is the temperature, F is the Faraday constant, I is the ionic strength of 0.9% NaCl, and ε and ε 0 refer to the permeability of the electric medium.     The pH in these experiments was adjusted with NaOH and HCl.  It wasn’t clear if the cells were rinsed after being treated with the ferulic acid or if the indicated concentration of ferulic acid was added to the electrophoresis medium in which it becomes the main buffering agent.  Lines have been drawn from the approximate pKa of ferulic acid and the corresponding charge density in Coulombs per square meter.   [3]

    In their discussion Naumowicz and coauthors listed factors that may affect zeta potential of the entire cells:  temperature, pH, ionic strength, and solvent viscosity (also very low).  Naumowicz and coauthors listed factors that are different in tumor cells that might affect surface charge:  increased sialic acid, free fatty acids/phospholipids,  alterations in acidic/basic functional groups, and a decrease in integral membrane protein levels.  Some aspects of charge/charge neutralization were discussed.  This would occur above the pKa of ferulic acid.  This is in fact what they observed. 

    • Starting with the negatively charged bacterium or cancer cell
    • Ionic strength was high enough to keep the cells from lysing.  Physiological solutions also contain divalent cations. Would these form a counter ion cloud to shield the bacterium from the immune cell?
    • Would viscosity inducing small and large molecules keep the bacterium or cancer cell from electrostatically interacting with the immune cell?
    • Electrical permeability. Many biological molecules have dipole moments such they line up between the bacterium/cancer cell and the immune cell.

    Many scientists are convinced that charge is important. Looking at the literature, it is complicated on the level of a whole cancer cell or even a much smaller whole bacterium. Let’s go back to the mention of the folic acid receptor by Dr Shi. [1]. If Cu+ can make it’s way to the active site of this transporter, surely this is where charge is important on cancer cells.

    Folic acid receptor aside

    Indeed, the human folic acid receptor alpha, FRα, is expressed in a wide variety of tumor cells that need more folic acid for the synthesis of nucleotide involved in rapid cell division. [4] The group that solved this crystal structure stated that The folate pteroate moiety is buried inside the receptor, whereas its glutamate moiety is solvent-exposed and sticks out of the pocket entrance, allowing it to be conjugated to drugs without adversely affecting FRα binding. [4] This might be where the Shi laboratory was coming from when they stated that tumor cells develop a negative charge because they have increased ability to bind their cancer targeting positively charged group conjugted Fe3O4@Cu2-xS nano particles. [1]

    Image of the FRα color coded by charge. Red is negative; blue is positive. These charges electrostatically attract the charged groups on the D-folic acid molecule. [3]

    This post may leave the reader “head scratching” as to the importance of overall surface charge on cancer cells. The Shi [1,2] and Kotynsa [3] laboratories used isolated cells. Real cancer cells, as both groups admitted, live in crowded, acidic tumors. The Shi Lab was also concentrating their efforts on isolating these cancer cells that had escaped the tumors.

    References

    1. Deng Z, Lin J, Bud’ko SL, Webster B, Kalin TV, Kalinichenko VV, Shi D. Dual Targeting with Cell Surface Electrical Charge and Folic Acid via Superparamagnetic Fe3O4@Cu2-xS for Photothermal Cancer Cell Killing. Cancers (Basel). 2021 Oct 21;13(21):5275. PMC free article
    2. Shi D. (2017) Cancer cell surface negative charges: A bio-physical manifestation of the warburg effect. Nano LIFE. 2017;7:1771001.
    3. Naumowicz M, Kusaczuk M, Zając M, Gál M, Kotyńska J. Monitoring of the Surface Charge Density Changes of Human Glioblastoma Cell Membranes upon Cinnamic and Ferulic Acids Treatment. Int J Mol Sci. 2020 Sep 22;21(18):6972. PMC free article
    4. Chen C, Ke J, Zhou XE, Yi W, Brunzelle JS, Li J, Yong EL, Xu HE, Melcher K. Structural basis for molecular recognition of folic acid by folate receptors. Nature. 2013 Aug 22;500(7463):486-9. PMC free article
  • Essential Metals

    Essential Metals

    What are the essential metals for human health? Are these metals also found in plants we eat? How are they transported from the gut, or soil, into our blood, or plant? Let’s start with a review by Maria Antonietta Zoroddu and her fellow scientists from Italy and Norway. These scientists identified nine. Selenium is not technically a metal, but we’ll add it to their list. A column has been added to the table if it is in this Centrum multivitamin.

    MetalCentrumChargecurcumintannic
    acid
    quercetin
    family
    p-coumaric acide- transfer
    Na, +1  +1no
     K 2%+1  +1no
    Mg 24%+2 +2 +2 +2no
    Ca 16%+2 +2  +2no
    Fe 33%+2, +3 +2, +3 +2, +3 +2, +3yes [2]
     Mn 100%+2, +4, +7 +2 +2 +2yes [2]
     Co +2, +3 +2 +2 +2+2yes [2]
     Cu 100%+1, +2 +2 +2 +2+2yes [2]
    Zn 100%+2 +2 +2 +2no
     Mo 111%+4, +6  +2 +6yes [2]
     Se 182%-2, +4  yes [3]
    This table combines essential metals for human health [1], comments on thier ability to transfer electrons [2,3], and four exemplary plant polypenols that chelate these metals from ref [4]

    A review by Fedenko and coauthors provides an excellent analysis of plant polyphenolics that can bind metals and metalloids. [4] This table provides some of the phenolics that readers might be familiar and the oxidation state of the metal, metalloid bound.

    These are some screen shots from the Fedenko 2022 review [4] Figure 1. The reader of this post is invited to consult this public access review to toxic metal binding properties of plant polyphenols. The Fedenko review contains a massive amount of peer reviewed data. It is interesting to note that no review mentioned Cu(I) binding. It is not know if this is because Cu(I) was not tested or if it was not considered toxic in the first place. Certainly Fe(II) and Fe(III) was tested in many of the polyphenols referenced by Fedenko and coauthors. [4]

    These are some structures of polyphenols from PubChem mentioned in this post. Oxygens are red and carry a partial, if not an outright, negative charge for binding cations. Judging from table 1 of the Fedenko review, the tendency is to bind di- and tri- valent cations.

    The philosophical twist

    Metal ions may perform structural as well as catalytic roles in proteins of our bodies. [3] Often the catalytic roles involve the well coordinated transfer of electrons from one place to another. Metals may become toxic if they transfer that electron to O2 to form reactive oxygen species. Plant polyphenols have a way of binding metals that are used for legitimate purposes in enzymes as well as environmental contaminates such as cadmium Cd(II) and lead Pb(II). Plants are being considered agents of bioremediation to clean up environmental contaminates.

    Perhaps the original goal of this post was to claim that plants contain only Cu(I). This claim could not be made with a quick review of the literature. We can conclude that plants “consider” di and trivalent cations worthy of chelation by small molecules. Do plants consider excess multivalent cations toxic? Since our bodies are not packed with polyphenols, Cu(I) versus Cu(II) is a consideration.

    References

    1. Zoroddu MA, Aaseth J, Crisponi G, Medici S, Peana M, Nurchi VM. The essential metals for humans: a brief overview. J Inorg Biochem. 2019 Jun;195:120-129.
    2. Jomova K, Makova M, Alomar SY, Alwasel SH, Nepovimova E, Kuca K, Rhodes CJ, Valko M. Essential metals in health and disease. Chem Biol Interact. 2022 Nov 1;367:110173. PMC free article
    3. Lothrop AP, Snider GW, Ruggles EL, Patel AS, Lees WJ, Hondal RJ. Selenium as an electron acceptor during the catalytic mechanism of thioredoxin reductase. Biochemistry. 2014 Feb 4;53(4):654-63.
    4. Fedenko VS, Landi M, Shemet SA. Metallophenolomics: A Novel Integrated Approach to Study Complexation of Plant Phenolics with Metal/Metalloid Ions. Int J Mol Sci. 2022 Sep 26;23(19):11370. PMC free article
  • Copper and rat skin

    This post examines the rat experiments in this paper that seems to have made a CopperTwo version of CopperOne and is claiming that CopperTwo has skin healing properties. The first two posts in this series summarizes the production protocol and chemical characterization followed by some fibroblast and endothelial cell culture studies. The rat studies might have been meant to “bring home the gold.” Sadly, much of the histology has not been quantitated. The readers are left to decide for themselves if the changes are meaningful. The purpose of this post is to allow those with financial interest in CopperOne for wound treatment if these CopperTwo results are enough to warrant further pursuit.

    Wang TL, Zhou ZF, Liu JF, Hou XD, Zhou Z, Dai YL, Hou ZY, Chen F, Zheng LP. Donut-like MOFs of copper/nicotinic acid and composite hydrogels with superior bioactivity for rh-bFGF delivering and skin wound healing. J Nanobiotechnology. 2021 Sep 9;19(1):275. PMC free article

    Full‑thickness skin defect model and treatment


    Female Sprague-Dawley  rats were subjected to surgical incision after shaving hind skin of fur and other measured to minimize pain and infection.  Two full thickness incision wounds (10 mm × 10 mm) were made on both sides of each rat. The defects were covered with GelMA 5% CuNA@GelMA and 5% CuNA-bFGF@GelMA  and fixed with 2M medical tape.  Wounds treated with only medical tape served as the negative control.  Rats were euthanized on days 3, 7 and 14.  The wound and normal
    adjacent skin were excised and then fixed in 4% paraformaldehyde.
    Wound closure measurement

    The wounds were photographed with a digital camera after 3, 5, 7, 11 and 14 days and the wound area was measured by ImageJ software. The percentage of wound closure was defined as:
    Wound closure(%) = (1 − P/I) × 100,

    where I is the initial wound area and P is the wound area at a given time point.  Each treatment group had three samples.  


    7.  Histological evaluation

    Most evaluations were performed using commercial kits and self-explanatory antibodies.  . To identify elastic fibers, Weigert’s elastic staining was used to stain the sections. Histological analysis of wounds was performed on day 3, 7, and 14 to evaluate the impact of CuNA-bFGF@GelMA on wound healing. H&E and Masson’s trichrome staining was conducted after 3, 7 and 14 days after treatment. H&E stains nuclei purple, collagen shades of pink, and other cellular materials shades in between.

    Fig. 7 Wound closure and H&E staining (a) Digital images of full‑thickness skin defects of SD rats treated with the GelMA, CuNA@GelMA and
    CuNA‑bFGF@GelMA on day 0, 3, 5, 7, 11 and 14.
    • 7a All wounds shrank during each time period; however, the wounds treated with CuNA@GelMA and CuNA-bFGF@ GelMA shrank more.  CuNA-bFGF proved to be particularly effective in promoting wound closure.  The authors claimed  a synergistic effect of copper and bFGF.
    • 7b  Data are expressed as mean±SD (n=3). (*p < 0.05, **<0.01, **<0.001 compared to the blank) The biggest improvement appears to be in the first three days.
    • 7c  Normal tissue stained with H&E.  Note the blood vessels and regular epithelium.

    7d, H&E staining reveals that CuNAbFGF@GelMA treatment results in skin closest to normal skin. The control and GelMA skin samples show basic epithelium and groups form the basic structure of epithelium and dermis but lack hair follicles, regular epithelium, new blood vessels, and the milder inflammation found in the CuNA and CuNAbFGF@GelMA treated skin responses. Especially the H&E staining of the group is closer to the normal tissue

    8  Inflammation,epithelia, and blood vessels

    This figure introduces two proteins of interest in wound healing. Interleukin 6, IL-6, is a pro inflammatory cytokine that may be produced by blood vessel smooth muscle cells. Ki-67 is a nuclear protein associated with cell proliferation. CD-31, aka pecam1, is in simple terms a marker of angiogenesis. In their cell culture experiments, these authors examined non muscle actin in endothelial cells and fibroblasts. α- Smooth muscle actin in this case is used as a marker of new blood vessel formation.

    8a  The blank and  @GelMA show more IL-6 than the CuNA and NuNA&bFGF embedded in the @GelMA matrix. On day 3.  In this case the small, brown, blobs seem to be the regions of positive IL-6 staining.

    8b Ki-67 positive nuclei represent the re-epithelial-ization process. Figure 8b shows that a small number of Ki-67. CuNA-bFGF@GelMA group exhibits the highest level among all the groups.

    8c  CD31 (red) and α- smooth muscle actin (green) and nuclei (blue)  While actin is a “house keeping” protein expressed in large amounts of most every tissue, the smooth muscle cells of blood vessels express a different isoform than fibroblasts and endothelial cells.

    Readers are left to decide for themselves as to whether or not the changes in figure 8 are consequential because no numbers are given.

    9.  Collagen deposition

    Fig. 9 Masson’s trichrome staining and Weigert’s elastic staining (a) Masson’s trichrome staining was performed on day 3, 7, and 14.

    9a The authors were interested in a report that collagen formation is due to the massive proliferation of fibroblasts. Collagen deposition was examined in the wound regions using Masson’s trichrome staining which demonstrated  much more collagen deposition in the CuNA-bFGF@GelMA treated skin. Masson’s trichrome stains as follows: red keratin and muscle fibers, blue or green collagen and bone, light red or pink cytoplasm, and dark brown to black cell nuclei.

    Fig. 9b Weigert’selastic staining on day 7 and 14. (elastic fibers, black arrow)

    9b  Weigert’s elastic staining was performed on day 7 and 14.  The CuNA-bFGF@GelMA treatments

  • Anti-bacterial skin cream

    This post is a continuation of a previous post documenting the production of an oxidized form of Cu(I)NA2. The results show promise that Cu + nicotinic acid can promote angiogenesis in a cell culture model, especially if basic fibroblast growth factor (bFGF) is added. We think Cu(I)NA2 will work even better than Cu(II)NA.

    One of our associates Jefro’s Botanicals, sells skin healing creams that seem to have anti-bacterial properties. This post goes through some of the tests that Wang and co-workers performed showing fibroblast sparing and anti-bacterial properties of cupric nicotinic acid hydrogels.

    Wang TL, Zhou ZF, Liu JF, Hou XD, Zhou Z, Dai YL, Hou ZY, Chen F, Zheng LP. Donut-like MOFs of copper/nicotinic acid and composite hydrogels with superior bioactivity for rh-bFGF delivering and skin wound healing. J Nanobiotechnology. 2021 Sep 9;19(1):275. PMC free article

    Wang 2021 are claiming that their oxidized version of Cu(I)NA2 is the goto treatment for wounds. In figures 4 and 5 they claim that it kills two species of bacteria but not a very common fibroblast cell line, NIH 3T3. In Figure 6 that demonstrate promise of angiogenesis to aid in wound healing. This post looks at the methods and the results in hopes that separating these data from the rest of the 21 page publication makes it easier for lay readers to understand.

    Killing Bacteria

    Wang and coauthors used a representative Gram-negative bacteria, Escherichia coli (E. coli, ATCC8739), and a representative Gram-positive bacteria, Staphylococcus aureus (S. aureus, ATCC 6538). They used an agar diffusion disk and MTT methods.

    The MTT assay

    measures NAD(P)H reducing equivalents using a compound that changes color when reduced by NADH. CuNA powder was diluted with a common growth medium, LB, into different concentrations. A 1.0×10⁶ colony forming units CFU/mL suspension was obtained after mixing with the bacterial suspension. This concentration of bacteria makes for a very clear solution. After 16 h of incubation at 37 °C, MTT stock solution was added to LB mediums mentioned above, and the mixtures were incubated at 37 °C for 4 h. Then the formazan crystals were dissolved with DMSO at room temperature, and the OD (optical density) was measured at 570 nm using a spectrophotometer (Evolution UV201, Thermo Fisher Scientific, USA). Sometimes the OD at 600 nm is used to measure light scattering by bacteria and they grow and make the medium cloudy. In this sense, the Wang paper might contain a typo that the reviewers missed.

    Even after 48 hours, the 400-1000 μg/ml keeps down 90% of the bacterial growth of both representative species. Staph aureus seems pretty resistant to lower concentrations.

    In agar disc-diffusion method,

    GelMA composites (10 mm in diameter and 2 mm in height) were prepared and
    UV-sterilized as described above. Pure GelMA was used as the positive control. The suspension of E. coli and S. aureus were inoculated with sterile pipette tips on LB
    agar plates respectively and incubated at 37 °C for 24 h. The inhibition zones of all samples were measured and results were photographed and measured.

    The white circles were drawn around the clear zone of bacteria killing. The red, dashed lines are drawn at the edges of the paper disks soaked in compound and the clear zones.

    Panels 4d-e put numbers to the representative images shown in Panel 4c.

    Data are expressed as mean±SD (n=3). (*p < 0.05, **<0.01, **<0.001 compared to the 3% CuNA@GelMA)

    There is a more pronounced dose/response effect with E coli. One the other hand, 3% CuNA@GelMA results in more S aureus killing.


    5. Not killing fibroblasts & endothelio cells


    Healing wounds involves healing skin cells (fibroblasts) and blood vessel (endothelial) cells. The fibroblast NIH 3T3 and endothelial HUVEC cell lines were obtained from a Chinese cell culture bank. The cells were cultured in a standard medium, DMEM medium, that contains salts, buffering agents, and basic vitamins and so on. Growth factors were supplied by adding 10% fetal bovine serum. Bacteria growth was controlled with 1% penicillin-streptomycin. Cells were grown in a CO2 incubator with 5% level at 37 °C. Like our blood, the pH is buffered to pH 7.4 ish by the CO2/bicarbonate equilibrium. Samples including GelMA, CuNA@GelMA, and CuNA-bFGF@GelMA were “sterilized” for two hours in 75% ethanol and then rinsed three times in sterile posphate buffered saline.

    Cell toxicity and growth


    Two types of cells were seeded in 12-well plates with a density of 1×10⁴/well and cultured in the complete medium with different @GelMA formulations. It is assumed that all of the @GelNA compounds are added at 5% weight % to mimic a cream. Cell toxicity was determined using a commercial “Live/dead kit”

    Fig. 5 Biocompatibility evaluation of HUVEC and NIH/3T3 cells cultured in ionic extraction from 5% wt GelMA composite hydrogels (a, b) Live/
    dead staining of HUVEC and NIH/3T3 cells cultured in the complete medium with different ionic extraction for 24 h. In the live/dead assay live cells are stained green and dead cells red. Arrows pointing to the dead cells have been added.


    Cell viability was further assessed by a CCK-8 method, which is rlated to the MTT assay for viability in that it measures the level of NAD(P)H. For the proliferation test, the two types of cells were seeded at an initial density of 5×10³ cells/well in 96-well plates with ionic extraction at 37 °C in a CO2 incubator with 5% level. On day 1, 3, 5 and 7, the CCK-8 method was performed to assess the cell viability. The cell viability was determined according to the equation:

    Cell viability(%) = (ODs/ODc) × 100

    where ODs, ODc indicate the absorbance of samplesand control group respectively.

    Fig. 5 Biocompatibility evaluation of HUVEC and NIH/3T3 cells cultured in ionic extraction from 5% wt GelMA composite hydrogels HUMEC and (c) NIH3T3 andNIH/3T3 cells (d) was determined by CCK‑8 method after cultured with different ionic extraction for 24 and 48 h. Cell proliferation assay for HUVECe) and NIH/3T3 cells (f) after cultured with different ionic extraction for 1, 3, 5, 7 days. Scale bar is 200 μm. Data are expressed as mean±SD (n=3).(*p < 0.05, **<0.01, **<0.001 compared to the blank)

    Cell migration into clear zones is a key aspect of wound healing. The interested read may learn more about it in an online article of the forces behind cell migration.

    6. Migration and tubule formation

    Before going on to animal skin injury studies the authors wanted to demonstrate that their compound, that closely resembles our compound, can promote a cell culture version of angiogenesis. Images have been added to the figures to make them easier to understand.

    ig. 6 Cell attachment and spreading behavior, migration and tubule formation activities Cellular merged fluorescent images of HUVEC (a) and
    NIH/3T3 cells (b) on GelMA, CuNA@GelMA and CuNA‑bFGF@GelMA hydrogels after 2 days post‑seeding. F‑actin (red), vinculin (green), nuclei (blue).

    A transwell assay was performed to evaluate the migration ability of HUVEC and NIH/3T3 in the @GelMA formulations. The fibrolasts (skin) and endothelial (blood vessel) cells were diluted with serum-free medium to 1.0×10⁵ cells/mL, then added in the upper chamber of a 24-well transwell plate and @GelMA formulations to the lower chamber. As a control, complete medium was added to the lower chamber. After incubation at 37 °C for 24 h, cells on the upper chamber were scraped off using a dry cotton swab. Cells migrated to the lower surface were washed with PBS, fixed, and stained with crystal violet. The migrated cells were imaged with a microscope.

    Fig. 6 Cell attachment and spreading behavior, migration and tubule formation activities c The migration evaluation of different ionic extraction on HUVEC and NIH/3T3 cells after incubation for 24 h by the transwell method. d The tube formation of HUVEC on matrigel after incubation with ionic extraction for 4 h. The migration number of HUVEC. Images below the lettered panels were added to make the published data easier to understand.

    HUVEC endothelial cells were plated on Matrigel, a collagen rich basement membrane substance. Different @GelMA formulations were evaluated by seeding cells on the Matrigel matrix. Briefly, the matrix was added to 96-well plate wells and solidified before adding the HUVEC endothelial cells and incubated for just 4 hours. The total segment length was measured by ImageJ with the Angiogenesis Analyzer plugin to assess the tubule formation ability.

    Tubules are considered a precursor of angiogenesis, new blood vessel formation. The lay reader may access the source of the image to go with Panel 6d at Slide Share, slide 15 of 23.

    Attaching numbers to exciting images

    So far we’ve seen some convincing cell culture images that oxidized Cu(II)NA can promote fibroblast and endothelial cell migration as well as this pre angiogenesis tubule formation. Let’s see some graphs of numbers.

    Fig. 6 Cell attachment and spreading behavior, migration and tubule formation activities Cellular merged fluorescent images of HUVEC (The migration number of HUVEC (e) and NIH/3T3 cells (f) compared to the control group. g The relative tube formation of HUVEC cultured in different ionic extraction. Data are expressed as mean±SD (n=3). (*p < 0.05, **<0.01, **<0.001 compared to the control)

    If Cu(II)NA promotes angiogenesis and wound healing in a cell culture model by itself and even better in combination with basic fibroblast growth factor… then Cu(I)NA2 will too! The next post will examine animal studies.

  • copper based wound healing

    curpous nicotinic acid and vegetable oils

    One of our affiliates, Jefro’s Botanicals, sells cuprous nicotinic acid based creams in vegetable oils. Many of these formulations contain cocoabutter and blackseed oil. Some of these oils have been covered in a review in peer reviewed literature. An advantage of oils is that they exclude oxygen and keep the copper in the +1 cuprous oxidation state. Cupric copper is in the +2 oxidation state.

    Ben Salah G, Jebahi S, Bessaleh S, Ahmad MA, Khireddine H, Abdulghani M, Mejri N. Skin healing effects of an innovative polymer-based oil Nigella sativa: a rabbit model experimental study. Eur Rev Med Pharmacol Sci. 2023 May;27(9):4202-4210. free article

    This Saudi Arabian study used chitosan gels containing black seed oil, a traditional remedy. Wounds were applied to shaved rabbit skin. Dissecting scissors and
    forceps were used to remove the outer panniculus carnosus layer of skin. All the rabbits were killed at 7 and 14 days and the regenerated cutaneous tissue was recovered and analyzed for indicators of inflammation and healing. Black seed oil, Nigella sativa, improved superoxide dismutase, catalase, and glutathione peroxidase activities. We think Jefro’s Botanicals formulations with cuprous nicotinic acid and black seeed oil have much promise.

    cupric nicotinic acid and fibroblast growth factor

    This website has received considerable visits from the People’s Republic of China. We sort of suspected something was up. This publication does cause us to question whether the realy special thing is copper in complex with niacin rather than just copper in the +1 oxidation state. We will always that the +1 oxidation state is important…

    Wang TL, Zhou ZF, Liu JF, Hou XD, Zhou Z, Dai YL, Hou ZY, Chen F, Zheng LP. Donut-like MOFs of copper/nicotinic acid and composite hydrogels with superior bioactivity for rh-bFGF delivering and skin wound healing. J Nanobiotechnology. 2021 Sep 9;19(1):275. PMC free article

    The production scheme of nicotinic acid, Cu(II) crystals loaded with recombinant human basic fibroblast growth factor

    Many of the authors of this paper came from the Department of Orthopedics, Shanghai Tenth People’s Hospital, School of Medicine, Tongji University and the Shanghai Trauma Emergency Center, both in Shanghai,China. These authors make it clear that they are making a Cu(II)NA (blue) chelate rather than a Cu(I)NA2 (orange/red) chelate. Their protocol is remarkably similar to two US patented protocols for making CopperOne. The authors used their “metal organic framework” MOF structures to attach recombinant human basic fibroblast growth factor for the purpose of skin healing.

    Shanghai Tenth People’s HospitalMitosynergy #1, ConventionalMitoaynergy #2, Pure Chelation
    Dissolve Cu(II)acetate in H2O and ethylene glycol (Antifreeze),Cu(I) Cl in H2ODissolve metal salt sol in H2O
    Dissolve NA in H2O and ethylene glycolNA in 90% EtOH, heatDissolve chelator salt in H2O,
    Mix with fast stirringAdd together, stir, coolmix
    Precip by centrifuge at 7000 rpmFilter crystalsPrecip at pH 3-4, cool, filter
    Rinse crystals 3x in dH20.Wash in 90% EtOH, acetoneRinse crystals with ascorbic acid sol
    Rinse 3x 100% EtOH, freeze dry at 4oCdryRinse crystals with 100% EtOH, dry
    A table comparing two different methods of making Cu(II)NA and Cu(I)NA2 NA, nicotinic acid; EtOH, ethanol;

    Why ethylene glycol/antifreeze?

    On some levels the use of ethylene glycol seems to be a substitute for ethanol as per the first Mitosynergy patent. Part of the discussion suggested that larger crystals might have more area to bind the bFGF Supplemental figure 1 explored different ratios of water to ethylene glycol. The larger amount of ethylene glycol yielded a donut shaped structure.

    Supplemental Figure 1 ratios of water to ethylene glycol are in cyan text. Note that more ehtylene glycol than water yielded a donut like structure. The scale bars appear to be 500 nm.

    1. What are these nanoparticles made of?

    • 1b (not supplemental, from the main text) The structure details and elemental mapping of GelMA and CuNA-bFGF crystals were imaged by SEM. The surface chemistry of a crystal was analyzed via XPS (Thermo Scientific, USA)
    Fig. 1 Characterization of CuNA prepared in ethylene glycol. (a) Schematic diagram of the self‑assembly of CuNA and loading of bFGF. b SEM and
    elemental mapping images of CuNA. c, d TEM and EDS of CuNA

    These bullet points refer to the above images of Figure 1c-d.

    • 1c, This is the black letter C, not carbon (small c, red structure) showing electron diffraction that the authors claim represent a crystal phase. (Fig. 1c).
    • 1d Powder X-ray diffraction spectra (XRD) showed that the CuNA peaks at 12.7, 15.28, 16.7, 20.02, 24.52, 25.88, 29.16 and 37.44° with little deviations, which are claimed to be assigned to a standard in 1e that we ill need to assume is PDF 21-1601.

    Moving on to more physical characterizations:

    Fig. 1 Characterization of CuNA prepared in ethylene glycol. (. e The X‑ray diffraction (XRD) patterns of CuNA. f FTIR of nicotinic acid and CuNA. g
    The size distribution of CuNA in distilled water. h Zeta potential of bFGF, CuNA and CuNA‑bFGF. i UV–Vis of bFGF, CuNA and CuNA‑bFGF
    • 1e a standard…which can be assigned to the standards (JCPDS card no.
    • 1f Peaks were assigned to C–O (COO–) stretching that suggests “strongly” that Cu is interacting with NA. More peaks were assigned to Cu interacting with the carboxyl group of NA rather than the nitrogen.
    • 1g The dynamic light scattering gave an estimate of the particle size with an average diameter of ~ 980.8 nm,
    • 1h Zeta-potential of CuNA is approximately +9.37 mV. Then, the Zeta-potential value of CuNA increases to −0.39 mV after loading with bFGF. Not shown on this post are zeta potential data showing that the addition of bFGF causes the particles to go from a negative to positive charge indicating that the bFGF had been loaded onto CuNA by a facile electrostatic adsorption.
    • 1i In the spectrum of bFGF, the only absorption peak at ~ 202 nm is observed, which is all a little strange. Aromatic residues tend to absorb at 280nm. They were not looking at parts of teh visible spectrum at which Cu(II) and Cu(I) absorb.

    Gelatin methacrylate hydrogels

    Wet GelMA and CuNA-bFGF@GelMA samples were frozen at - 80 °C and then lyophilized. The structure details and elemental mapping of GelMA and CuNA-bFGF@GelMA hydrogels were imaged by SEM. The surface chemistry of composite hydrogel was analyzed via XPS (Thermo Scientific, USA)

    Figure S3 SEM and elemental mapping images of CuNA-bFGF@GelMA. Scar bar is 200 μm.

    Not shown are supplemental Figure 3 X-ray photoelectron spectroscopy XPS results showing two populations of Cu: ~952 and ~932 eV. What these two populations represent was not discussed.

    2. Loading gels and release of contents

    Figure 2 describes release of contents in hydrogels. What is perplexing is how these things were made. The gelatin methyl acrylate material was dissolved in PBS and heated to 37°C. Then the powders of CuNA or CuNA-bFGF were mixed with the solution at concentration of 0, 3, 5, 10 and 20 wt%. This material was poured into a Teflon mold and exposed to UV light and then stored at 4 °C overnight. We could probably modify this recipe by use of unflavored gelatin. The Cu(I)NA2 could be added as the mixture cools.

    Figure s3 makes a lot more sense knowing what the structure of GelMA structures look like. It is interesting to note that a lot Cu is released from the GelMA structure than with just the bFGF. Even after about three days (70 hours, panel s6a)

    Figure S5 The release profile of copper from CuNA-bFGF and composite hydrogel at first hour.Figure S6 The release profile of NA from CuNA-bFGF and composite hydrogel (a). The release profile of NA of 72 h; (b). The release profile of NA at first hour.
    • 2c The swelling rate is proposed to play an important role in wound healing by absorbing wound exudates.
    • 2d Type II collagenase was used in this study. Degradation of the gel is proposed to increase the rate of release of Cu and bFGF.
    • 2e This figure refers back to adding bFGF to the Cu(II)NA crystals.

    Both Cu(II)NA-bFGF crystals and the gel are slow release

    If we wanted to do something sooner rather than later with Cu(I)NA2 and growth factors, we have reason to thing the release would be over the course of several days.

    • 2f Gelatin-MA slows the release of basic fibroblast growth factor. The inset makes it clear that bFGF is release in an hour.
    • 2g Mitosynergy already sells a Cu(I)NA2 cream. Might release be slower if collagen were added?

    3. Mechanics of GelMA composites

    These are some lay person friendly images, from Figure 3 of the publication, that do not require the understanding of any hard core physics. Note that the CuNA composite is turquoise and clearly in the +2 oxidation state. We could probably make our own composite with gelatin and Cu(I)NA2 for visuals on how to increase the elasticity of one’s skin.

    If 3g the arrow points to a gelatin-methylacrylate gel that cracked under the same stain that had no efect on the gesl with added caper.

    Truly, the only thing in this study for us is the demonstration that what appears to be Cu(II)NA affects the mechanical properties of something that is likely to resemble collagen in our skin. Gelatin is essentially collagen. Figure 3 of the Wang publication is divided up into pieces to make it more comprehensible.

    Figure 3a. Do we really want to invest the sort of resources required to replicate the results with a matrix of our choice and Cu(I)NA2?

    The above device is a universal machine tester (HY-940FS, Shanghai, China). The samples for the compression tests were prepared in 10 mm inner diameter cylinder molds. Compressive tests were conducted at a rate of 5 mm/min to the strain of 90%. Compressive young’s modulus was determined from the slope of the strain-stress curve between 10 and 15% strain. The cyclic compression tests were performed with ten cycles up to 50% strain followed the speed of 5 mm/min to characterize the mechanical properties of GelMA composites. Each sample was tested in quadruplicate. Moving on to panels 3b-f we are forced to consider the definitions of stress and strain. Stress is the force per unit area. Strain is the % change in length in this case. That the authors are measuring cyclical strain is the only way that these graphs can make sense.

    Probably the best way of looking at these graphs is look at the x-axis and find the 80% mark.

    • 3b the gel without added Cu take the less force (80kPa) to deform 80% of 50% deformed than when they at 90% of full length (100 kPa).
    • 3c Adding 5% Cu(I)NA makes the gell easier to deform to 80% of whatever thickness it happens to be. and so on as the concentration of Cu(II)NA is increased.
    • Note that the authors did not look at bFGF.

    The authors interpret all of the data as evidence that Cu(II)NA increases the elasticity of gelatin/ MA gels.

    • 3h An example of the cycles of force applied to the gel. What they did not discuss that the viscous component is in phase with the cyclic force whereas the elactic component causes a resistance to deformation which lags behind the applied force. In other words, the gel bouncing back counters the force to compress again, hence elasticity.
    • 3i Overall, less force (stress) is required to deform a gel 40% in which the copper has been added, even though it bounces back.
    • 3k The compressive moduli calculated from the linear slope of the strain–stress curve shows decreasing values for GelMA, 3%, 5 and 10% CuNA@GelMAs respectively.

    The authors claimed that ionic cross-linking effect between copper ion and GelMA molecule enhances the structure of composite.

  • Copper and Ascorbate

    There are those that tell you that mixing copper sulfate with ascorbate/vitamin C is the same as CopperOne Niacin. They are both a beautiful orange/red color, are they not? The are not the same! They are two perfectly and required nutrients that do not belong together. Just like….

    For an explanation of what happens when you stick a fork into an outlet can be found on youtube.com.

    Mr Fork and Mr Oulet can’t be friends because when you get the two together electrons go where they are not supposed to go. This is the same reason why Mr Copper and Mr Ascorbate cannot be friends. Getting the two together and a source of electrons can result in those electrons going where they shouldn’t.

    A silly animate and dialog associated with some equations explaining why copper and Viatamin C (ascorbate) are pro-oxidants

    These are the sources of the animation

    1. Mastrangelo D, Massai L. Vitamin C against Cancer. , Chapter 4 in VITAMIN C Edited by Amal H. Hamza Published by InTech Janeza Trdine 9, 51000 Rijeka, Croatia This book chapter was used for equations 1-4.
    2. Letelier ME, Sánchez-Jofré S, Peredo-Silva L, Cortés-Troncoso J, Aracena-Parks P. Mechanisms underlying iron and copper ions toxicity in biological systems: Pro-oxidant activity and protein-binding effects. Chem Biol Interact. 2010 Oct 6;188(1):220-7. Free article This article spells out how how ascorbate and Fe3+ or Cu2+ can lead to oxidative stress. Cu2+ appears to be worse than Fe3+ in many ways.
    3. Belmonte M, Elhiti M, Waldner B, Stasolla C. Depletion of cellular brassinolide decreases embryo production and disrupts the architecture of the apical meristems in Brassica napus microspore-derived embryos. J Exp Bot. 2010 Jun;61(10):2779-94. PMC free article This article was used to fine tune the relationship between ascorbate free radicals and the anti-oxidant small molecule glutathione, GSH

    Vitamin C and Fenton reaction [1]

    Note that Cu2+ can be substituted for Fe3+ [2] Radicals, unpaired electrons, in these equation are denoted by superscript”●

    1. Fe3+ + AscH2 → Fe2+ + Asc●- → + 2H+
    2. Fe2+ + O2 → Fe3+ + O2●-
    3. 2O2●- + 2H+→ H2O2 +O2
    4. H2O2 + Fe2+ → Fe3+ + OH + OH●-

    The Letelier study started with the observation that copper ions can irreversibly and non-specifically bind to thiol groups in proteins. They noted that this non-specific binding property was not as fully addressed for iron ions.

    • Cu2+/ascorbate elicited more oxygen consumption than Fe3+/ascorbate under protein free conditions. [2] see equation #2
    • In the presence of cytosolic and microsomal protein, Cu2+/ascorbate increased microsomal lipid peroxidation and decreased cytosolic and microsomal content of thiol groups more efficiently than Fe3+/ascorbate. [2]
    • Finally, Fe3+/ascorbate and Cu2+/ascorbate inhibited in different ways cytosolic and microsomal glutathione S-transferase (GST) activities, which have subtle differences in sensitivity to oxidants.
    • In the absence of ascorbate, only Cu2+ decreased the content of cytosolic and microsomal thiol groups and inhibited cytosolic and microsomal GST activities.

    The reaction

    This reaction was pieced together from references [2] and [3]

    1. Asc●- → dehydro Asc +e
    2. dehydro Asc + 2GSH → Asc + GSSG

    Now that the Ascorbate has been regenerated it is free to start the reactive oxygen species regeneration again with more Cu2+.

    So why can’t Copper and Vitamin C be “friends”?

    Because when the two get together, electrons go where they shouldn’t be.

  • Copper sulfate and Phytase

    Copper sulfate and Phytase

    Blavi L, Solà D, Monteiro A, Pérez JF, Stein HH. Inclusion of dicopper oxide instead of copper sulfate in diets for growing-finishing pigs results in greater final body weight and bone mineralization, but reduced accumulation of copper in the liver. J Anim Sci. 2021 Jun 1;99(6):skab127. PMC free article

    The Blavi 2021 study demonstrated that dicopper oxide is a superior to the common copper sulfate supplement in pigs fed the enzyme phytase to make plant phosphate more bioavailable.

    We at CopperOne would like to say that the leading dietary copper supplement, cupric sulfate (CuSO4), was compared side by side with cuprous nicotinic acid and the latter was found to be superior in a large species that resembles humans. This is dimply not the case. A team from France, Spain, and the United states compared cuprous oxde (C2O) with CuSO4 in the feed of finishing pigs. Our original thought was that these experiments were conducted because the authors considered cuprous copper more bioavailable. The concern was that Cu2+ is an inhibitor of an enzyme called phytase, which which makes phosphate found in the plant compound phytic acid more bio available. The featured image came from Bacillus amyloliquefaciens. Pytase binds Ca2+ as part of the process of removing phosphates from the plant compound phytic acid. Since the enzyme phytase is a widely used feed supplement to increase the bio availability of phosphate of plant feed in farm animals, Blavi and coauthors are proposing that Cu2+ supplements may affect bone mineralization by preventing the absorption of phosphate from phytic acid.. Their concerns were also centered around Cu2+ binding to phytic acid more so than Cu2+ binding to Ca2+ sites on supplemental phytase.

    1. The Diet

    As pigs grow, their nutritional needs change. This study used slightly different feeding schemes for different stages of growth. At the end of each stage, a representative pig of the group was slaughtered and analyzed for bone mineral content and other parameters.

    • Phase 1, days 1 to 26
    • phase 2, days 26 to 61
    • phase 3, days 61 to 96
    • phase 4, days 96 to 116.

    Note that the pigs are already being supplemented with niacin. In an actual farm setting, why not use cuprous nicotinic acid instead of di cuprous oxide?

    2. The diets

    The take home message is that the diets are pretty similar.

    3. Weight gain

    The 250 mg/kg Cu2O supplemented pigs (superscript “a”)gained more weight in all four phases than the controls(superscripts “b” and “c”) . Pigs on the 250 Cu2O gained more weight in phases 3 and 4 than their 250 CuSO4 counter parts.

    Table 2 from Blavi 2021 with a cartoon pig pointing to the significant difference between the control and the equivalent about of copper sulfate in phases 3 and 4.

    Perhaps the other main point of Table 2 is that the pigs on Cu2O were not eating more than the pigs on the CuSO4.

    4. Other meat industry parameters, no difference

    Note that these pigs already had supplemental copper in their diets by way of the mineral/vitamin mix in Table 1. Additional copper made no difference in these parameters.

    5. 250mg/kg Cu is too much?

    This may not have been what the authors were considering at first, but look at the numbers. Going from 125 to 250 mg/kg Cu in the diet increases copper in the liver over 10x in Phase 1. In Phase 4 the increase is not as dramatic. Less copper accumulates in the liver in the 250 Cu2O group. Export in the bile is naturally much greater than in the control group. By Phase 4 more Cu+ was being exported in the bile in the Cu2O group than in the CuSO4 group. Was this because the ATP7B export pump uses Cu+. We can only speculate at this point.Mutations in ATP7B define Wilson’s Disease, which is defined by copper poisoning by failure to export excess in the bile.

    Why the spleen was examined was not entirely clear. The spleen may play a role in the immune system and processing of damaged red blood cells, but its role in copper handling is less clear. Perhaps the spleen was simply in the abdominal cavity neighborhood. At the potentially toxic copper concentration of 250mg/kg, the copper content of the spleen was statistically the same as the control in the 250 Cu2O group but elevated in the CuSO4 group.

    6 Bone mineralization

    Table 6 has been divided into two sections just because there are two points to be made by the information by this table. Recall our first issue with CuSO4 is that it might bind to phytase and decrease the pigs’ ability to make use of phosphate bound to phytic acid in the soy and corn they were consuming. Bone is composed of collagen fibers with hydroxyapatite deposits. Hydroxyapatite is calcium and phosphate. No changes were seen in the percentages of calcium and phosphate in the bone ash. One would expect that burning the bone to ash would remove all traces of collagen.

    Table 6 from Blavi 2021 edited to only show calcium and phosphate data.

    The total amount of noncombustible (ash) in the bone is greatest in the 250 Cu2O treatment. Calcium data is a bit more ambiguous. We can say that 250 Cu2O is better than 250 CuSO4 but we cannot say Cu2O is better than the control diet with no additional copper. The bone phosphate data confirm the investigators’ concern that CuSO4 is inhibiting phytase. 250 Cu2O treated pigs have (statistically) the same phosphate content in their bones as the control group of pigs.

    Moving on to the copper and zinc component of Figure 6 things get more complicated and interesting. It is assumed mg/kg means mg/kg bone ash and that mg/kg means mg/kg non combusted bone.

    Note that both copper compounds decrease the amount of zinc (in bone ash?) in Phase 1 but not Phase 4.

    What did the authors discuss and conclude?

    They mentioned that Cu is absorbed by the intestine in the +1 oxidation state rather than the +2 state. They discussed Cu2O being less water soluble than CuSO4, less likely to dissolve, dissociate into ions, and form complexes with phytic acid. The intestinal pH was also discussed somewhat. The authors also discussed some previous studies that we may look into some more. Their review of the literature led them to conclude that hepatic copper is a good indicator of copper absorbed in farm animals. We at CopperOne would probably be speculating too much if we proposed Cu2+ could get stuck in the liver and never transported out of the liver on ceruloplasmin. Certainly more copper got incorporated into the spleen in CuSO4 fed pigs, see figure 5. This is a very interesting study that has given us a lot to think about.

  • NAFLD and copper deficiency

    For you cooks out there, have you ever been cooking a pot of something and and added a second ingredient to compensate for the first? Soon the second ingredient becomes too much and needs to be dealt with. The Harder 2022 study started with the premise that hepatic copper is regulated by fat accumulation.  It makes sense right? If we actually want to burn fat, we must have copper in the cytochrome C oxidase of our mitochondria. Mitochondria tend to be a source of superoxide. We might want to have some Cu/Zn super oxide dismutase (SOD) in addition to the Mn SOD of the mitochondria. When you add one ingredient to the pot, you have to add another…

    Daniel Harder and others in Marie Heffern’s laboratory at UC Davis addressed this problem in a cell culture model of fatty liver disease. These coauthors observed that copper is sequestered in a manner that mimics copper deficiency when we the added too much fat to the hepatocyte pot.  DepG2, liver hepatocarcinoma cells, were fed palmitic acid, a 16 carbon saturated fatty acid. Palm oil is a good source of this fatty acid.Figure 1  small, significant in copper handling proteins. Human hepatic carcinoma cells, HepG2, were grown in a standard medium with growth factor containing fetal bovine serum and antibiotics to control the growth of microorganisms. 

    HepG2 cells were stimulated with

    • 250 µM palmitic (PA)  
    • 200 µM fatty acid free bovine serum albumin (BSA) control media.

    Ctr1 and intercellular Cu, not measured.

    Harder and coworkers included small molecule transport SLC46A3, but not the Cu+ transporter Ctr1 in their studies. They also did not measure intracellular copper in response to the PA. The Ctr1 gene, SLC31A1. This site has covered the selectivity of Ctr1 but not whether or not energy sources that require copper enzymes increase its expression. As a general note, the Harder study also did not examine Cu binding to the transcription factor Sp1 that turns off the transcription of CTR1/SLC31A1.

    Figure 1D pumping out Cu with ATP7B

    Let’s take a look at panel D of Figure 1 first. Harder and others used a technique called immunocytochemistry to visualize two proteins at one: Green is ATP7B, a membrane protein that uses ATP to put Cu+ into vesicle that are transported from the trans Golgi network (TGN) to the surface of the cell. Red in 1D is TGN46. a protein maker of Golgi vesicles. The Hepatocyte image on the right was modified from this public access site.

    Figure 1D from Harder 2022 with a diagram of copper trafficking to provide clarity for other graphs in Figure 1.

    Hepatocyte copper handling proteins in response to PA

    At the designated time periods cells were lysed and proteins dissolved in a detergent that gives them a negative charge.  The proteins were separated on a “gel” based on their size as they move through the gel in response to a potential difference.  Proteins in the gel were transferred to a membrane that was incubated with primary antibodies against the copper handling proteins of interest.  These antibodies tend to be produced by injecting rabbits with purified proteins.  The rabbit primary antibodies were detected by antibodies against the invariable parts of rabbit antibodies raised in another animal such a goat.  These goat antibodies are tagged with a reporter.  This is what we see here.  Scientists always perform experiments many times.  Nine times is abbreviated as ”n=9”    

    Figure 1A pumping Cu+ out of the cell

    ATP7B is the copper export protein that uses ATP to pump Cu+ out of the cell.  PA in the cell culture medium causes a slight increase in this protein relative to the control.  First protein levels are normalized to a cytoskeletal protein called β-actin.  Then the normalization to the control is computed.

    ATP7B is the copper export protein that uses ATP to pump Cu+ out of the cell.  PA in the cell culture medium causes a slight increase in this protein relative to the control.  First protein levels are normalized to a cytoskeletal protein called β-actin.  Then the normalization to the control is computed.

    Note that transcription factor Atox1 also ferries Cu+ to ATP7B.

    The mean is another word for the average.  The SEM is the standard error of the mean.  It is simply an indicator of how much the replicates resemble each other.  The smaller the SEM, the tighter the data.  The “p” value indicates how confident we are that the results are not due to random chance.  The smaller the p value,the more confident we are in the results.  The general cutoff for “statistical significance” is p<0.05. 

    Figure 1B, copper chaperone superoxide dismutase

    CCS, the copper chaperone for Cu/Zn superoxide dismutase We’ve discussed CCS and Cu/Zn on this site.  If mitochondria are a major source of superoxide, and if they use electrons from fatty acid β-oxidation making more Cu/Zn SOD would sort of be a good idea when taking in more PA.  This is what we see. 

    Figure 1C, a transcription factor for Cu/Zn SOD3

    ATOX1 is next on the list as it is the chaperone for the export pump ATP7B. Note that unlike ATP7B in panel 1A, ATOX1 increases in response to PA. This site has touched on Atox1 as a transcription factor for Cu/Zn SOD3.

    .  COMMD1 is an accessory protein to ATP7B whose exact function, according to Harder and coauthors, is somewhat obscure.  [1]

    Figure 2 Other ways to export Cu

    The liver makes ceruloplasmin.  Ceruloploasmin is also a protein that transports copper and iron in the blood stream.  Ferroxidase activity happens when ceruloplasmin (Cp) is replete with both copper and iron.  As shown in figure 2, PA has not bearing on Cp secretion and activity.

    Figure 3 binding up excess Cu

    Metallothionein 2A is a putative Cu2+ storage protein.  The level of this protein initially increases with PA and then returns to a level statistically less than the BSA control.

    The rat metallothionein 2 bound to two divalent cations (zinc and cadmium) and a monovalent cation (sodium) came from RCSBhttps://www.rcsb.org/3d-view/ngl/4mt2

    Figure 3 Redox balance

    The Cu/Zn SOD1 initially increases yet returns to a level indistinguishable from the control.    Figure 3C pertained to the ratio of oxidized to reduced glutathione.  Oxidized glutathione is spent glutathione that can no longer reduced oxidized protein thiols or buffer metal ions like Cu+

    PA results in an initial loss of redox capacity.

    The mitochondria Cu chaperone image came from this site.
    This post will not go into how the mito membrane potential fluroescent dye works. We see the expected initial increase in membrane potential at 12 hours with PA. A diagrame of the electron transport chain is also included to illustrate the source of the membrane potential difference.

    This is a nice, thought provoking study with a lot of unanswered questions.

    1. Did intracellular Cu ever increase in response to PA?
    2. What about Cu transporter Ctr1?
    3. What energy demands of these HepG2 cells could possibly be driving PA conversion to ATP? In other words, if there are no energy demands, what could possibly drive beta oxidation of PA and hence the need for copper?
    4. Would the same scenario in their summary Figure 5 also exist in cells that actually burn fatty acid to ATP, CO2 and H2O?
    Figure 5 Harder 2022 “Proposed scheme for possible perturbations of copper homeostasis by PA. At homeostasis (A), copper is mostly sequestered in proteins and organelles with a large concentration in the mitochondria. At short time points of PA exposure (B), cytosolic copper levels are increased alongside mitochondrial dysfunction, leading to a state resembling cytosolic copper overload. With longer PA (C), copper is relocalized toward export by ATP7B and sequestering mechanisms by SLC46A3 and hephaestin resulting in a copper-deficient state.”

    It just seems that the end game is to stop the accumulation of excess dietary fats in the liver.

    Copper, niacin, other lifestyle factors, and NAFLD

    Perhaps the biggest issue we have is to also be finding a reservoir for dumping fat where it will be turned to CO2, H2O, and ideally, ATP. Brown adipose turns fat into CO2, H2O, and heat instead of ATP. An Iranian study points to exercising muscles. This introduction figure shows some ground beef with obvious fat deposits along with some beef fat. Beta oxidation of fatty acids from the triglycerides will enter the TCA (citric acid) cycle in two carbon units. These are released as CO2, which is starred. Cu+ is essential for completion of burning the fatty acids to CO2 (in the TCA cycle) and H2O.

    What separates healthy eaters from the NAFLD pack?

    This study took place at the  Metabolic Liver Disease Research Center at Isfahan University of Medical Sciences in 2019. [2] The study included 405 controls and 225 newly diagnosed cases of NAFLD.  Participants were given a validated   semi-quantitative food frequency questionnaire (FFQ). The take home study was that these participants were eating wonderful Persian food. Their problem was they were eating too much of it and not getting enough exercise. The food cluster that proved to be protective is counter intuitive for those eating a Western diet.  Four major nutrient patterns. Were identified:

    The first nutrient pattern was high in consumption of lactose, animal protein, vitamin D, riboflavin, pantothenic acid, vitamin B12, calcium, phosphorus, zinc, and potassium.

    Yogurt and beef along with rice and vegetables are a common part of the Persian diet.

    The second nutrient pattern included fiber, plant protein, vitamin A, thiamine,niacin, copper, and selenium, Some images of refined grains more than whole grains belong in this image.
    The third featured plant protein, zinc, copper, magnesium, manganese, chromium, and selenium. According to the table below, whole grains and nuts were key components.

    Persians like to enjoy dried fruits with their nuts. Oddly dried fruits were not part of this group.

    The fourth was characterized by fructose, vitamin A, pyridoxine, vitamin C, and potassium. This group consumed a lot of nuts, fruits, and fruit drinks not sweetened by high fructose corn syrup.

    So what is a healthy diet?

    This is a table of correlation coefficients. A value close to zero means no association. A value close to -1.0 is a strong negative correlation. For example Nutrient pattern 4 were eating large amounts of fruit (R=0.81), drinking their share of natural fruit juices (R=0.385), and kind of avoiding red meat (R= -0.105).

    Nutrient pattern 1Nutrient pattern 2Nutrient pattern 3Nutrient pattern 4
    Whole grain(g/d)−0.0260.141a0.752a−0.087b
    Refined grain(g/d)−0.239a0.427a−0.194a−0.360a
    Legume(g/d)−0.0060.155a0.0710.008
    Nuts(g/d)−0.012−0.152a0.131b0.216a
    Red and processed meat(g/d)−0.017−0.093b−0.011−0.105b
    White meats(g/d)−0.035−0.052−0.0070.07
    Low fat dairy(g/d)0.705a−0.172a−0.099b0.046
    High fat dairy(g/d)0.230a−0.113b−0.113b−0.123b
    Fruits(g/d)0.047−0.073−0.115b0.810a
    Vegetables(g/d)0.097b0.035−0.0510.369a
    Egg (serving/d)0.091b0.0340.002−0.091b
    Fruit juice (serving/d)0.047−0.082b−0.0340.385a
    Snacks (serving/d)−0.129b−0.300a−0.120b−0.080b
    Artificial bevarages (serving/d)−0.111b−0.086b−0.092b0.085b
    Plant oil (serving/d)0.095b−0.0140.0470.101b
    Adjusted for age, sex, and energy intake. aP < 0.001,bP < 0.05.

    After adjusting for confounders, individuals in the highest tertile of NP4 had lower odds of NAFLD (OR: 0.56, 95% CI: 0.32–0.98, P_trend = 0.042) compared to those who were in the lowest tertile. Neither copper nor niacin were different between the healthy controls and those with NAFLD. Physical activity and BMI are the most significant differences between healthy Iranians and those with NAFLD.

    1. BMI is still a very significant predictor of NAFLD. Is there any room to argue that is is possible to kick fat out of the liver to be deposited somewhere more “healthy”? Is there a back and forth between fat in the liver, visceral fat, subcutaneous fat, and intramuscular fat? Certainly the latter two are more healthy than the first two.
    2. Lack of exercise is a predictor of NAFLD. This argues that burning dietary fats to CO2 and H20 may be even more important than not consuming the fats in the first. Copper is absolutely needed to make sure that that exercising muscle is NOT dependent on glycolysis for ATP. For the Iranians participating in this study, access to healthy food was not the problem. Cultural taboos against scantily clade males and females exercising in the heat of the summer might be a factor.

    Perhaps a copper and niacin supplement can be part of transitioning to healthy eating and an exercise plan.

    References

    1. Harder NHO, Lee HP, Flood VJ, San Juan JA, Gillette SK, Heffern MC. Fatty Acid Uptake in Liver Hepatocytes Induces Relocalization and Sequestration of Intracellular Copper. Front Mol Biosci. 2022 Apr 11;9:863296. PMC free article
    2. Salehi-Sahlabadi A, Teymoori F, Ahmadirad H, Mokhtari E, Azadi M, Seraj SS, Hekmatdoost A. Nutrient patterns and non-alcoholic fatty liver disease in Iranian Adul: A case-control study. Front Nutr. 2022 Sep 6;9:977403. PMC free article