Wilson’s Disease is an affliction of not being to export copper due to mutations in the ATP7B Cu+ transporter. This study asked the question of how copper in the proper oxidation state affect the health hazards of a high fat Western Diet (WD) versus the normal control (NC) diet. This study utilized wild type mice and those same C57BL/6 mice with the ATP7B gene knocked out (ko)
The Western Diet from Research Diets (D12079B ) contained, per kg, 350 g sucrose, 50 g corn starch, 200g butter,
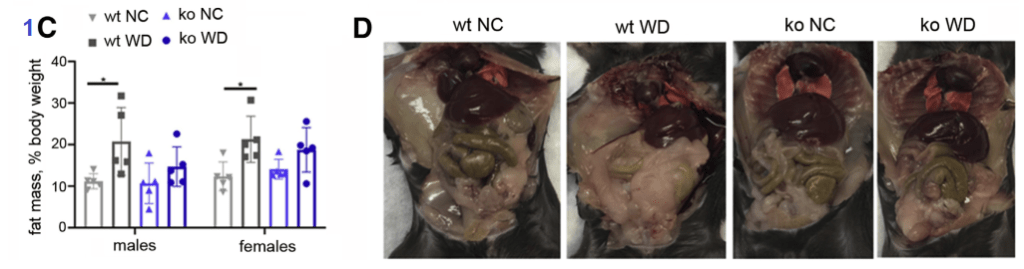
Figure 1A-D
After 9 weeks on the WD vs NC diet, the mouse weight gain was statistically the same regardless of the diet, ATP7B status. The male mice gained weight faster. The percentage body fat was a different matter. When on the Western Diet, both male and female wildtype mice accumulated more fat than their ATP7B knockout counterparts.
From Figure 1 Gottlieb 2022. Note that the ko mice have less fat than their WD wild type counterparts
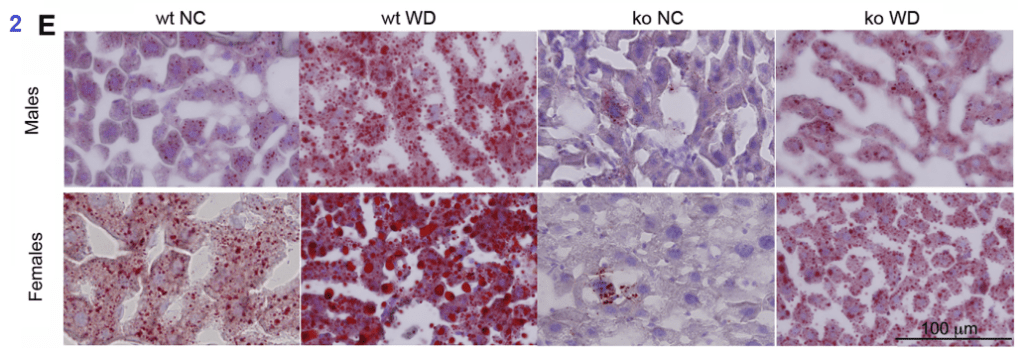
Figure 2
The Western diet increased serum glucose and cholesterol, but not serum triglycerides. Liver triglyceride content was increased by the Western diet. Serum glucose was lower in the TAP7B knockout mice than the wildtypes on the control diet. The Oil red O staining of fat in the liver was telling.
The oil red stains fat. From Gottlieb 2022.
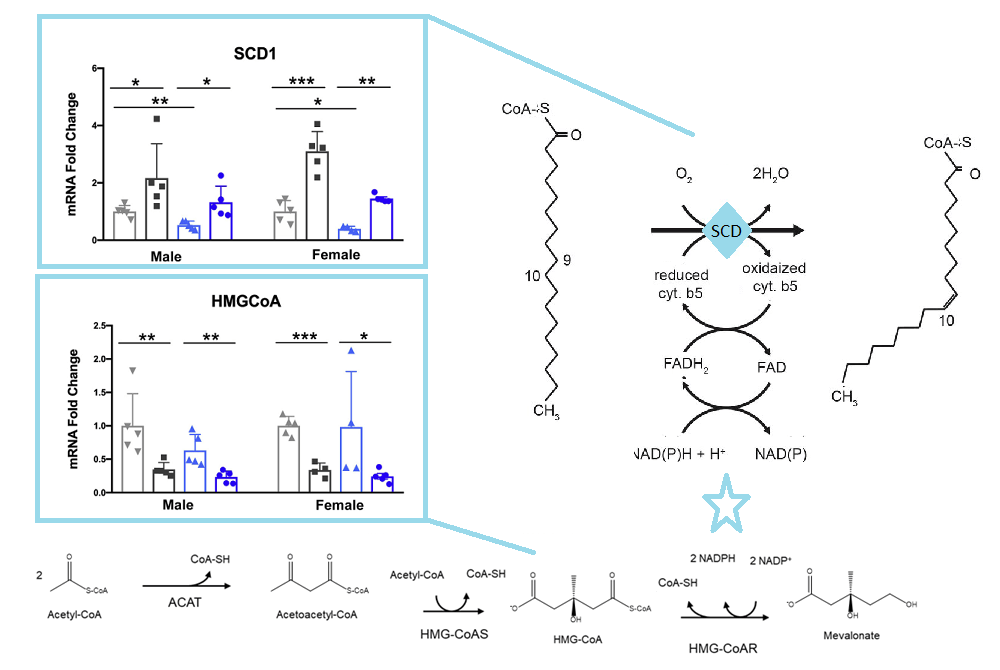
Stearoyl CoA desaturase (SCD) is an enzyme that uses O2 and electrons from reduced cytochrome b5 to introduce double bonds in the delta-9 of acyl-CoA substrate. Β-hydroxy-β-glutaryl CoA is an intermediate in the mevalonate pathway that ultimately leads to cholesterol synthesis. These pathways share NADPH as an intermediate.
The SCD1 and HMGCoA panels are from Gottleib 2022, the pathways are from open sources
Data are from Gottleib 2022 Figures 4 and 5 are not shown in this post. Much of this post is skipping the metabolic pathway ontology of Gottleib 2022 just because it highlights global clusters of enzymes and not ones that specifically use NAD derivatives. We’ve shown one. The take home theme does seem to be that fats accumulate  in the liver because they are not used to produce cholesterol, a process that requires NADH.
Obviously too much of anything is toxic. While Cu+ entered the cells of the ATP7B knock out (ko) mice in this study via normal pathways, it built up to toxic levels. [1] Int is interesting to note that copper toxicity cancelled Western diet toxicity. How much could Cu+ improve the toxicity of the Western diet with functioning ATP7B?
References
Gottlieb A, Dev S, DeVine L, Gabrielson KL, Cole RN, Hamilton JP, Lutsenko S. (2022) Hepatic Steatosis in the Mouse Model of Wilson Disease Coincides with a Muted Inflammatory Response. Am J Pathol. 2022 Jan;192(1):146-159.
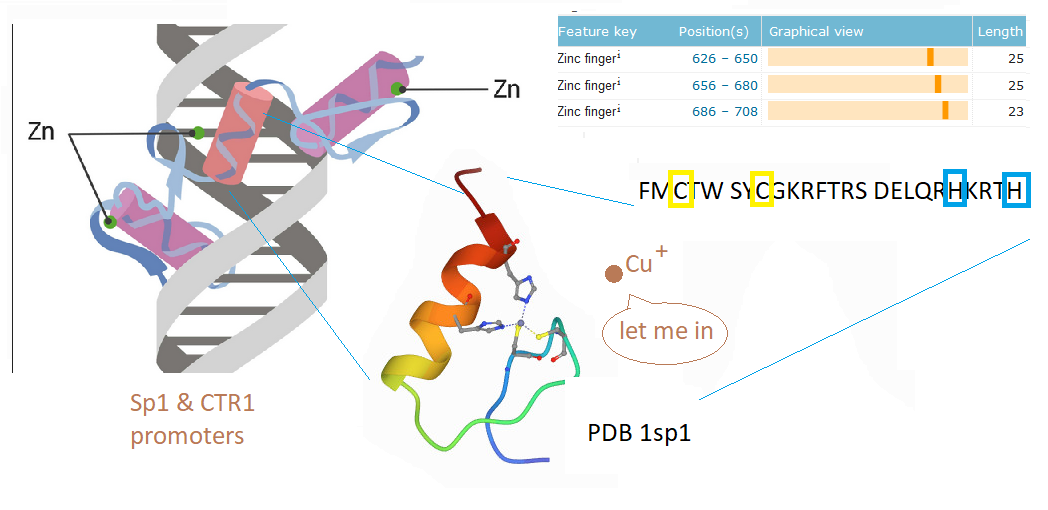
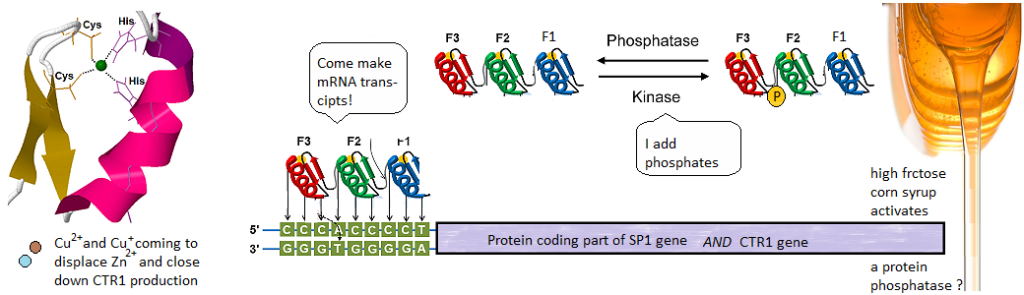
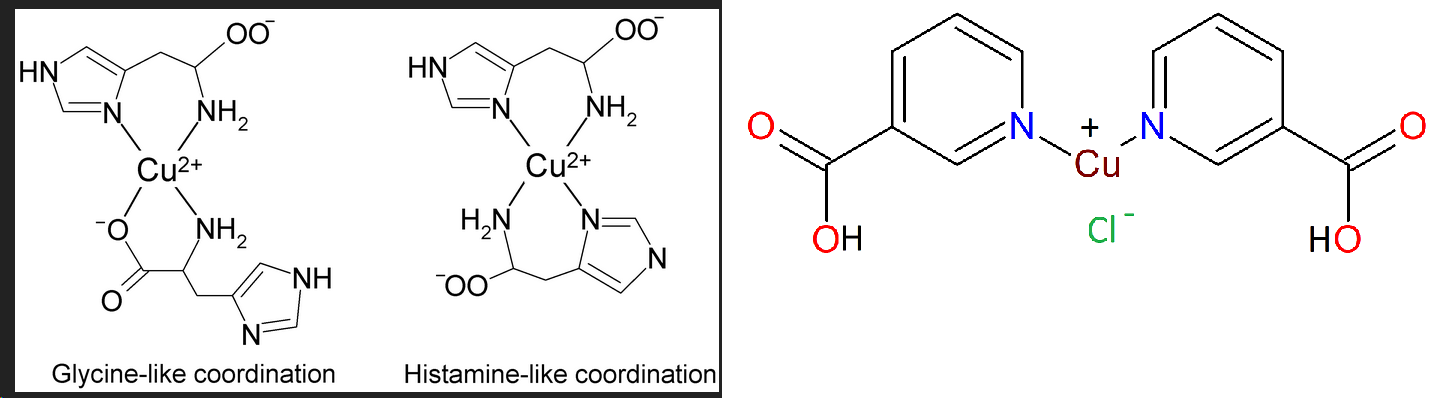
This post investigates a claim in a review by Morrel and coworkers that excessive dietary fructose can decrease the expression of Ctr1 in the duodenum. [1] How could this happen? What is transcription factor for Ctr1? As it turns out, both Cu+ and Cu2+ can bind to the CTR1 transcription factor Sp1 and negatively regulate its activity [2,3] The featured image describes out Cu can disrupt the Zn2+ finger(s?) Sp1 uses to bind to the promoters of itself and CTR1. If you wish to skip the details of some brilliant experiments, click to go to the lay friendly summary.
Cu2+ prevents Sp1 promoter binding
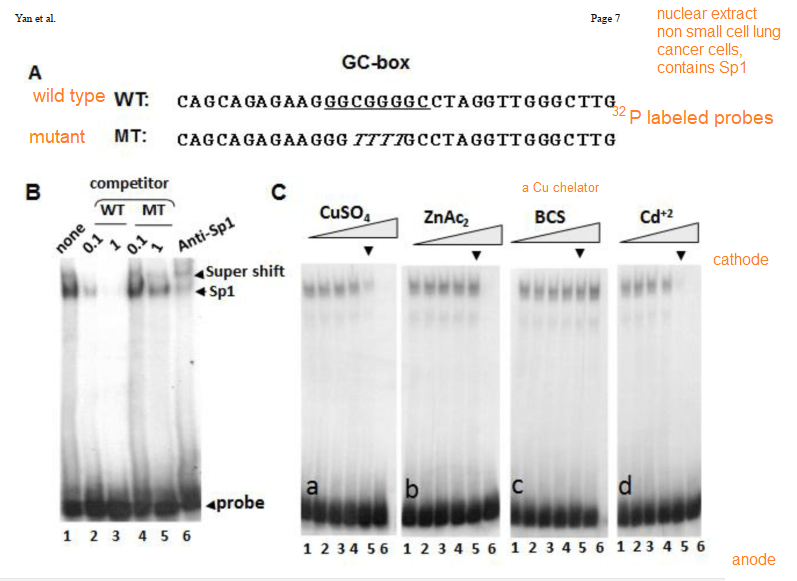
In their introduction to their Cu2+ study Yan and coworkers discussed the role of cysteines and histidines in binding Zn2+ and other transition metals like cadmium and copper. When metal ions are not bound to the zinc fingers of Sp1, Sp1 binds to the GC-rich boxes with the consensus sequence 5’-G/T-GGGCGG-G/A. This GC box lies upstream of the gene for Sp1 itself, CTR1, and many other genes. In the absence of copper, Sp1, the protein transcription factor, increases transcripts for more Sp1 and Ctr1 until copper balance is restored. Figure 1 of this study used a nuclear extract of non small cell lung cancer cells that contained several isoforms of the SP1 protein. This extract was mixed with 32P labeled double stranded DNA probes that have a negative charge. The mixture was added to an agarose gel. An electrical current was applied such that the negatively charged small pieces of probe DNA migrated to the anode. When bound to Sp1, they migrated slower. Concentration ramps of t 0, 1, 10, 50, 100, and 200 µM divalent metal ions were added to test the hypothesis that less probe would be present in the upper band that contains Sp1. A Western blot was performed on the material in 1B to demonstrate that the upper band contains Sp1.
The first lane of 1B is just the 32P labeled probe. The second two lanes are two increasing concentrations of the wildtype probe that is not32P labeled. The two MT mutant probes are also not radioactive. These results demonstrate the specificity of the assay. [2]
Cu+ prevents Sp1 promoter binding
Technically speaking, there should be no free copper inside the cell. It should be bound to some chaperone. Cu should be in the Cu+ oxidation state. This is what is ground breaking in the Yuan 2017 study. Sp1, even when its Zn2+ fingers are metallated and ready to bind to CTR1 promoter, the chaperone Atox1 can donate a Cu+ and turn it off.
1 Cu+ binds to all three Zn fingers
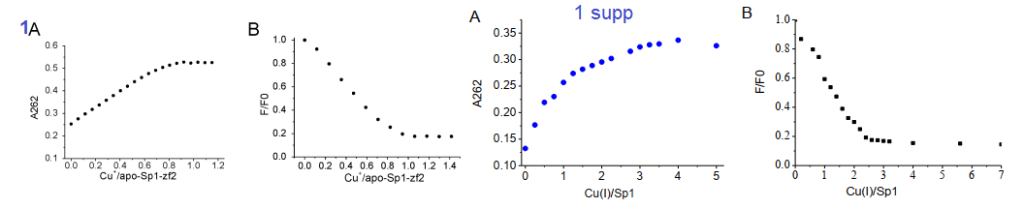
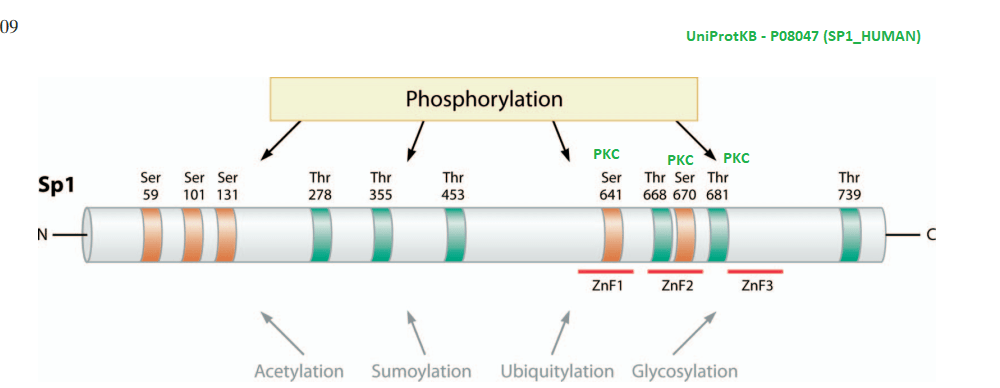
Yuan and coworkers kept Cu in the +1 oxidation state by use of the reducing agent TCEP. The absorbance at 262 nm was taken as an indication of S- Cu+ charge haring transition. [3] This particular experiment only used the second Zn2+ finger. The second Zn2+ finger contains two tryptophans W560 and W571. Tryptophan fluoresce at 340 nm when excited at 280 nm. Fluorescence may be quenched when these aromatic residues are exposed to an aqueous environment, or as the authors speculated, by interactions of the thiolate anion with Cu+. The authors also stated that the apo 2nd Zn2+ finger tends to be unfolded. The amino acid sequence of the 2nd Zn finger is shown in the featured image note that there’s a tryptophan (W) flanked by two cysteines ( C yellow box).
1A the second zinc finger from Sp1. !supp, the full length Sp1
Note that Cu binding data for just the 2nd Zn finger saturate at 1:1 Cu per Sp1. For the full length Sp1, the binding saturates at a 3:1 ratio. This suggests that all three Zn fingers bind Cu.
2. Cu(I) can react with Zn-bound Sp1
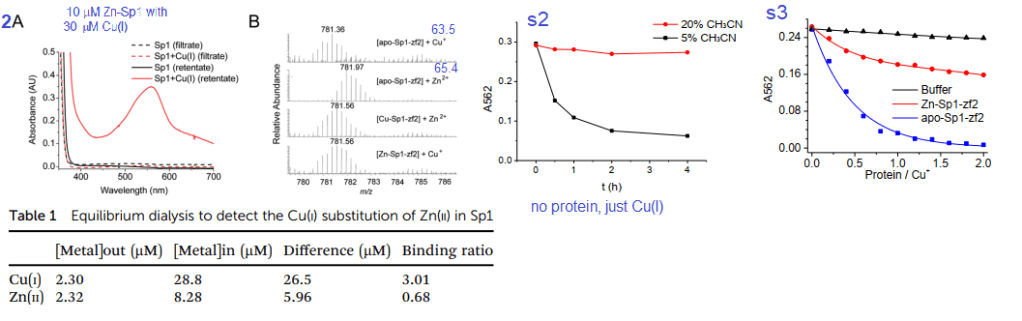
Figures 2A, s2 and s3 used a Cu+ chelating agent called bicinchoninic acid (BCA). BCA has a strong absorbance maximum at 582nm when it binds to Cu+. Panel 2A is not (just) the absorbance spectrum of Sp1 with Cu+. BCA was added to the material retained on an ultrafiltration membrane with a 3 kDa cutoff size. Anything smaller is passed through the filter and larger is retained in a small amount of solution on the top of the filter. As a negative control, the filtrate and retentate of Sp1 that had never seen Cu did not react with BCA to give the magenta color. Table 1 shows the results. Almost all of the 30 μM Cu+ is picked up by 10 μM Sp1. About 2.μ. There was 2.32 μM Zn2+ displaced from 10 M Sp1. 8.28 Zn2+ remained “in†the dialysis tube with the Sp1. These data estimate the Zn2+ – Sp1 binding ratio to be 0.68 and 3.01 for Cu+ to Sp1.
Panel 2B used a technique called mass spectrometry to measure the mass/charge ratio of the Sp1 2nd Zn finger. There is a semi clear reduction in mass when Cu+ displaces Zn2+ These two atoms are very close in mass. To make matters more interesting histidines and cysteines have side chains that may be protonated, or not depending on the pH of the solution and whether they are binding transition metals. Supplemental figure 2 shows use of 5 and 30% acetonitrile as a means of slowing down oxidation of Cu-BCA. Supplemental figure 3 shows just the 2nd Zn finger of Sp1 stealing Cu from CuBCA in the presence of 10% v/v acetonitrile. In just buffer, the absorbance stays fairly constant. As Zn-Sp1-zf2 is added, The absorbance of Cu-BCA decreases about one third of the original. When there is no Zn, the decrease in Cu-BCA absorbance is essentially complete when there is twice as much 2nd Zn finger as BCA bound Cu. Just a note, UV /visible light absorption is often used to measure metal ions interacting with proteins. These contributions are probably not that great in this particular system.
3. NMR experiments
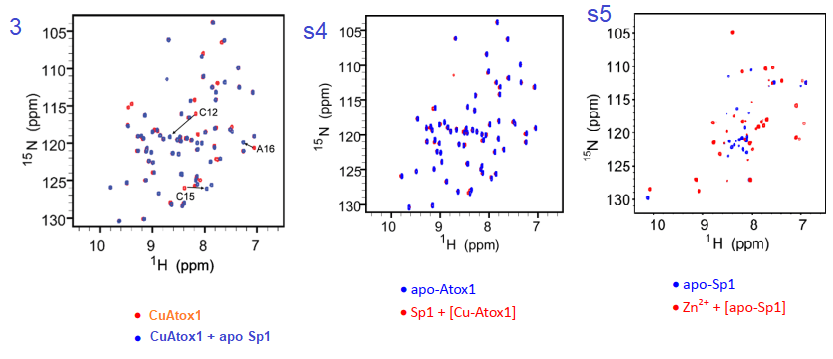
The authors did not disclose details of how they labeled the expressed protein with 15N instead of the more abundant 14N isotope. It is assumed that they supplemented the bacterial expression system with 15N ammonium chloride or something. The NMR technique has heteronuclear single quantum coherence (HSQC) that basically measures 1H-15N pairs within the amino acids of the protein. Each dot on the graph represents a bonded H and N in only the 15N labeled protein.
Figure 3 and complementary supplemental dtaa from Yuan (2017) [3]
Yuan and coworkers reported that the association constant of Cu for KCu-Atox1 = 2.51x 10¹⁷protein. Adding Apo Sp1 changes a number of N-H pairs. Figure s4, going in the reverse direction changes little. We are assuming that Cu-Atox1 is the 15N-labeled protein. Figure s5 is somewhat of a control showing some massive, global changes when Zn2+ binds apo Sp1. Note that these changes seem to be larger than when Cu+ binds apo Sp1.
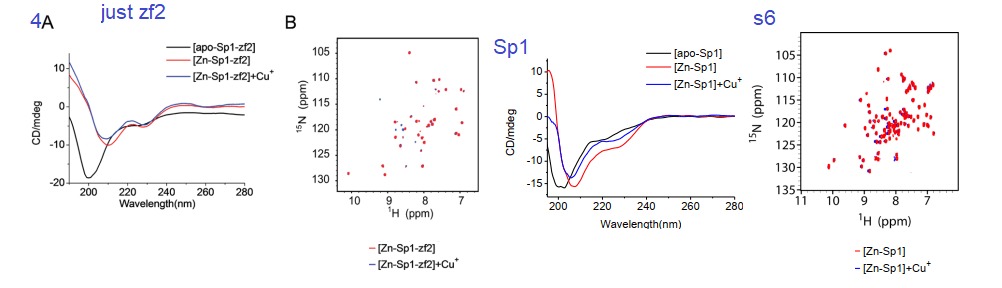
4. Circular Dichroism, a window into protein secondary structure
Circular dichroism is a method involving the absorbance of circularly polarized light by structures within a protein. It is used to measure the proportions of α-helices, β-sheets, and random structures. The yellow to red helix in the featured image is considered an α-helix. Binding of a metal ion may be anticipated to make a protein more ordered.
Fig 4 and supplemental from Yuan 2017
Yuan and coauthors considered that the addition of Cu+ and Zn2+ both resulted in a more ordered zf2. The 2D HSQC NMR data in 4A and s6 also indicated not that much change between the two metal ions and the existence of a Cu finger. Figure s6 is a mirror experiment using the entire Sp1 protein. Zn-Sp1 + Cu+ seems to be somewhere in between the disordered apo Sp1 and Zn-Sp1 structures. Cu+ disruption of GC box binding is what really matters in this story.
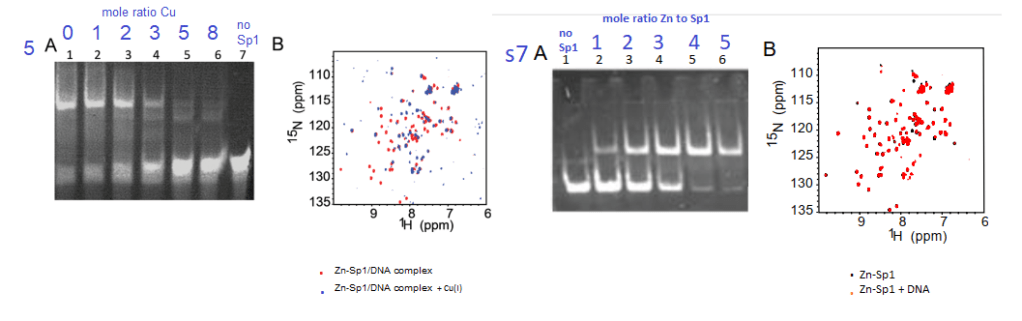
5 Cu+ inhibits Sp1 from binding to GC boxes
Yuan and coworkers also used the gel mobility shift assay to demonstrate tha at about 3:1 moles Cu+ to 1 mole Sp1, the probe of the GC rich binding site on the CTR1 promoter ceases to bind Sp1 (top band, panel 5A. Panel s7A shows the opposite is true for Zn2+. These authors used a lot of NMR data
Figure5 and supplemental figure 7 from Yuan (2017)
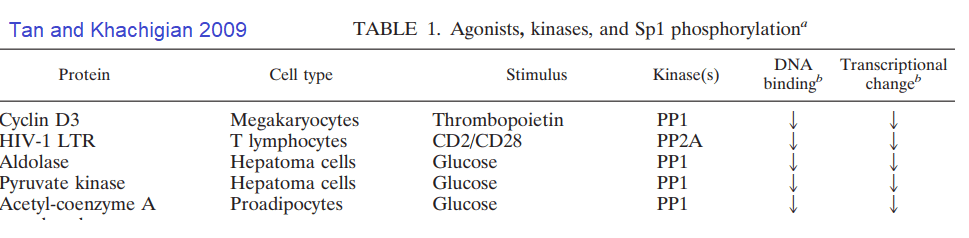
What about post translational changes in Sp1 other than metal binding? Tan and Khachigian wrote an insightful review in this regard.[4]
A highly edited Table 1 from Tan and Khachigan 2009. The many phosphorylation events that lead to activation of Sp1 have been removed.
Some further investigation of the cited references revealed hexose kinase was also down regulated by glucose deprivation. [5] The PP1 inhibitor okadaic acid decreased the increased transcription of aldolase and pyruvate kinase in response to glucose. [5] These authors saw what they interpreted as minor proteolysis of the dephosphorylated Sp1 in their Western blots. [5]
Note that two protein kinase C phosphorylation sites flank Zn finger #2. Protein kinase C is activated by Ca2+.
Concluding remarks
We are little closer to understanding how fructose can lead to copper deficiency than we first began. Over dosing on Cu is still possible. It would seem that nature has given us a way to turn off import when we have enough. Sp1 even “knows” when our Cu chaperones are copper replete. [3] We are only scratching the surface of possible Sp1 post transnational modifications that might impact Sp1 binding to the CTR1 promoter. It is becoming apparent that the cure for copper deficiency may not be as simple as eating more copper.
S-glutathionylation is a postranslational modification that occurs during oxidative stress whereby glutathion forms S-S bonds with protein thiols. Recall that the SH group of Zin finger cysteines. Glutathionylation may be reversed with NADH dependent enzymes thioredoxin and glutaredoxin.
Advanced glycation end products. AGE are formed when -NH2 on side chains of amino acids such as lysine react with the aldehyde groups of sugars, fructose more than glucose. Note that there are a few lysines (K) in the sequence of the 2nd Zn Finger of Sp1.
N-acetylation of lysines may occur on K2 and K703 of human Sp1 according to UniProt.org. K703 is within the 3rd Zn finger. We at CopperOne think that a copper replete, functioning mitochondria is needed for generation of NAD+ which regulates the deacetylation enzyme Sirt1.
Lay_Summary
Sp1 binds upstream of the protein coding parts of its own gene and the gene for the Ctr1 transporter. It contains three Zinc fingers. Cu+ and Cu2+ can displace the Zn and stop Sp1 from making more Sp1 and Ctr1. Sp1 can have phosphates attached to it by enzymes called kinases. Phosphatases take phosphates off. Phosphates some how or another may increase transcription of down stream genes. Speculation is that fructose may activate a phosphatase.. We’ve still no clue as to how fructose causes copper deficiency… just some educated hypotheses.
For CopperOne critics who don’t like us using Dr Brewer as a reference, we are remaining fast in our conviction that Cu2+ is bad. A new colleague shares this conviction. If Cu2+ is absorbed via the divalent metal ion transporter, the right way to absorb proper Cu+ gets shut down.
References
Morrell, A., Tallino, S., Yu, L., & Burkhead, J. L. (2017). The role of insufficient copper in lipid synthesis and fatty-liver disease. IUBMB life, 69(4), 263–270. PMC free article
Yuan S, Chen S, Xi Z, Liu Y. Copper-finger protein of Sp1: the molecular basis of copper sensing. Metallomics. 2017 Aug 16;9(8):1169-1175. PMC free article
Yan, D., Aiba, I., Chen, H. H., & Kuo, M. T. (2016). Effects of Cu(II) and cisplatin on the stability of Specific protein 1 (Sp1)-DNA binding: Insights into the regulation of copper homeostasis and platinum drug transport. Journal of inorganic biochemistry, 161, 37–39. PMC free article
Tan, N. Y., & Khachigian, L. M. (2009). Sp1 phosphorylation and its regulation of gene transcription. Molecular and cellular biology, 29(10), 2483–2488. PMC free article
Schäfer D, Hamm-Künzelmann B, Brand K. (1997) Glucose regulates the promoter activity of aldolase A and pyruvate kinase M2 via dephosphorylation of Sp1. FEBS Lett. 1997 Nov 17;417(3):325-8. free article
We at CopperOne are thinking that we should not forget the other pandemic: Non alcoholic fatty liver disease (NAFLD) According to the National Institute of Diabetes and Digestive and Kidney Diseases, about 24% of the US population have NAFLD. From 1.5 to 8.5% of the US population have non alcoholic steatohepatits. NASH exhibits inflammation in addition to the fat accumulation of NAFLD.
Dong-Mei Zhang, Rui-Qing Jiao, and Ling-Dong Kong of the State Key Laboratory of Pharmaceutical Biotechnology, School of Life Science, Nanjing University in China wrote an interesting review on the topic of fructose [1] that many would consider a poison of the Western diet. This post is devoted to keeping current with the copper and NAFLD literature in 2022. Fructose may be linked to NAFLD [1]
From Zang review [1] Our comments taken from the review in purple DHAP, dihydroxyacetone phosphate; TG: triglyceride; FFA: free fatty acid; UA: uric acid; MG: methylglyoxal; VLDL-TG: very low-density lipoprotein-TG. DNL: de novo lipogenesis. E1: Serine palmitoyltransferase; E2: 3-ketodihydrosphingosine reductase; E3: Ceramide synthase; E4: Dihydroceramide desaturase.
Fructose is absorbed by our GI epithelial cells via Glut5, transported into our circulation via Glut2, and absorbed into our livers via Glut5 again. [1] About half of the fructose we consume is metabolized via “frutolysis” by our livers. [1] Fructolysis products dihydroxy acetone and glyceraldehyde, a triglyceride precursor. [1] This process consumes 1 ATP. The Zhang review seemed to focus on reactive oxygen species (ROS), impairment of the electron transport chain, and general mitochondrial dysfunction. [1]
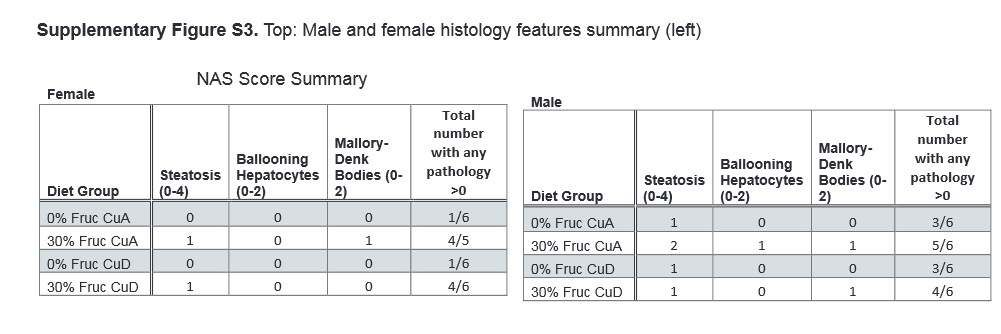
Normal rats on high fructose [2]
This study was a collaboration between the University of Alaska, Anchorage and Montana State University. The study examined biochemical and metabolic parameters in rat chow
These formulations included diets containing
A Copper adequate 12.0 mg/kg Cu,
B Copper adequate plus drinking water with 30% w/v fructose
C Copper deficient <0.2 mg/kg Cu content, no fructose
D Copper deficient, with drinking water with 30% w/v fructose
Note, the Cu in the adequate diet according to supplemental table 1 contained 21 mg per kg “Cu carbonate” without specifying the oxidation state. Otherwise, minerals were supplied as an AIN salt mix without copper. Copper in the AIN salt mix is supplied as cupric carbonate. We at CopperOne have our disagreements with the oxidation state of the copper. While much can be said for a precise laboratory diet, nothing about this diet resembles how rats would be getting their copper in the wild. Rats were kept on this diet for five weeks.
From ref [1]
In this table summarizing results A♀ is females on diet A, B♂ is males on diet B, and so on…
parameter
A♀
B♀
C♀
D♀
A♂
B♂
C♂
D♂
Serum Cu
–
–
–
–
–
↓
↓
Hepatic Cu
–
–
–
–
–
↑
↓
↓
Cp activity, serum
–
–
–
–
–
–
↓
↓
SSAO act, serum & liver
–
–
–
–
–
–
–
–
Complex IV, liver amount
–
–
–
–
–
–
–
–
Ctr1 liver
–
–
–
–
–
–
–
–
ATP7A
–
–
–
–
–
–
–
–
ATP7B
–
–
–
–
–
↑
–
↓
Summary of data from Morrell 2020 “-” indicates no significant change. Arrows indicate the direction of the significant change.
These data were extracted from hierarchical clustering data of figure 6. The treatment groups were arranged to show the top 25 components common to males and females. Only metabolites of interest of this website are shown. NAD+ is the first to show a pattern of decreasing in the fructose loaded rats on a copper adequate diet. Mitochondria going full throttle would be expected to increase NAD+ unless the TCA cycle was keeping up very well. AMP would also be expected to decrease with an adequate supply of calories, especially with fully functional mitochondria.
Note that in both females and males hepatic
NAD+ decreases with adequate dietary copper and high fructose.
AMP, an indicator of poor energy status, decreases probably because of the calorie load from the fructose, but only in the Cu adequate animals. [2]
Fumarate is an intermediate in the TCA cycle that produces NADH reducing equivalents for the electron transport chain.
Glucose is split to form pyruvate, prior to entering the TCA cycle as acetylCoA.
Pyruvate increases with the high fructose and copper adequate diets but not with the copper deficient high fructose diet.
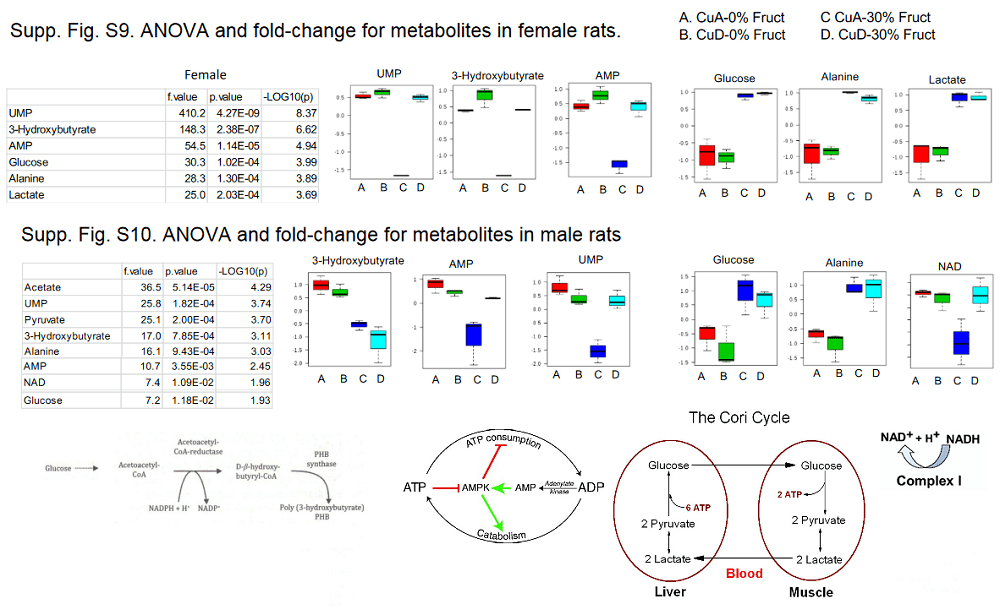
And some numbers from the supplemental data section [2]
Supplemental data figures 9 and 10 highlights [1] with some images of metabolic pathways.
The above image was started with the most significant metabolic indicators in the female rats, Fig s9. Then the same indicators were selected from Fig s10. NAD was not an indicator in females; lactate was not an indicator n males. The most alarming indicator is the alanine found to be elevated in mice of both genders. Are their muscles being broken down in a vain attempt to generate glucose?
The Morrell study seemed to indicate that a “copper adequate” diet was worse than a copper deficient diet when it comes to dealing with fructose liver toxicity. It should be remembered that these rats were getting the copper in the form of Cu(II) carbonate. We at CopperOne think of Cu(II) as “toxic copper.” The Zhang review {2] did review papers suggesting the role of electron transport chain defects and the reactive oxygen species super oxide. [2] CopperOne’s response would be that Cu/Zn superoxide dismutase and mitochondrial cytochrome C oxidase receive their Cu from Cu(I) carrying chaperones. We’d like to continue the work of Morrell and others [2] with proper copper. Excess fructose in the diet will perhaps always be considered toxic with or without proper CopperOne.
References
Zhang DM, Jiao RQ, Kong LD. High Dietary Fructose: Direct or Indirect Dangerous Factors Disturbing Tissue and Organ Functions. Nutrients. 2017;9(4):335. PMC free article
This review carried the torch of Dr Brewer in trying to shed light on the hazards of using copper (II) sulfate to control pathogens on food crops to the international community. This review cited the literature on links to Alzheimer’s Disease and alternatives to CuSO4 to control pathogens.  This review did not discuss whether the CuSO4 used to control pathogens gets incorporated into nicotianamide or some other less toxic compound.Â
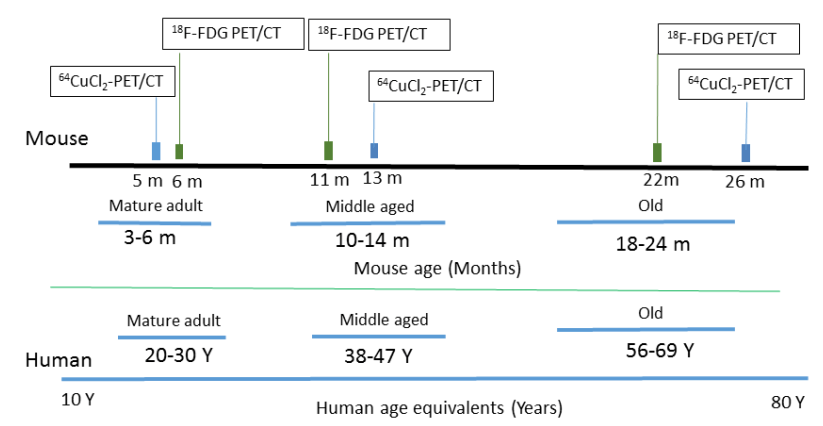
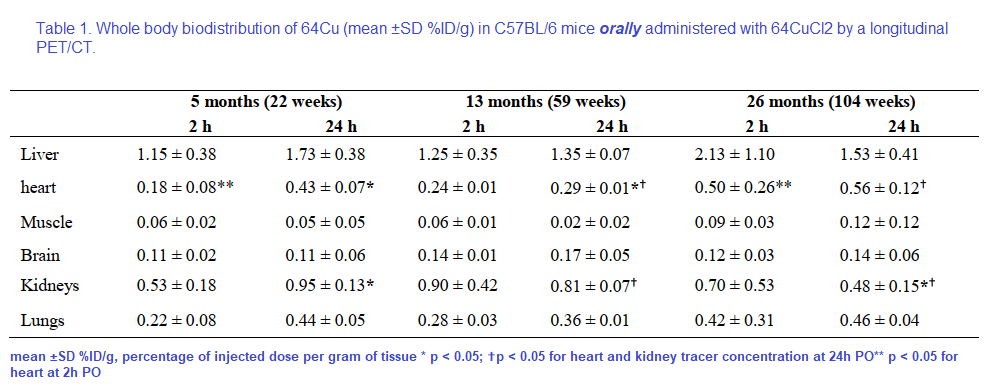
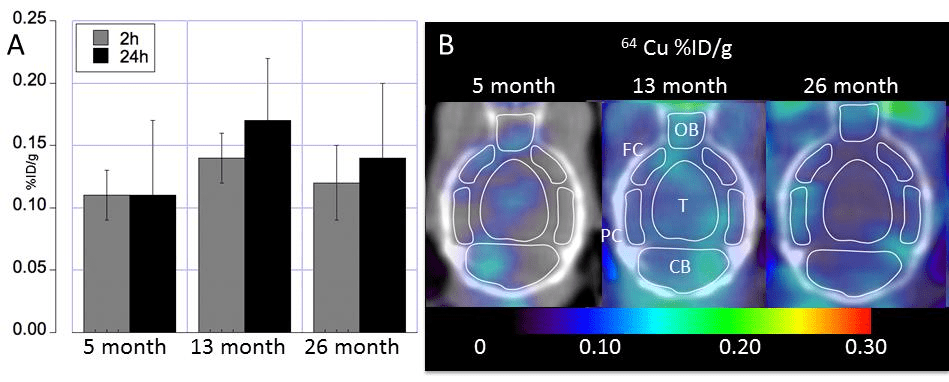
The use of 64Cu PET imaging is continuing to teach us things about how copper moves about mammalian bodies, in particular the brain. This particular study was a collaboration between UT Southwestern and Wayne State. Production of the tracer 64CuCl2 required a biomedical cyclotron and 64Ni(p,n)64Cu at Washington University (St Louis, MO) A 0.1M HCl solution was used to dissolve the radioactive tracer. The goal was to follow 64CuCl2 orally ingested in a common strain of mice, C57BL/6 mice, at various ages.
Figure 1 from Peng 2018. Note that both the copper and glucose analog FDG were given orally.
18F-FDG, or 2-deoxy-2-[F-18]-fluoro-D-glucose is used to visualize where the glucose is going in the circulation. What makes this study unique is the oral dosing, 64CuCl2 (2 μCi(74 kBq)/g body weight) diluted in normal saline. Delivery was via a blunted oral feeding tube, followed 15min static whole-body imaging at 24 hours. It was the heart and kidney that showed the greatest age-related differences.
Table 1 from Peng 2018 [2]
Note that the percentages of the initial dose don’t come even close to adding up to 100% Figure 2 gives us a reason as to why.
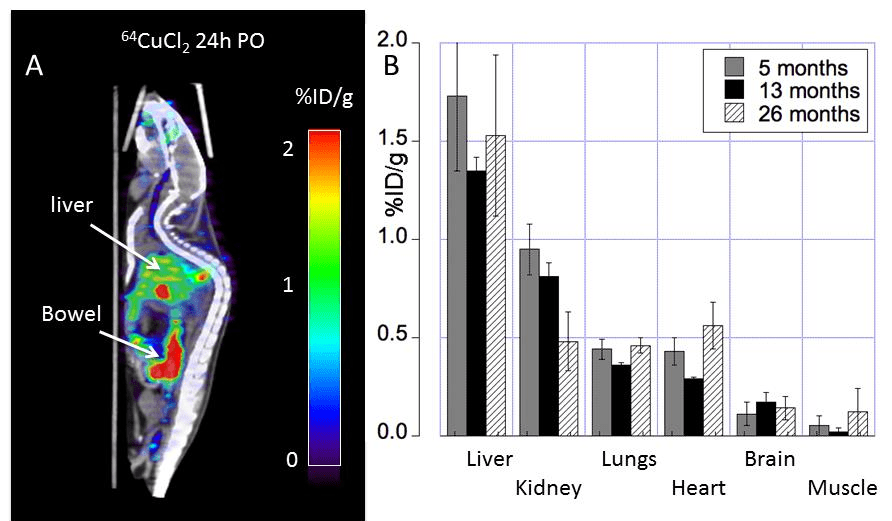
Figure 1 from Peng 2018 [2]
Note the large amount of the 64Cu is in the bowel. The % initial doses do not seem to add up to be 100%. How much of the initial 64CuCl2 was excreted in the urine or feces? Are the blue speckles underneath the red labeled object labeled “Bowel†feces? The liver is green with yellow horizontal stripes. Is this indicative of 64Cu being incorporated into a chaperone protein like ceruloplasmin?
The glucose utilization does not seem to follow copper deposition. For some reason muscle and renal utilization seem to increase the most in going from middle to old age.
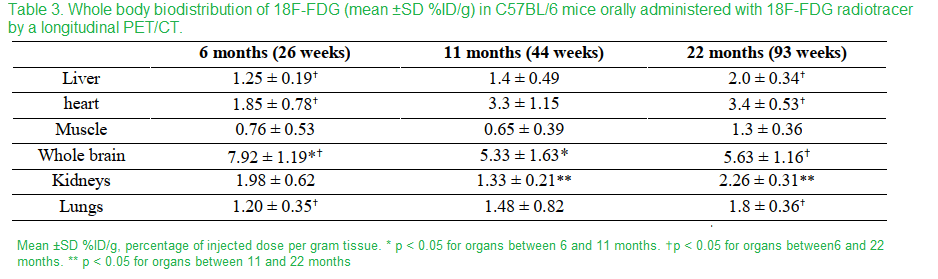
Table 3 Peng 2018 [2]
In going from middle age to old mice, muscle and kidneys showed the greatest proportional increase. The most telling nuance is the whole animal imaging.
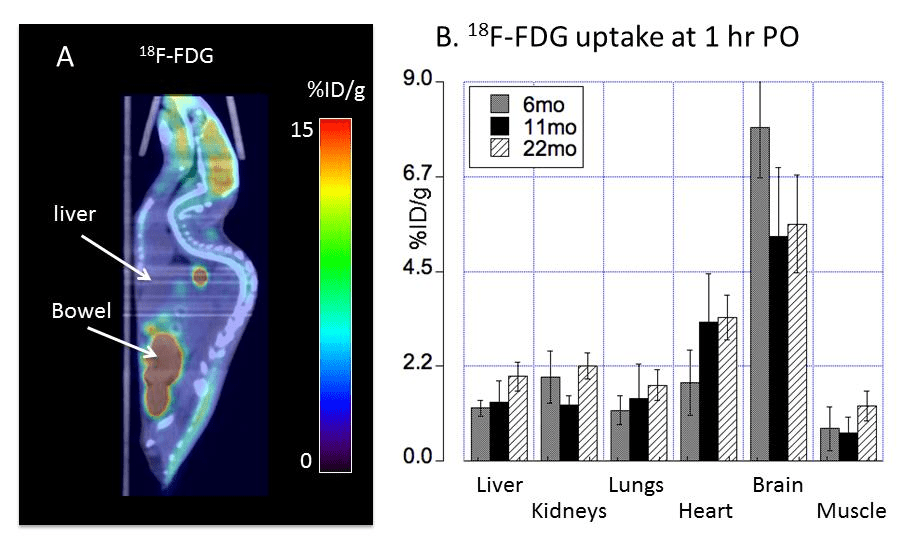
Fig 4 Peng 2018 [2]
The metabolic demands of the liver are fairly high. The liver uptake of glucose might be high when conditions are conducive for production of glycogen. Note that mice were given FDG orally prior to a fast. “Bowel†here likely refers to the small intestine. Also note that there are not little balls going down that would be suggestive of this glucose analog being lost in the feces.
Really no change in Cu uptake in the aging mouse brain?
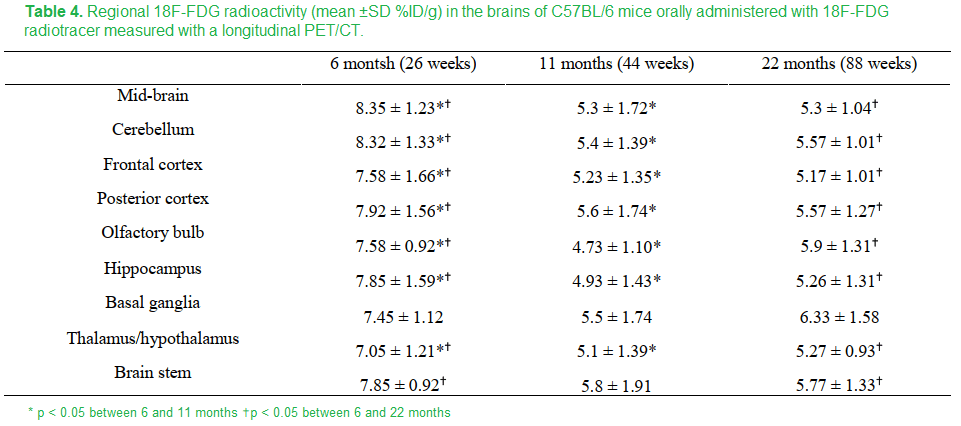
The apparent no change in the aging mouse brain masks in increase in brain stem and decreases in the hypothalamus/thalamus and basal ganglia.
The FDG measurement of glucose utilization was lower in all regions in the brain in going from 8 to 11 months except the basal ganglia and brain stem. These regions experienced an increase in copper. Is this maintenance of FDG due to maintenance of circulation and dilation of cerebral blood vessels?
Fig 3 from Peng 2018 [2]
Just to round things up, this these are the data for FDG uptake
Table 4 Peng 2018 [2]
It would be interesting to see these experiments repeated with a Copper One supplement like Dr George Brewer recommended.
Cu2+ handling by presenilin
Ca2+ is a natural part of the synaptic cleft function. [3] The presenilin story comes from Ashley Bush’s lab that has long studied how Xu2+ modulates ion channels and what not in the synaptic cleft. This is all a good thing with mechanisms of cleaning up the Cu2+.
Presnilins, clean up proteins and a protease
The γ-secretase is a multiprotein complex that digests integral memembrane proteins. Presenilins 1 and 2 are aspartate protease members of this complex. The amyloid precursor protein (APP) is the most famous target of the γ-secretase complex. When it comes to PSEN1 and PSEN2 mutations that are associated with Alzheimer’s the mutants exhibit altered processing of APP.
Ctr1 is the main importer of Cu+ to the cell, However, 30% of cellular copper import occurs by uncharacteristic mechanisms according to the Bush group’s review of the literature in 2011..The Bush group mentions transporters for Zn2+ and a few of the many enzymes that use Zn2+ as a cofactor. We know that divalent cations like Zn2+ and Cu2+ may catalyze amyloid formation.
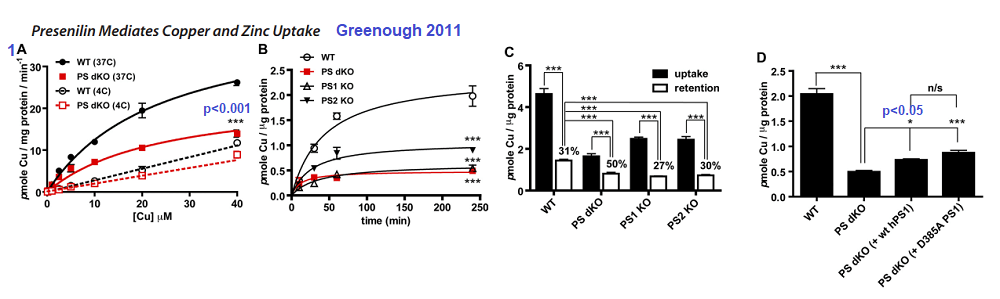
Uptake of 0.4MBq of 64CuCl2 (Australian Radiopharmaceuticals and Industrials) and unlabeled CuCl2. Copper was determined in Hank’s balanced salt solution. Uptake was stopped by swashing the cell monolayers of mouse embryonic fibroblasts with ice-cold nonlabeled HBSS (with 2 mM L-histidine).
Figure 1 Greenough 2011 [4]
1A The double PSEN1/2 knockout fibroblasts exhibited lower Cu2+ uptake compared to the wildtype at 37oC. The difference was lost at 4oC
1B Time dependent uptake of 2.5 µM 64CuCl2 at 37oC. Loss of PS1 or PS1/2 results in loss of copper uptake.
1C Actual incorporation of copper into proteins is another matter.
1D Rescuing the double Knock Out with human versions of PS1 does not seem to help.
Figure 2 Greenough 2011 [4]
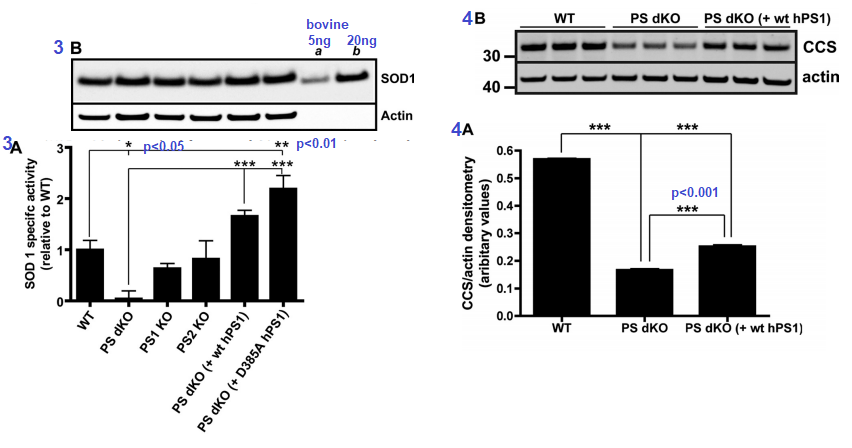
Figure 3 [4] ..Presenilins influence the activity of Cu/Zn SOD1. The assay used mouse embryonic fibroblasts. The D385A mutant of human PS1 is catalytically inactive when it comes to protease activity, but is capable of doubling the Cu/An SOD1 activity. The double knock PS cells had virtually no SOD1 activity suggestive of inability to metalate the enzyme. Expression of SOD1 was fine (3B). Actin is a housekeeping protein used as a loading control.  Â
Figures 3 and 4 from Greenough 2011 [4]
Figure 4 CCS is the copper chaperone for SOD1. CCS is responsible for ensuring that Cu+ is properly inserted into SOD1. Not having both copies of PS translate into not having as much CCS transcribed as mRNA and/or translated into the CCS protein that can be detected in a Western blot (Figure 3B)
Figure 5 looked at Cu2+ and Zn2+ content in soluble and insoluble proteins by tissue, eg brain, kidney, heart… in wild type mice and mice having only one of two copies of the PSEN1 gene. While there as a statistically significant drop from about 65 to 55µg Cu per g soluble protein in the brain, it is uncertain if this difference is functionally significant. Likewise, small but significant decreases in were seen in SOD1 activity and CCS protein amounts in PSEN-/+ mice compared to PSEN+/+ mice, Fig 6.
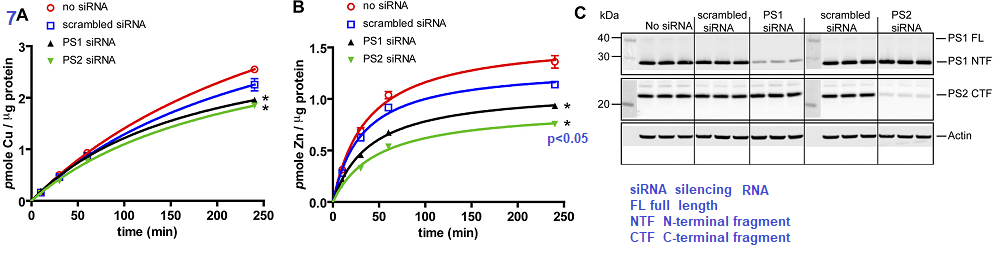
The authors took a likely different approach. They started out with a human embryonic kidney cell line, HEK293T and prevented the mRNA transcripts for PS1 and PS2 from being translated into protein by use of silencing RNA (siRNA) Scrambled siRNA is the same complementary sequences scrambled such that it cannot bind to the untranslated mRNA.
Figure 7 Greenough 2011
The authors demonstrated that silencing of mRNA translation into proteins resulted in a small but significant decrease in Cu loading of proteins (7A) and perhaps a 50% decrease in Zn protein incorporation (7B). Panel 7C shows that the siRNA was successful in knocking down mRNA translation into presenilin proteins. The authors finished up their story in Figure 8 that presented data showing that pharmacological inhibition of protease activity did not affect the Zn and Cu loading.
Concluding statements of the authors brought the reader back to the laboratory’s primary interest: extra-neuronal Cu2+ and Zn2+ released into the synaptic cleft. They cited evidence supporting hyper metallation of A by divalent cations in the synaptic cleft. In glutamatergic synapses, Zn2+ and Cu2+ are uniquely high. [3]
Cu distribution tissue and subcellular
Peng and coauthors demonstrated that Cu2+ distributes distributes differently in young, middle, and old mice. [2] They did not make a big deal of it, but it seemed that most of the copper was being lost in the feces. A parallel study needs to be performed using a more bio available Cu+ source, in our opinion.
Greenough and coauthors made a thoughtful case for presenilin being an alternative way to load proteins with Cu2+ in fibrobasts and in synaptic cleft. [4] These results suggest that nature has a clever way of recycling Cu2+ from the synaptic cleft before it aggregates with Aβ or otherwise cause problems. Why overload this system by drinking water from copper pipes, eating produce treated with CuSO4, or taking cupric dietary supplements.
References
Coelho, F. C., Squitti, R., Ventriglia, M., Cerchiaro, G., Daher, J. P., Rocha, J. G., Rongioletti, M., & Moonen, A. C. (2020). Agricultural Use of Copper and Its Link to Alzheimer’s Disease. Biomolecules, 10(6), 897. PMC free article
Peng, F., Xie, F., & Muzik, O. (2018). Alteration of Copper Fluxes in Brain Aging: A Longitudinal Study in Rodent Using 64CuCl2-PET/CT. Aging and disease, 9(1), 109–118. https://doi.org/10.14336/AD.2017.1025 PMC free article
Opazo, C. M., Greenough, M. A., & Bush, A. I. (2014). Copper: from neurotransmission to neuroproteostasis. Frontiers in aging neuroscience, 6, 143. PMC free article
Greenough, M. A., Volitakis, I., Li, Q. X., Laughton, K., Evin, G., Ho, M., Dalziel, A. H., Camakaris, J., & Bush, A. I. (2011). Presenilins promote the cellular uptake of copper and zinc and maintain copper chaperone of SOD1-dependent copper/zinc superoxide dismutase activity. The Journal of biological chemistry, 286(11), 9776–9786. PMC free article
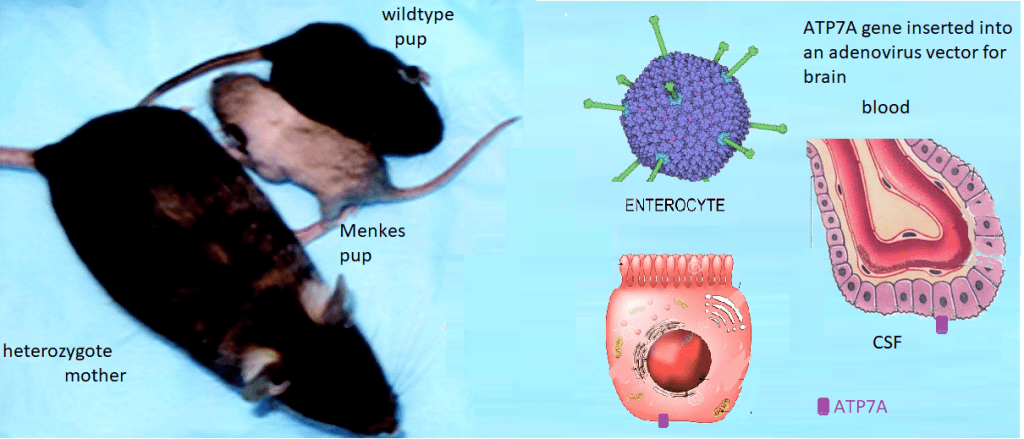
Menkes Disease is an X-linked infant onset disorder of copper transport caused by mutations in the ATP7A copper transporter. [1] Seizures, hypotonia, gross motor delays were some of the neurological deficits caused by mutations in ATP7A. The authors of Wikipedia list a series of symptoms of Menkes Disease that reads like a list of every cuprous enzyme in the body. Steven Kaler’s group describes a somatic mutation in ATP7A that occurred during embryonic development such that not every organ system was affected. [1]
Lay summary of Stephen Kaler’s work. Mice without functional ATP7A copper transporters cannot transport Cu+ from inside the gastrointestinal enterocyte to the blood. Cu+ goes in the opposite direction in the choroid plexus. ATP7A is needed to get from inside the enterocyte to the CSF where Cu can be delivered to the brain. Dr Kaler has been working on gene therapy targeted to these long-lived cells.
This is the lay summary. Some details of experiments are presented. Some CopperOne thoughts on how cuprous niacin might bypass the need to directly inject copper into the blood because it cannot be transported from inside the enterocytes to the blood.
ATP7A gene therapy plus Cu(II)Cl2 injections
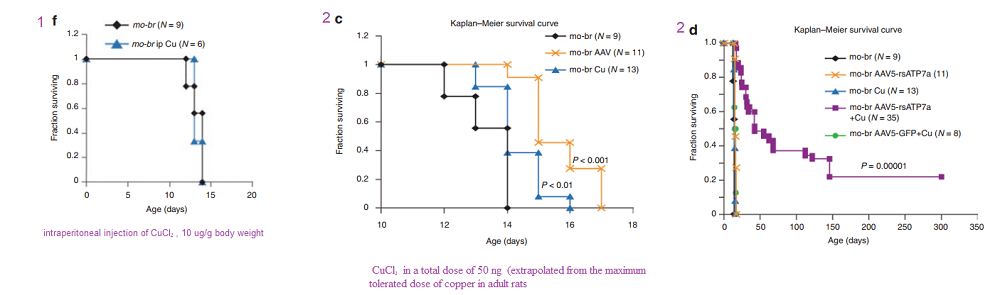
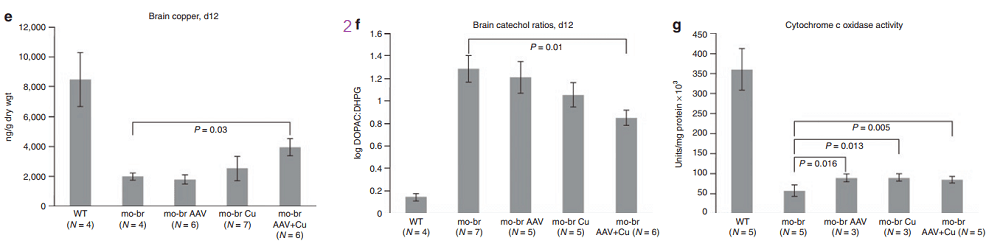
In another Kaler laboratory used a “mottled brown†mo-br mouse mutation at resembles human Menkes disease. Unlike the human treatment that includes subcutaneous injection of copper, the mo-br mutation on C57BL/6 background is not rescued by peripheral copper administration. Neonatal mo-br mice received lateral ventricle injections of either adeno-associated virus serotype 5 (AAV5) harboring a reduced-size human ATP7A (rsATP7A), copper chloride, or both. Brain activity of dopamine-β-hydroxylase, a copper-dependent enzyme, and correction of brain pathology.
According to the authors, choroid cells are not replaced in the adult lifespan of the mouse. It goes without saying that mice were not were not subjected to intraventicular injection of copper for 300 days. The adenovirus gene therapy was performed on day 2 and the CuCl2 on day 3. Note that only copper treatments extend the brain copper. ATP7A gene therapy was needed to improve copper utilization. Injection of copper and adenovirus ATP7A gene therapy augmented brain copper content. Brain ratios of dihydroxyphenylacetic acid: dihydroxyphenylglycol (DOPAC: DHPG) were increased in untreated mo-br mutants, reflecting dopamine-β-hydroxylase deficiency.
A few years later the Kaler group conducted a similar study with a Cu(II) histidine chelate that is injected subcutaneously. The idea is to bypass ATP7A in the basolateral membranes of enterocytes. These injections improve the outcome with those who ATP7A mutation(s) result n a partially functional proteins.
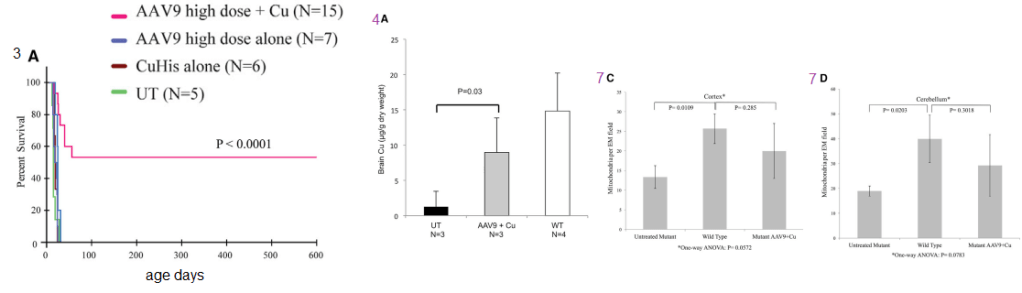
Figure 1 (not shown n this post), the authors performed an adenovirus mock infection with green fluorescence protein and then performed immunohistochemistry to show its distribution. Since this post is about copper, these data will not be presented. Figure 2 showed data validating their transfection methodology and that the reduced size ATP7A responded to increasing copper concentration by moving to the cell membrane. Figure 3 showed some more controls. About 2x as much reduced size ATP7A was expressed in the brains of transfected wild type mice as was full length ATP7A. The survival curve of panel 3A is perhaps most interesting to a copper supplement company.
Panels from Haddad (2018) Figures 3, 4, and 7.
It is not enough to perform ATP7A gene therapy on these mo-br mice. The wild type survive just fine on copper in the rat chow. The gene therapy mice required copper histidinate (1 mg/mL) in a total dose of 15 mg by subcutaneous injection on the back, flank, or neck region, in three 5-mg doses on day 4, day 5, and day 6. This is because they still lack fully functional ATP7A transporters in the basolateral membranes of their GI eptithelial cells. This study went on for 300 days. Figure 3 also showed that the gene transfer was mostly in the brain, with a very low cell turnover. Vectors per mouse genome were less than one in the heart, liver, and muscle. Data were not presented for the small intestine, with a very high cell turnover. Seven of the eight of the Cu histidinate plus AT{7A gene therapy did not make it to day 50 whereas the remaining 8 made it to day 300, Would less have died by day 50 if they had been injected with cuprous histidinate or cuprous glycinate?
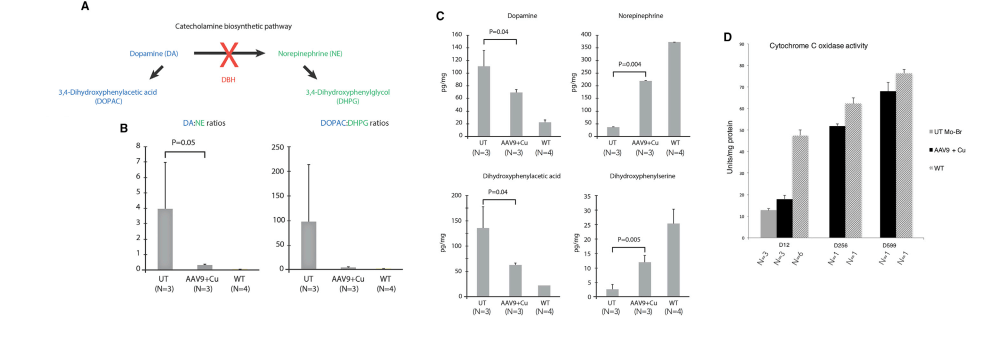
What we find interesting about Figure 5 is its relevance to any copper deficiency syndrome that might have causes other than a dysfunctional to marginally functional ATP7A.
Figure 5 from Hadadd 2018 [3]
Tying this back to cuprous nicotinic acid
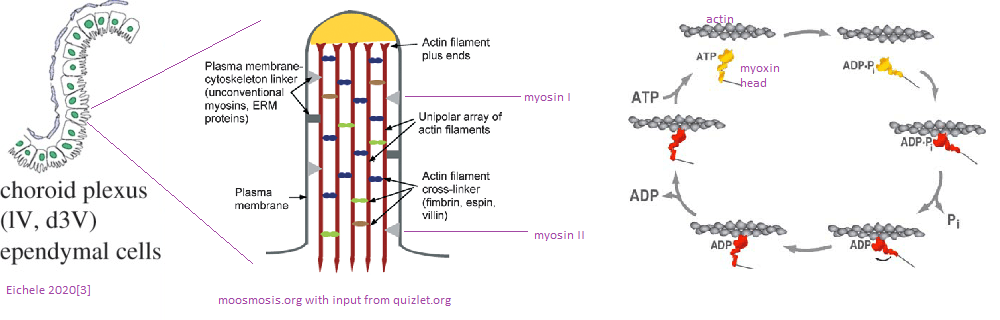
We have thought of transdermal copper administration. Would an injected or transdermal copper in the +1 oxidation state be more available to Ctr1, see next image, and therefore more able to restore normal neurotransmitter levels?
Some transporters we think about
Monocarboxylate transporters MCT are primarily known as transporters of lactate, a byproduct of glycolysis. Lactate is transported by the blood back to the liver where it is converted to pyruvate and then back to glucose. MCT1 was observed in the apical cytoplasmic membrane of some epithelial cells in the choroid plexus MCT4 was found in the basolateral cytoplasmic membrane of small number of epithelial cells. [4] A recent PET study with the MCT1 MCT1 inhibitor AZD3965 demonstrated that MCT1 is transporter for 11C labeled niacin more so in the kidney, heart, and liver than the brain [5] A 1979 traced the CSF, choroid plexus, and brain appearance of 14C nicatinamide and niacin injected intravenously in rabbits rabbits. [6] Nicatinamide, but not niacin, rapidly entered these compartments. A 2007 review echoed these results that the nicotinamide vitamer ofr niacin is what is transported across the blood brain barrier. [7] That these unnamed transporters are low specificity, high capacity, and unidirection with the provision that nicotinamide tends to be rapidly converted to NAD. [7]
A mass spec proteomics study
Choroid plexuses were isolated separately from the right-lateral, left-lateral, third, and fourth ventricles of 6 month old porcine brains. [8] Note that this study also used leptomeninges in addition to the choroid plexus: left, right, 3rd, and 4th ventricles. [8] A method was used to separate CSF (aptical) and blood (basolateral (blood) membrane vesicles of the meninges. MDR1 and OAT1 were considered as blood (dura)- and CSF-facing plasma membrane markers at the BAB. [8] This figure has been modified from Uchida 2020 [8}: It is presumed that apical and bsaolatreal orientations of the transporters are the same in the choroid plexus as they are in the meninges. Ctr1 and ATP7A (starred) have been added. Relative expression of these transporters has been totally neglected in this post.
Adapted from Uchida 2020 Figure 2.
MCT1, the monocarboxylate tansporter, is involved in transporting, lactate, pyruvate, and branched chain amino acids.
xCT Sodium-independent, high-affinity exchange of anionic amino acids with high specificity for anionic form of cystine and glutamate.
Future directions?
We’d like to learn more.
References
Donsante, A., Johnson, P., Jansen, L. A., & Kaler, S. G. (2010). Somatic mosaicism in Menkes disease suggests choroid plexus-mediated copper transport to the developing brain. American journal of medical genetics. Part A, 152A(10), 2529–2534. PMC free article
Donsante, A., Yi, L., Zerfas, P. M., Brinster, L. R., Sullivan, P., Goldstein, D. S., Prohaska, J., Centeno, J. A., Rushing, E., & Kaler, S. G. (2011). ATP7A gene addition to the choroid plexus results in long-term rescue of the lethal copper transport defect in a Menkes disease mouse model. Molecular therapy : the journal of the American Society of Gene Therapy, 19(12), 2114–2123. PMC free article
Haddad, M. R., Choi, E. Y., Zerfas, P. M., Yi, L., Martinelli, D., Sullivan, P., Goldstein, D. S., Centeno, J. A., Brinster, L. R., Ralle, M., & Kaler, S. G. (2018). Cerebrospinal Fluid-Directed rAAV9-rsATP7A Plus Subcutaneous Copper Histidinate Advance Survival and Outcomes in a Menkes Disease Mouse Model. Molecular therapy. Methods & clinical development, 10, 165–178. PMC free article
Murakami R, Chiba Y, Nishi N, Matsumoto K, Wakamatsu K, Yanase K, Uemura N, Nonaka W, Ueno M. Immunoreactivity of receptor and transporters for lactate located in astrocytes and epithelial cells of choroid plexus of human brain. Neurosci Lett. 2021 Jan 10;741:135479.
Bongarzone, S., Barbon, E., Ferocino, A., Alsulaimani, L., Dunn, J., Kim, J., Sunassee, K., & Gee, A. (2020). Imaging niacin trafficking with positron emission tomography reveals in vivo monocarboxylate transporter distribution. Nuclear medicine and biology, 88-89, 24–33. PMC free article
Spector R. Niacin and niacinamide transport in the central nervous system. In vivo studies. J Neurochem. 1979 Oct;33(4):895-904.
Spector R, Johanson CE. Vitamin transport and homeostasis in mammalian brain: focus on Vitamins B and E. J Neurochem. 2007 Oct;103(2):425-38. Free article
Uchida Y, Goto R, Takeuchi H, Åuczak M, Usui T, Tachikawa M, Terasaki T. (2020) Abundant Expression of OCT2, MATE1, OAT1, OAT3, PEPT2, BCRP, MDR1, and xCT Transporters in Blood-Arachnoid Barrier of Pig and Polarized Localizations at CSF- and Blood-Facing Plasma Membranes. Drug Metab Dispos. 2020 Feb;48(2):135-145. free article
This post is refuting an attack on Dr George Brewer who joined us in proclaiming the need for CopperOne. Dr Brewer claimed that small amounts of Cu2+ in our drinking water may contribute to Alzheimer’s Disease. This post asking if copper is safe for seniors critically examines the claims of Dr George Brewer.
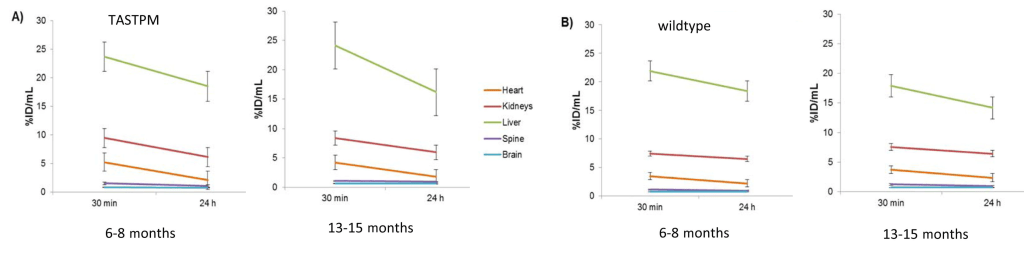
The featured positron emission tomatography (PET) study loaded the blood mice with 64Cu2+ acetate a cell permeable Cu+ chelaate and monitored its distribution over a 24 hour period. They loaded some TASTPM mice engineered with gene mutations associated with early onset Alzheimer’s Disease. [1] Towards the end, the special TASTPM mouse Alzheimer’s Disease model and copper’s role in amyloids will be discussed.
Argument against Dr Brewer
Point 1. This post has nothing to say about the cost. This post will review 2022 literature on the link between copper II Cu2+ and Alzheimer’s Disease so that the reader will understand the cost more.
Point 2. Their hypothesis:
At the Mitosynergy product page above is a link to what they claim is the science behind their product:
“I refuted at least two of these “anti copper†studies in my book. First, 0.12 ppm copper in water is the same as 0.12 mg/Liter. It’s not copper to blame, it’s clearly copper deficiency. It is not nearly enough copper to be toxic.
In the second study, it’s 3 mg of copper. Paired with known neurotoxic bad fats, and a diet very high in those bad fats. Again, not enough copper to be toxic, but the copper does help our bodies turn fats into the myelin sheath around the nerves, which is why, even in our Facebook group’s description, at https://www.facebook.com/groups/thecopperrevolution”
Interesting points, Jason Hommel. Let’s explore where this Cu2+ was found to accumulate.
Prelude: ventricles and copper
As we shall discuss, Cu2+ becomes deposited in the ventricles of the brains of normal middle aged and old mice. [1] Since at least 1988 we have known that the ciliated ependymal cells of the ventricles contain actin and myosin. [2] Skeletal muscle isoforms of actin and myosin are responsible for movement of those muscles. Likewise, these ciliated cells are absolutely required for moving cerebral spinal fluid about the brain. [3] Myosin hydrolysis of ATP is required for such movement. ATP is most efficiently produced by the electron transport chain of the the mitochondria. In Alzheimer’s disease, a decrease in expression of complex IV genes COX6A1, COX6C, COX11, SOD1, ATOX1, COX5B, COX6B1, and COX7B has been observed. [4] A decrease in transcripts for Cu/Zn super oxide dismutase 1 and copper chaperone Atox1 were also observed. [4]
A prelude to the Andreozzi (2020) 64Cu neuro imaging study. [1] who found Cu2+ deposition in the ventricles. The choroid plexus is a specialized component of ventricles with ciliated ependymal cells. These cilia contain actin, myosin, and many actin cross-linking proteins. Non muscle myosin can move these actin bundles in the cilia by hydrolyzing ATP.
If we do not have enough proper copper in our diets, we could hypothetically not have enough to ATP to fuel the intense ventricular circulation dynamics reviewed in reference [3]. In this model we are proposing, not enough of the good copper Cu+ can lead to accumulation of the bad Cu2+ before it has a chance to be reduced to the good Cu+. With that introductory prelude, let us examine a PET imaging study of Cu2+ acetate in a mouse model.
Brain imaging of 64Cu
1. Like Cu2+ from pipes and cell membrane permeable Cu+/2+
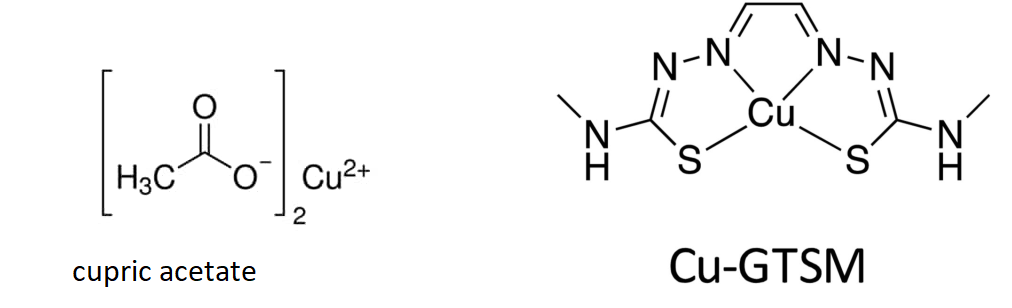
The goal was to directly inject two forms of Cu(II) into the blood: one in a GTSM chelate that can cross the blood brain barrier and one that might resemble a dietary supplement. [1]
Cu-GTSM is sufficiently lipophilic to penetrate the blood-brain barrier22,23 and cell membranes, but has a relatively high Cu(II/I) redox potential which facilitates extremely rapid intracellular bioreduction and dissociation to release copper within cells,
The authors are trying to load the mice with two types of copper. (1) copper pipes copper and (2) copper in the mostly proper oxidation state with a lipophilic carrier that can cross the blood brain barrier.
2. Cu2+ exit from blood
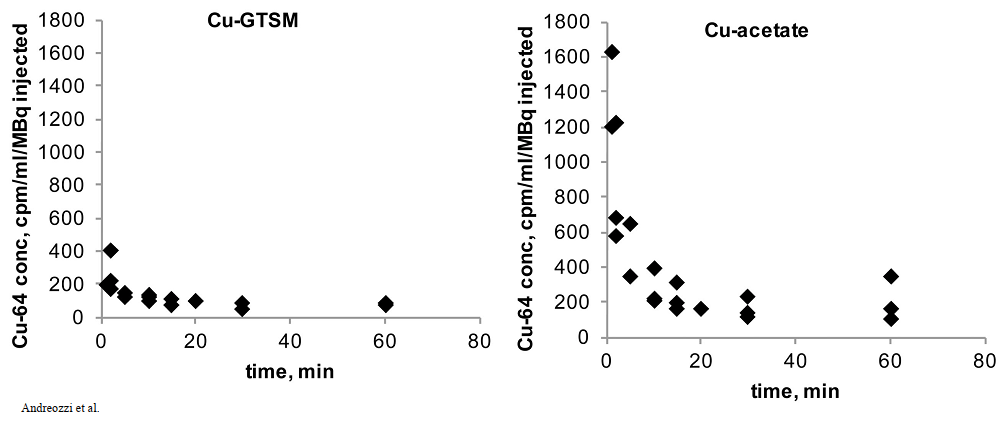
Both copper compounds were IV injected in the tail veins as opposed to feeding. Radioactivity was measured over the course of 60 minutes. The radioactivity in the blood was expressed in terms of the ratio of counts per minute (cpm) to the MBq injected. (n = 3 ) 1 Bq = 1 decay per second. Initial clearance of Cu-GTSM is very rapid with half life < 1 min, whereas Cu-acetate had a slower initial clearance half life of 2-3 min. [1]
Figure 1 from Andreozzi (2020) [1]
The cupric acetate seems to be higher in the blood. Was this due to slower deposition into disposition into tissues or quicker excretion in feces and urine for the GTSM-Cu? This is addressed in Figure 3 at 30 minutes. Note the increased signal from the intestines and kidney.
3. Improper copper gets peed out?
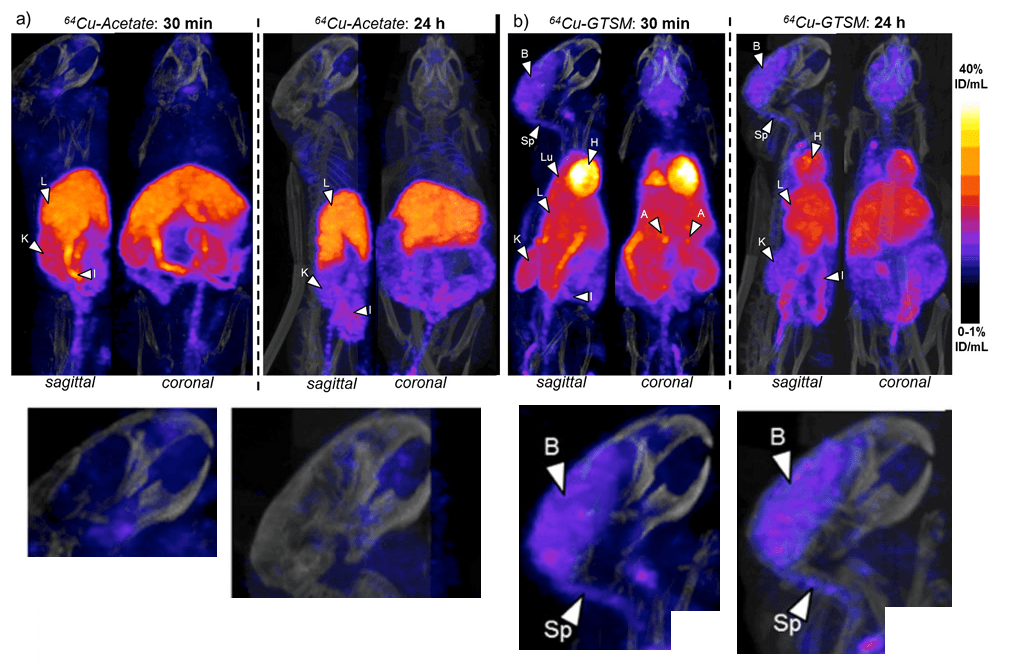
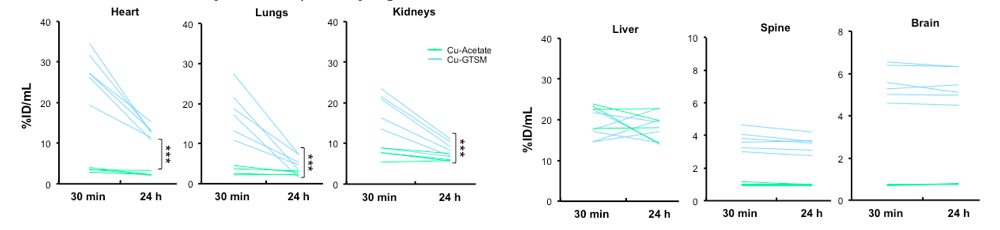
These are the wildtype C57BL/6J mice after injection with the two forms of 64Cu. Both forms are rapidly taken up by the liver, intestines, and kidneys. Is the presence in the liver and kidneys evidence of being excreted? The GTSM chelate is also taken up into the brain, heart, lungs, and adrenal glands. The color scale is linear, covering the range 0-1 %ID/mL (min) to 40 %ID/mL (max).
Figure 3 Andreozzi 2020 [1] The brain images have been enlarged.
Some enlarged views of sagittal brain sections are shown. The brain (B) and spinal cord(Sp) rapidly accumulate 64Cu from the chelate.
The heat, lung, and brain are the biggest difference between the cupric acetate and GTSM, that tends towards the Cu(I) oxidation state. The brain seems to unload the accumulated Cu from 30 minutes to Why the difference between the brain and heart at 24 hours (p<0.001) at 24 hours is so important was not really elucidated. The 30 minute accumulation at 30 minutes is lost by 24 hours. Not so in the brain.
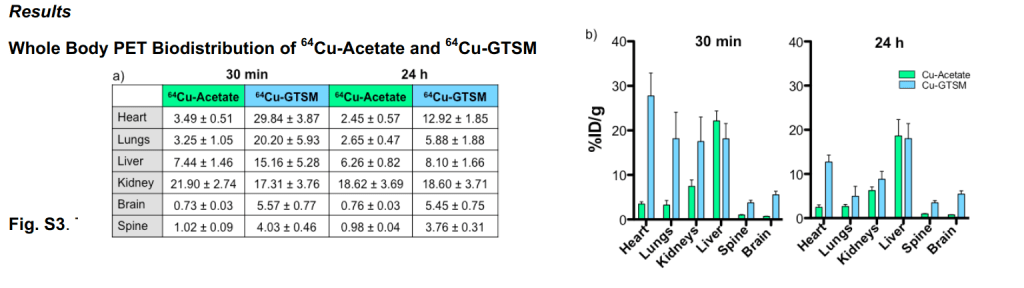
Supplemental Fig 3, These mice are 6-8 months old wildtype mice, relatively young. Data are mean ± SD. 64Cuacetate (n=4); 64Cu-GTSM(n=6+
With the unnaturalGTSM Cu(I) chelate, the Cu peaks and then drops dramatically in most organs other than the brain, spine, and kidney over the course of 24 hours.
4. Copper getting stuck in the brain and spine
The supplemental data included individual mouse data from 30 minutes and 24 hours. These again are youngish 6-8 month old wild type mice.
values are expressed as % of the initial dose green , Cu-acetate, blue, Cu-GTSM, *** p<0.001
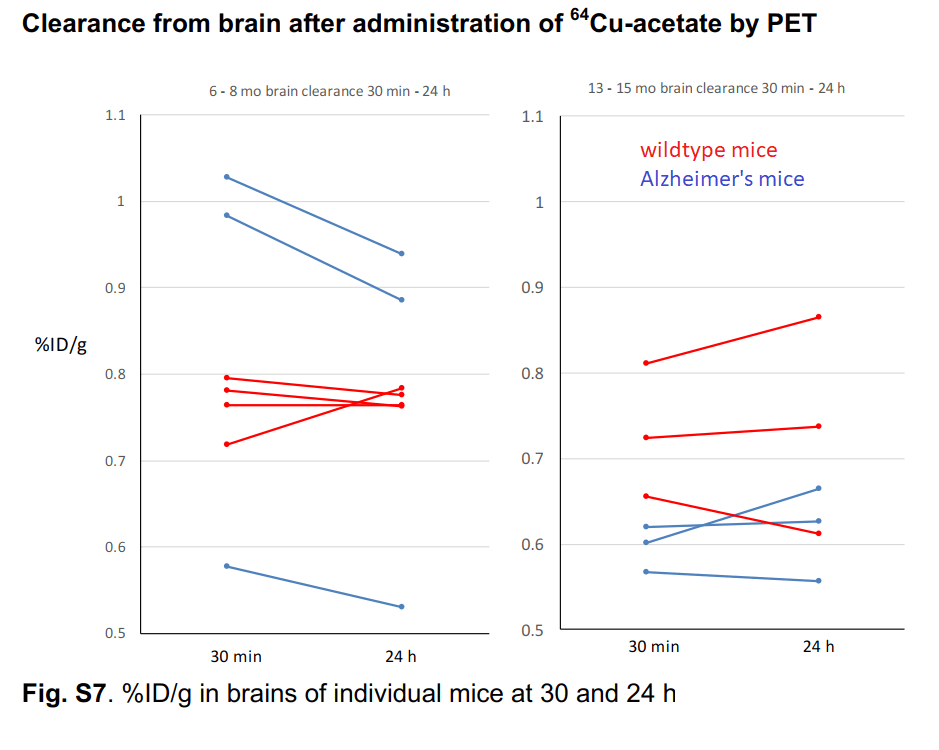
The authors took a closer look at Cu2+ acetate in 6-8 month old mice and some very old 13-15 month old mice. [1] While they only looked at three very old wild type mice, one individual had a slight increase in brain Cu over 24 hours. We can make no statistical conclusions from such a small group. This is sort of what Dr Brewer was saying that Cu2+ might just accumulate very slowly in small amounts as we age. Note also that there is greater population variation in the older versus younger group of wildtype mice.
Individual mouse data from supplemental figure 7 for copper acetate [1]
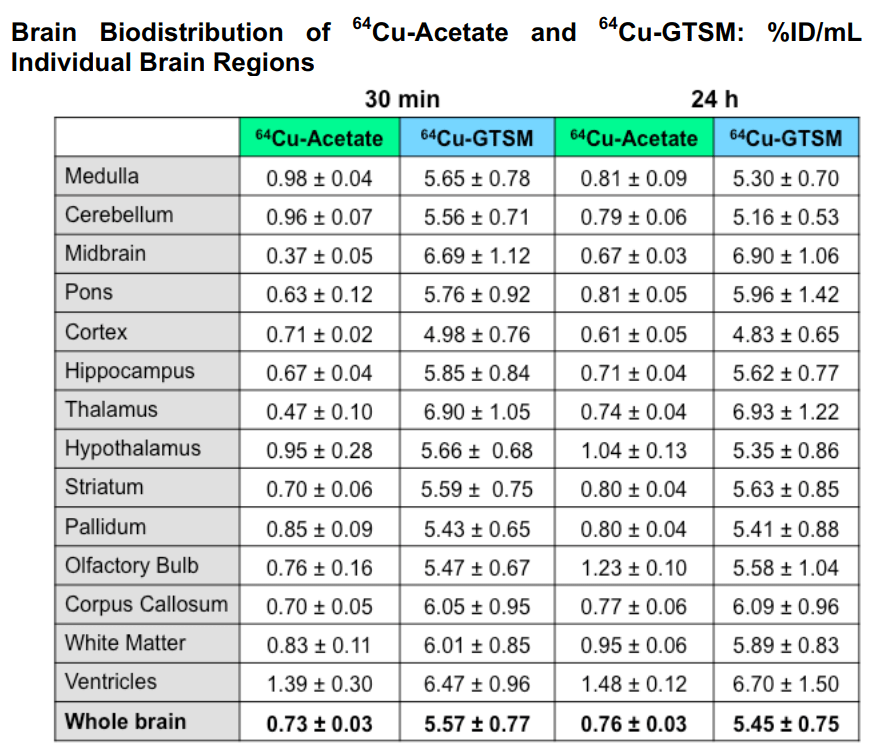
This table breaks down the 64Cu content by brain region
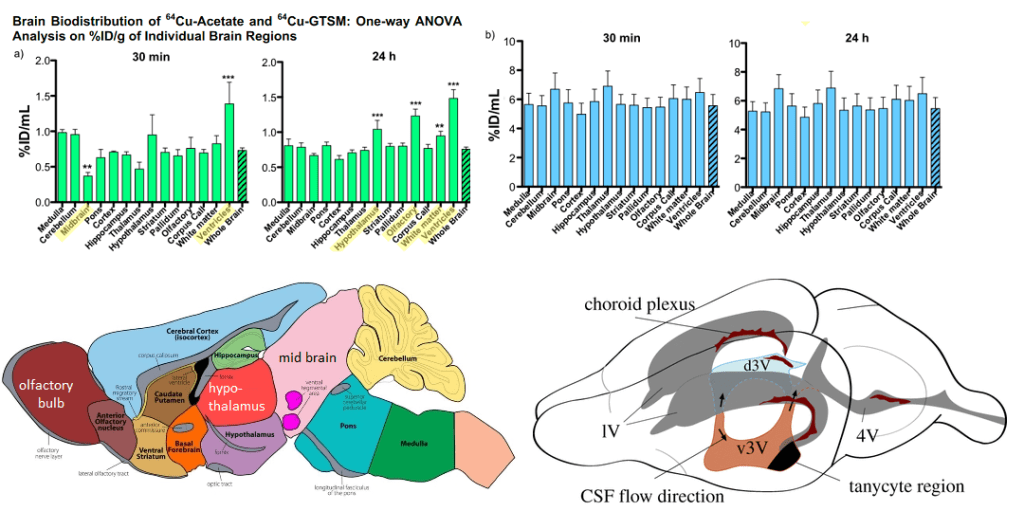
Eichelle (2019) [3] was the source of the rodent brain ventricle system. Note that the d3 ventricle and choroid plexis line up with regions in which Cu content is increased with Cu2+. The choroid plexis produces cerebral spinal fluid and serves as a barrier between the blood and the cerebral spinal fluid in the ventricles
“Fig. S5. (a) Left: One-way ANOVA analyses of %ID/g (including Dunnett’s multiple comparison post-hoc tests) confirm significantly lower %ID/g in the midbrain vs. whole brain (p-value <0.01, F=13.39) and significantly higher%ID/g in the ventricles vs. whole brain (p-value <0.001, F=13.39) for 64 Cu acetate at 30 min; Right: the same analysis at 24 h, showing significantly higher %ID/g in the hypothalamus (p-value <0.0001, F=41.29), olfactory bulb(p-value <0.0001, F=41.29), white matter (p-value <0.001, F=41.29), and ventricles (p-value <0.0001, F=41.29) vs. whole brain at 24 h. Data are mean(n=4) ± SD, with %ID/g resulting from the InviCRO brain atlas applied to the PET datasets. (b) A one-way ANOVA with Dunnett’s multiple comparisonpost-hoc tests for 64 Cu-GTSM confirms no differences of %ID/g in any of the individual brain regions compared to whole brain. Data are mean (n=6)±SD,with %ID/g resulting from the InviCRO brain atlas applied to the PET datasets.One-way ANOVA analyses of %ID/mL (including Dunnett’s multiple comparison post-hoc tests) confirm significantly lower %ID/mL in the midbrain vs. whole brain (p-value <0.01, F=13.39) and significantly higher %ID/g in the ventricles vs. whole brain (p-value <0.001, F=13.39) for 64 Cu-acetate at 30 min; the same analysis and significantly higher %ID/g in the hypothalamus (“
And there was really not a great deal of difference in the Alzheimer’s Disease model
Figure 7 Andreozzi 2020 [1]
TASTPMouse
This Adreozzi study [1] also used what is known as a TASTPM mouse model of human Alzheimer’s Disease. [1] This particular mouse like carries two different sets of mutations linked to early onset Alzheimer’s Disease in humans.
The “Swedish†mutation in the APP gene is two mutations K595A and M596L that increases cleavage by β-secretases
An M146V substitution in the presenilin gene. According to alzforum.org, this mutation impaired γ-cleavage carboxypeptidase like activity but spared the endopeptidase ε-cleavage. This results in increased Aβ1-42 compared to Aβ1-42
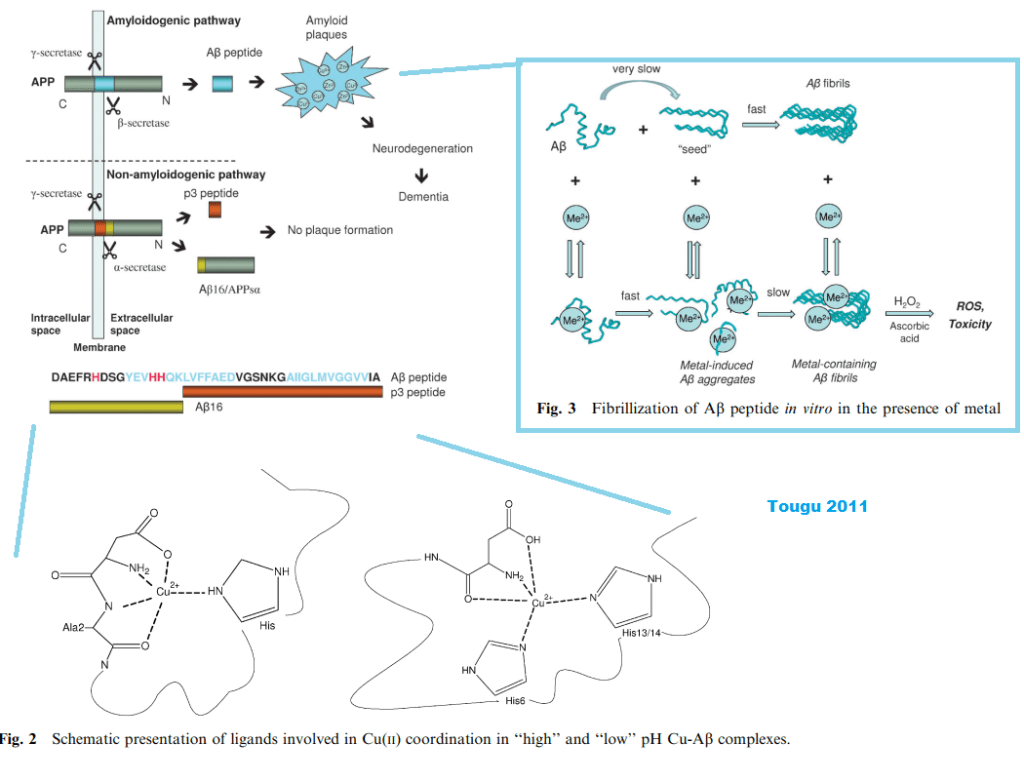
The Tougu (2011) kinetic study [2] offered some insight into the role of divalent metal ions in promoting the aggregation of the Aβ peptides and the histidines therein. Their figure 1 puts into context the role of secretases and the differences between proteolytic cleavage products. Figure 2 has the metal binding histidines in bold red letting us know that the proteases really make a difference. [2] Figure 3 shows the different pathways to aggregates that generate reactive oxygen species in the presence of ascorbate and the H2O2 that seems to be the byproduct of incomplete reduction of O2 by the mitochondria.
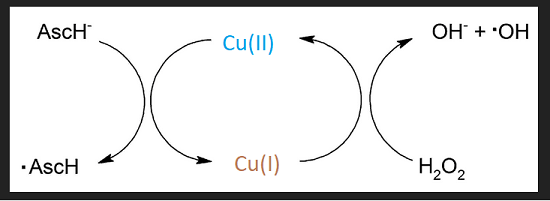
There have been other reports claiming Cu2+ detection by one means or another. [3-5] The Tougu Figure 3 reminds us that Cu2+ and Cu+ redox cycle with ascorbate and H2O2 to produce hydroxyl radicals.
Expansion of Fenton chemistry eluded to in Tougu (2011) Figure 3.
In Alzheimer’s Disease, there is a decrease in the transcripts for many of the subunits of the copper cofactor mitochondrial complex IV. Transcripts for Cu/Zn SOD1 and the copper bound transcription factor and chaperone Atox1 are also decreased. These changes are accompanied by a decrease in Cu, a decrease in cytochrome C oxidase activity, and of course a decrease in ATP production. [6]
Going forward..
The GTSM mostly Cu+ is unnatural by nature of its cell permeability and therefore not of interest to us.
Can we detect impaired mitochondrial function in the aging brain?
Does Cu(I)NA2 improve CSF circulation within the brain?
Is Cu2+ less likely to form aggregates withAβ if CSF is moving freely and not stagnating?
The Andreozzi study was performed over only 24 hours. What about dietary Cu2+ over the course of several decards?
References
Andreozzi, E. M., Torres, J. B., Sunassee, K., Dunn, J., Walker-Samuel, S., Szanda, I., & Blower, P. J. (2017). Studies of copper trafficking in a mouse model of Alzheimer’s disease by positron emission tomography: comparison of 64Cu acetate and 64CuGTSM. PMC free article
C, Ghandour MS, Paulin D, Assenmacher I, Tixier-Vidal A. Characterization of ependymal cells in hypothalamic and choroidal primary cultures. Neuroscience. 1988 Mar;24(3):993-1007
Eichele, G., Bodenschatz, E., Ditte, Z., Günther, A. K., Kapoor, S., Wang, Y., & Westendorf, C. (2020). Cilia-driven flows in the brain third ventricle. Philosophical transactions of the Royal Society of London. Series B, Biological sciences, 375(1792), 20190154. PMC free article
Myhre, O., Utkilen, H., Duale, N., Brunborg, G., & Hofer, T. (2013). Metal dyshomeostasis and inflammation in Alzheimer’s and Parkinson’s diseases: possible impact of environmental exposures. Oxidative medicine and cellular longevity, 2013, 726954. PMC free article
Tõugu V, Tiiman A, Palumaa P. (2011)Interactions of Zn(II) and Cu(II) ions with Alzheimer’s amyloid-beta peptide. Metal ion binding, contribution to fibrillization and toxicity. Metallomics. 2011 Mar;3(3):250-61. free article
It was common for patients hospitalized to develop encephalitis, an inflammation of the brain. It makes sense that these patients would develop long term neurological symptoms of what is now being called post acute sequelae of Covid-19. (PASC) Some Covid-19 patients who were never hospitalized, and who only experienced mild symptoms, have gone on to develop nuero-PASC as well.
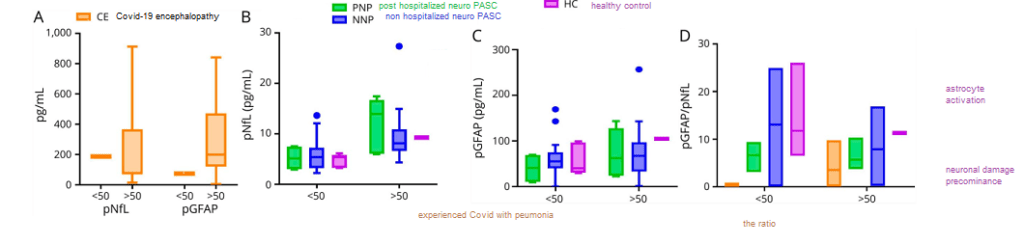
Methods A multi-center group of investigators recruited hospitalized, post hospitalized, and non-hospitalized patients with confirmed diagnosis of COVID-19 with neurologic symptoms in addition to healthy control (HC) subjects. Their blood plasma was assayed for three proteins
neurofilament light chain (pNfL), a marker for injured neurons
plasma glial fibrillary acidic protein (pGFAP), a marker for astrocytes, nurse cells of neurons
SARS-CoV-2 Nucleocapsid antigen (pN Ag)
Neurofilament (neurons), GFAP (astrocytes), and the ratio
This figure looks at two proteins from dead brain cells in the blood. Naturally there are more of these brain cell proteins in older individuals than in the young. When the ratio of GFAP to neurofilament is high, the pathology is more on the astrocyte side of things.
Figure 1 from Hanson 2020 [1]
These data indicate the noise due to the age of the patient that will contribute to any serum protein or the ratio thereof.
A Covid protein in the blood three weeks after the first sign of symptoms
Figure 2 and Table 2 from Hanson 2020 [1]
Age notwithstanding, the Covid-19 nucleocapsid was only seen in one of the PASC patients, and that patient was was never hospitalized. The really perplexing thing about these data is (1) the percentage of neuro-PASC patients that experienced most of the symptoms and (2) when there was a difference between the post hospitalized and never hospitalized patients, the never hospitalized patients fared the worse.
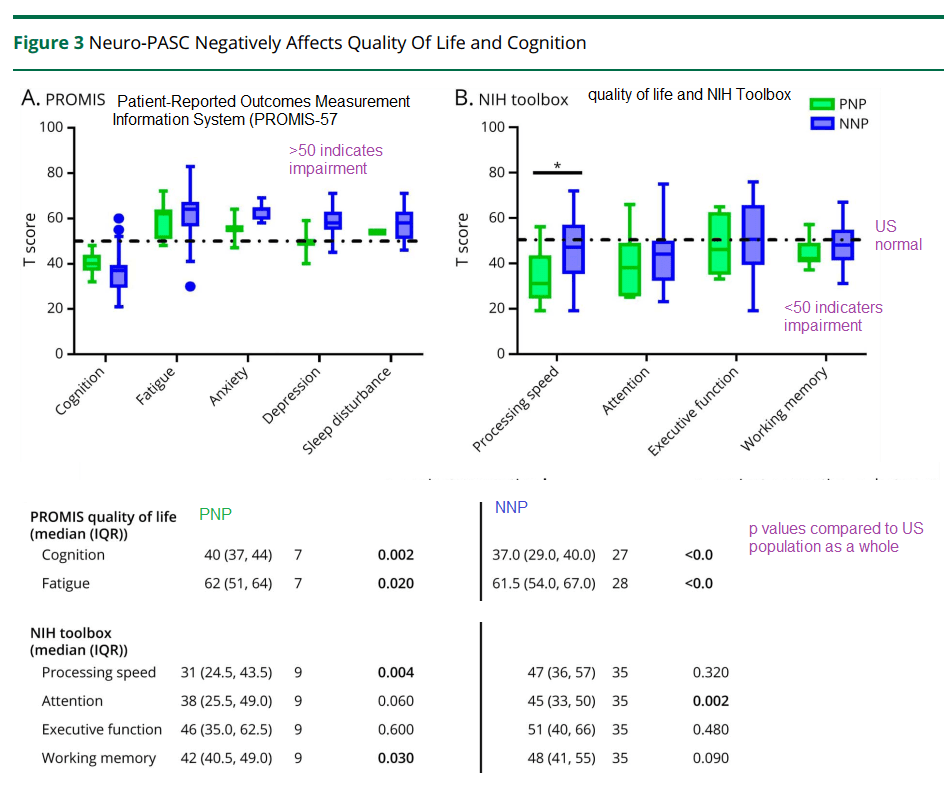
Neurological tests three weeks later
The patients were given these tests three weeks after the onset of acute Covid-19 symptoms. They are still impaired compared to the US average. This post is not getting into the analysis controls used to guarantee the integrity of the data.
Hanson and coworkers also performed some regression analysis of depression and anxiety symptoms as a function of the ratio of GFAP to neurofilament…
When stratified by age, those patients with depression/anxiety were more likely to have a high GFAP/neurofilament ratio. This was true for both those over 50 years old and those less than 50 years old. (p<0.05)
A positive correlation was seen in the Promis T score for anxiety as a function of the GFAP/neurofilament immuno reactivity in the plasma. (p=0.03) R2 was only 0.041.
There was no correlation between the Promis T score for depression and the plasma immuno reactivity GFAP/neurofilament ratio.
The amazing thing in this study is how many patients are compromised three weeks after the initial onset of Covid-19 symptoms. The hints of astrocyte dysfunction are in keeping with the Goetzl findings described in another post.
A yet to be peer reviewed study from Brazil:
A Brazilian group has demonstrated the presentation of the SARS-Cov2 virus in astrocytes in the brains of deceased Covid-19 patients. They further demonstrated the ability of SARS-Cov2 to infect astrocytes using NRP1 as an alternative receptor to ACE2. [1] The Brazilians produced astrocytes from neuronal stem cells, infected them with SARS-CoV2, and used mass spectrometry to measure the levels of key neurotransmitters,
Figure 7 Sea Horse and related metabolic data
High resolution mass spectrometry was used to compute the violin plots shown of the end product of terminal glycolysis, lactate, and the intermediate before entry into the TCA cycle, pyruvate. TCA cycle intermediates were not different between mock and CoV2 infected astrocytes. (Figure 10 supp, not shown)
Cellular respiration of mock and CoV2 infected astrocytes was measured in a Sea Horse respirometer. Basal respiration, ATP production, and the reserve capacity were not significantly different in the infected astrocytes compared to the mock infected astrocytes. The proton leak, maximum respiration, and non-mitochondrial oxygen consumption were, however, greater in the CoV2 infected astrocytes. We’ve discussed Covid proteins binding to Complex I proteins in a previous post. Complex I might be the source of non (normal) mitochondrial oxygen consumption the Brazilians referred to.
In summary..
These data support astrocyte involvement in Long Coivd/ PASC. How do we address this in a clinical trial? Do monocytes and CD8+ cytotoxic T cells migrate into the brain?
References
Hanson, B. A., Visvabharathy, L., Ali, S. T., Kang, A. K., Patel, T. R., Clark, J. R., Lim, P. H., Orban, Z. S., Hwang, S. S., Mattoon, D., Batra, A., Liotta, E. M., & Koralnik, I. J. (2022). Plasma Biomarkers of Neuropathogenesis in Hospitalized Patients With COVID-19 and Those With Postacute Sequelae of SARS-CoV-2 Infection. Neurology(R) neuroimmunology & neuroinflammation, 9(3), e1151. PMC free article
Mitochondria may be found outside the cell in four ways:
as cell free mitochondrial DNA in the plasma
encased in platelets
in exosome membranes
totally free
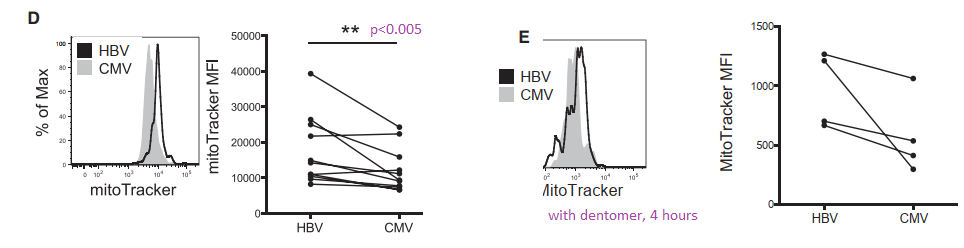
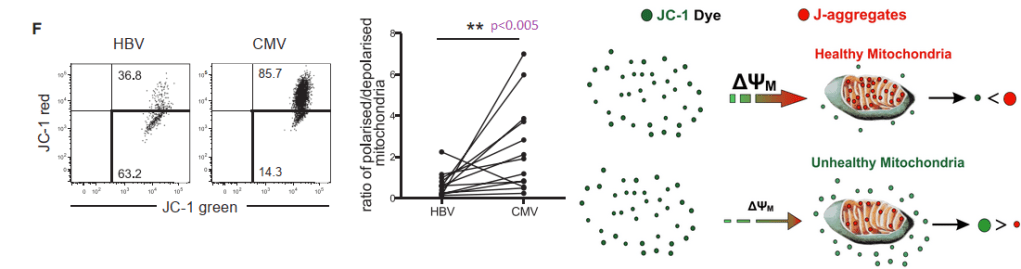
The authors of this review discuss the use of mitochondria isolated from the cerebral spinal fluid from sub arachnoid hemorrhage patients. [1] The mitochondria membrane potential indicator dye JCI was used to assess the health of released mitochondria. The origin of the mitochondria was determined by use of surface specific antigens in the flow cytometry system. [1] Mitochondria, in vesicles or not, may be taken up by new host cells. The Miliotis review discussed use of cell free mitochondria as a therapy. [1]
Exosomes and oxidative stress
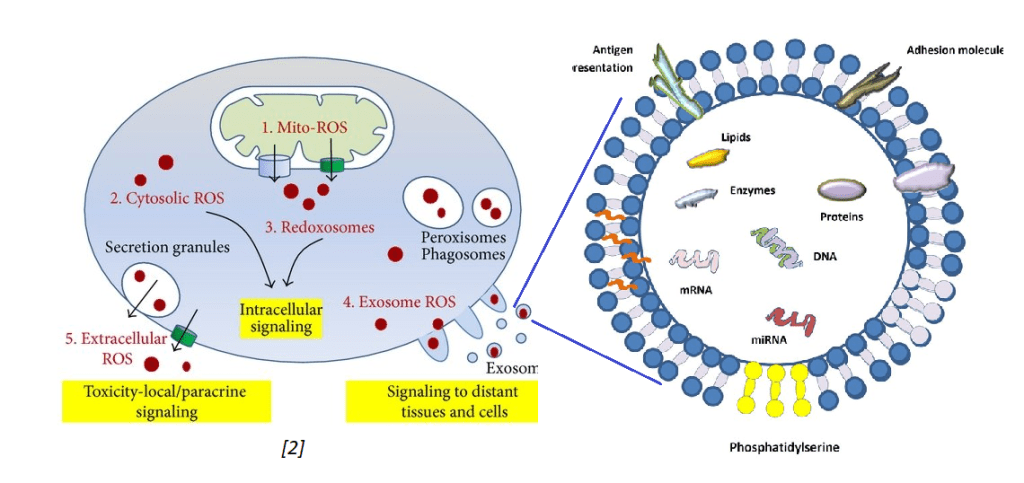
Tefani and coworkers (2016) published an excellent review on oxidative stress that touched briefly on mitochondria debris being exported into exosomes. [2] In their review of the literature, these authors stated that healthy cells do not secrete many exosomes. Stressed cells do. They also discussed exosomes containing reactive oxygen species such the super oxide anion.
The image on the left was extracted from the Tefani review. [2]
The other image just states that exosomes may contain messenger RNA (mRNA), micro RNA (miRNA), DNA, lipids, proteins, and presumably active protein enzymes. Exosomes contain protein antigens on their cell surface that my be used to identify their cell of origin. Exosomes are not only secreted by one cell type but may be absorbed by different cell types via antigen presentation and adhesion molecules. This is some background information for presentation of work done by the Goetzl Laboratory.
The Goetzl Lab general protocol
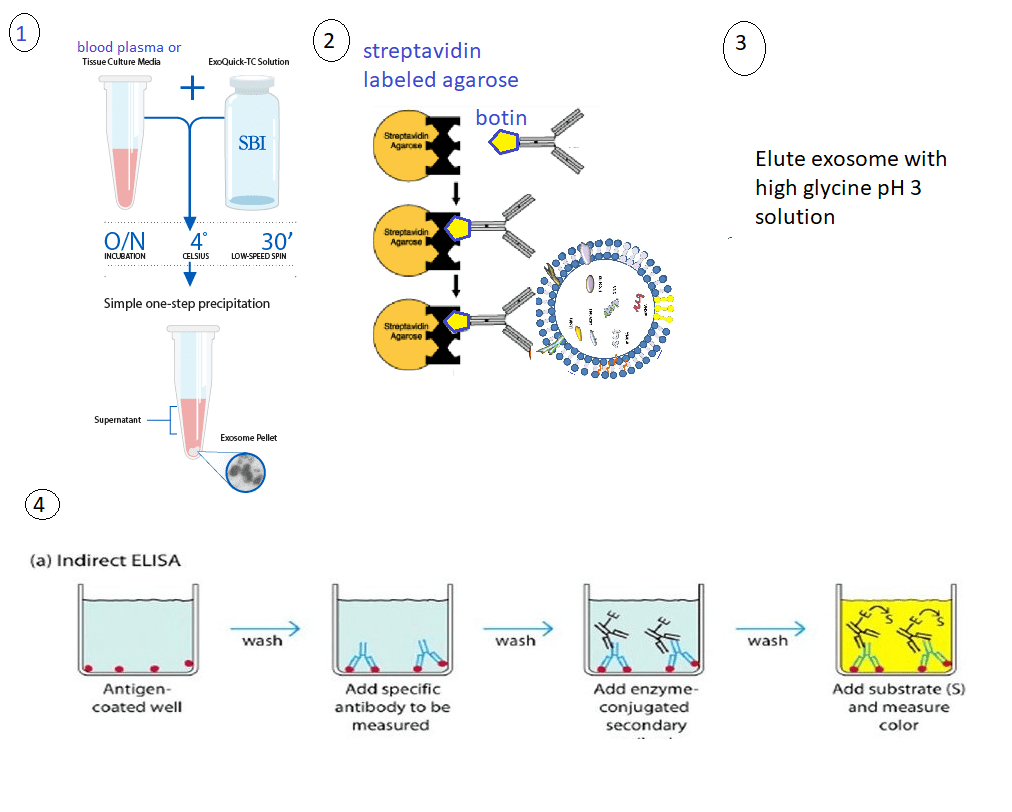
These protocol use only 0.25 mL of blood plasma that is then incubated with 0.1 mL of thromboplastin D for 30 min at room temperature for 30 minutes. A balance salt solution with protease and phosphatase inhibitors is added. The mixture is centrifuged at 3000xg at 4oC for 30 minutes. The supernatant was removed and exosomes precipitated with ExoQuik from System Biosciences. The total population of exosomal vesicles was resuspended in the balanced salt solution. Neuron or astrocyte specific antibodies were added. The primary antibodies may be conjugated with biotin. Biotin binds to streptavidin with extremely high affinity. The antibody labeled exosomes can be removed from the mix with streptavidin agarose beads. The eluted material was transferred to a tube containing 10% BSA and 1M Tris pH 8 to get the pH closer to physiological.
The general protocol 1. Exosomes are removed from blood plasma using a commercial kit. The pellet contains the exosomes. 2. Exosomes are reuspended in a solution. They can be sorted by tissue of origin by use of antibodies against surface proteins specific to that cell type. 3. The exsomes are eluted from the antibodies by use of a glycine solution. 4. Enzyme linked immuno sorbentassays
ELISAs were used for quantitation.
1. neuron or astrocyte derived exosomes in psychosis [3]
Goetzl and coworkers were tracking mitochondrial proteins in exosomes in major depression disorder patients at the baseline and after treatment with SSRI. This study is of interest to Mitosynergy because some of the customers take cuprous nicotinic acid for depression. This particular study was using SSRIs to treat some sort of self diagnosed depression. This particular study compared baseline values of responders and non-responders (NR) with the mitochondrial markers after treatment. (TR)
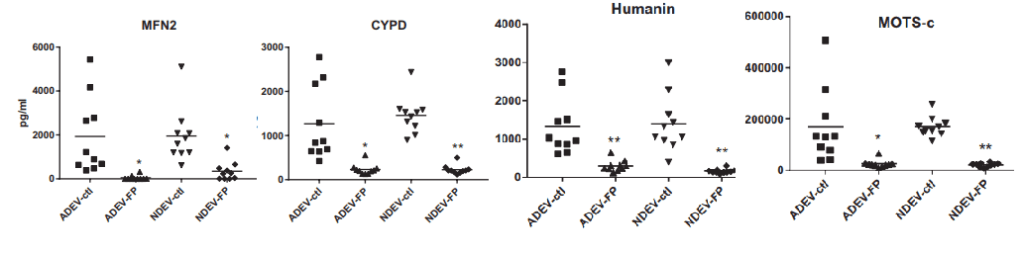
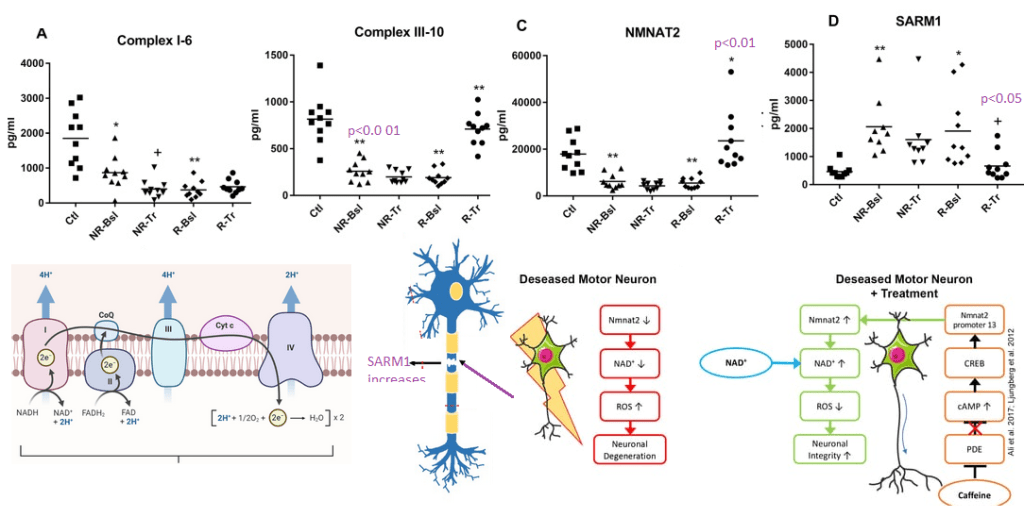
These are some highlights from Goetzl (2021) Figures 1. [3] Not shown are TFAM, MYO6, and LETM1
Mitofusin 2 (MFN2) Involved in the clearance of damaged mitochondria via selective autophagy (mitophagy) (PubMed:23620051). Is required for PRKN recruitment to dysfunctional mitochondria (PubMed:23620051).
Cyclophilin D (CYPD)has multiple functions in ghe mitochondria. Perhaps most notable is regulation of the mitochondrial transition permeability pore with its binding partner VDAC, the voltage dependent anion channel.
Humanin is a 24 amino acid mitochondrial genome coded peptide. It prevents the formation of Abeta 42 amyloid products. Human also protects neurons from diverse challenges, suppresses apoptosis, preserves synaptic proteins, reduces neuroinflammation and regulates aspects of glucose metabolism.
MOTS-c In response to metabolic stress, translocates to the nucleus where it binds to antioxidant response elements (ARE) present in the promoter regions of a number of genes and plays a role in regulating nuclear gene expression in an NFE2L2-dependent manner and increasing cellular resistance to metabolic stress (PubMed:29983246). Increases mitochondrial respiration and levels of CPT1A and cytokines IL1B, IL6, IL8, IL10 and TNF in senescent cells
The nicotinic acid two thirds of Cu(I)NA2
The Goetzl group may have chosen these proteins as specific electron transport chain proteins. They are of particular interest to mitosynergy because they involve the nicotinic acid derivative NADH.
Figure 2 from Goetzl (2021) [3] with some images from the Internet to illustrate the potential role of nicotinic acid as a precursor of NAD+.
NDUV1 6th unit of complex I ubiquinone + 5 H+(in) + NADH = ubiquinol + 4 H+(out) + NAD+
UQCR11 10th sub unit of complex III
NAD+ hydrolase SARM1 acts as a negative regulator of MYD88- and TRIF-dependent toll-like receptor signaling pathway by promoting Wallerian degeneration, an injury-induced form of programmed subcellular death which involves degeneration of an axon distal to the injury site.
2. In Alzheimer’s disease [4]
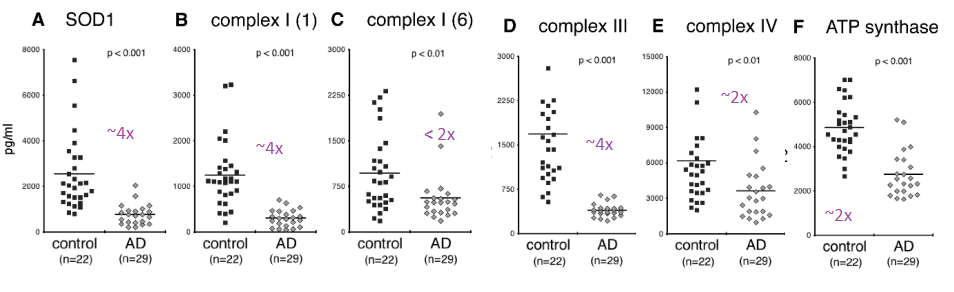
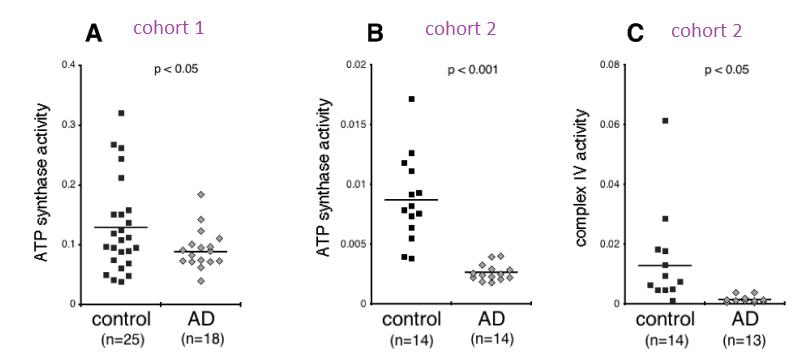
Complex IV was immunocaptured and assayed for its ability to reduce cytochrome C using a commercial kit. What is reported in this publication as ATP synthase activity is really Complex V operating in reverse as an ATPase.
From Yao figure 2 [4]
Figure 2 of the Yao (2021) is a bit perplexing. A n approximately 4x reduction in subunit 1 of complex I was seen in the Alzheimer’s group compared to the controls. There was an only 2x fold reduction of subunit 6 of complex I in the Alzheimer’s groups. Complex IV and V were observed to be about 50% less in the Alzheimer’s group compared to the control group. One possibility is that sub unit 1 of complex I is selectively damaged in AD. The authors did not mention if they detected the mitochondrial super oxide dismutase Mn SOD2.
Two different cohorts were used for the ATPase assay. The activity in the Alzheimer’s patients was less than half than the controls in the first cohort and 3-4x less In the second cohort. Very little cytochrome C reductase activity was detected in the exosomes of Alzheimers’ patients in the second cohort. The complex IV activity was undetectable in the Alzheimer’s patients even though protein was detected. The Cu/Zn SOD1 activity was not assayed for in this study. Both Cu/Zn SOD1 and complex IV use copper as a cofactor. It would be interesting to measure the copper content of these exosomes. Being from Alzheimer’s patients, we’d need to know if copper is complexed to proper enzymes or to amyloids.
3. In neuropsychiatric PASC [5]
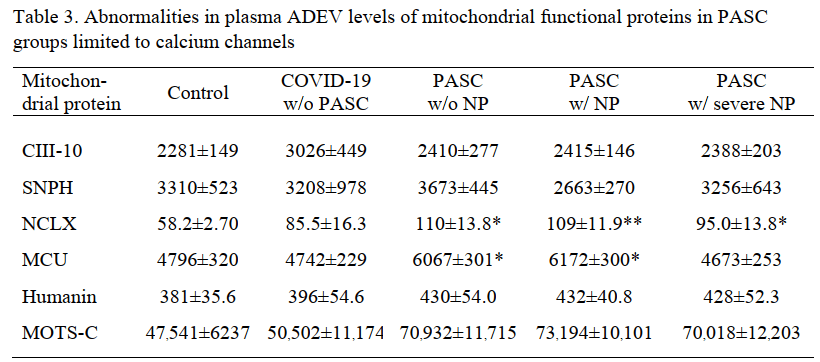
The Goetzl group published a study comparing patients with PASC with and without neuro psychiatric (NP) symptoms. Protein levels, but not enzyme activities, were published in this study. The truly incredible finding in this study was the presence of the Covid S1 spike protein receptor binding domain (RBD) and the nucleocapsid proteins.
N = nucleocapsid protein, NP = neuropsychiatric manifestations, RBD = receptor-binding domain, w/=with, w/o= without. Each value is the mean pg/ml±SEM. Statistical significance of differences between each value and the control value were determined by an unpaired Student’s t test: †, p<0.05; **, p<0.001.
The S1 spike protein immuno reactivity was about 3x greater in the asymptomatic former Covid patients compared to those that never had Covid. Some background is to be expected in any immuno detection assay. With the prospect of PASC having an autoimmune aspect needs to be considered in this system. The S1 spike protein was increased in even asymptomatic former Covid patients in both the neuronal and the astrocyte derived exosomes. The same spike protein was almost doubled in PASC patients with or without neuropsychiatric (NP) symptoms.
The nucleocapsid protein (N) immunoreactivity was significantly greater in NDEV in asymptomatic former Covid patients compared to those that never had Covid, the difference was less than 2x. In the astrocyte derived ADEV , nucleocapsid immunoreactivity became a predictor of neuropsychiatric symptoms.
The significant changes in host mitochondrial proteins were seen in the astrocyte derived exosomes.
The mitochondrial Na+/Ca2+ exchanger was the only protein that was increased even 2x.
Cool implications for Mitosynergy
The Goetzyl assay has a certain amount of simplistic beauty. Two unanswered questions are how these exosomes get past the blood brain barrier and whether FDA would accept this assay as a marker of efficacy. The latter may not be that important.
The MDD study that piggy backed on a clinical trial of effective and non effective SSRI was most interesting in that many of the enzymes analyzed had something to do with NAD+ pathways. Is some sort of Wallerian degeneration or other neurotoxicity associated with the etiology of major depression disease? Note: Mitosynergy and Charlie Barker’s patented improvement on cuprous nicotinic acid originated from his trip to Egypt for a treatment for his nephew’s spinal cord injury!
The Alzheimer’s Disease was truly incredible in that it examined the activity of complex IV and complex V going in reverse ATPase mode in exosomes. We’d like to see SOD1 activity measured. To the best of my knowledge, Alzheimer’s Disease is not an interest of Mitosynergy. Similar assays in spinal cord injury patients might be.
Mitosynergy is naturally interested in all aspect of Long Covid, now known as PASC. Astrosytes seem to be more effected. Is this due to their role as phagocytic role? Is seeing nucleo capsid protein in astrocyte exosomes a sign that they ore infected and/or that they are cleaning up debris from other infected cells? What markers to we want to see in healthy astrocytes that are doing their job versus reactive astrocytes?
References
Picca, A., Guerra, F., Calvani, R., Coelho-Junior, H. J., Bossola, M., Landi, F., Bernabei, R., Bucci, C., & Marzetti, E. (2020). Generation and Release of Mitochondrial-Derived Vesicles in Health, Aging and Disease. Journal of clinical medicine, 9(5), 1440. free paper PMC free article
Tafani, M., Sansone, L., Limana, F., Arcangeli, T., De Santis, E., Polese, M., Fini, M., & Russo, M. A. (2016). The Interplay of Reactive Oxygen Species, Hypoxia, Inflammation, and Sirtuins in Cancer Initiation and Progression. Oxidative medicine and cellular longevity, 2016, 3907147. PMC free article
Goetzl EJ, Wolkowitz OM, Srihari VH, Reus VI, Goetzl L, Kapogiannis D, Heninger GR, Mellon SH. Abnormal levels of mitochondrial proteins in plasma neuronal extracellular vesicles in major depressive disorder. Mol Psychiatry. 2021 Dec;26(12):7355-7362. PMC free article
Yao PJ, Eren E, Goetzl EJ, Kapogiannis D. (2021) Mitochondrial Electron Transport Chain Protein Abnormalities Detected in Plasma Extracellular Vesicles in Alzheimer’s Disease. Biomedicines. 2021 Oct 31;9(11):1587. doi: 10.3390/biomedicines9111587. PMC free article
Peluso MJ, Deeks SG, Mustapic M, Kapogiannis D, Henrich TJ, Lu S, Goldberg SA, Hoh R, Chen J, Martinez EO, Kelly JD, Martin JN, Goetzl EJ. (2022) SARS-CoV-2 and mitochondrial proteins in neural-derived exosomes of COVID-19. Ann Neurol. 2022 Mar 13 PMC free article
We tend to accept that our cancer risks increase as we age. In introductory remarks on an exciting new landmark paper Li and coauthors were commenting on the fate of poor CD8+ T cells in the center of tumor micro environment (TME). CD8+ cytotoxic T cells are antigen specific recognizing antigens from tumors, virus infected cells, and normal cell. CD8+ is a protein that binds to the constant chain of the MHC1 antigen presenting surface protein. Recognizing normal cells is considered an act of autoimmunity. When exposed to infected/dysfunctional somatic cells, CD8+ T cells release the cytotoxins perforin, granzymes, and granulysin, enzymes that activate the caspase protease cascade eventually leading to programmed cell death. Human Cell Bio. Not only are the T cells constantly exposed to antigen that sets them off, but they are also competing with the tumor for oxygen. [1] Naturally reactive oxygen species are part of the TME. [2] According to Healthline, age is not one of the risk factors for autoimmune diseases. In autoimmunity CD8+ T cells are also constantly exposed to self antigen. [3] It is desirable that they become exhausted and less self- reactive. Both of these featured studies used T cells from mice that are allergic to an egg protein ovalbumin. These dual roles of CD8+ T cells was addressed in a review by Collier and coauthors. [4]. This post will not get into the PD1/PDL1 checkpoint inhibitors that have been discussed elsewhere on this site. We have covered the inner-relationship between NADH/NADPH (derived from niacin) and reduced thiols. This post examines the possibility that cuprous niacin could find the happy middle ground between T cell exhaustion in cancer and viral infections and autoimmunity, both of these may be issues as we age. Perhaps age is not an autoimmune disease risk factor, but surely contributes to the symptoms.
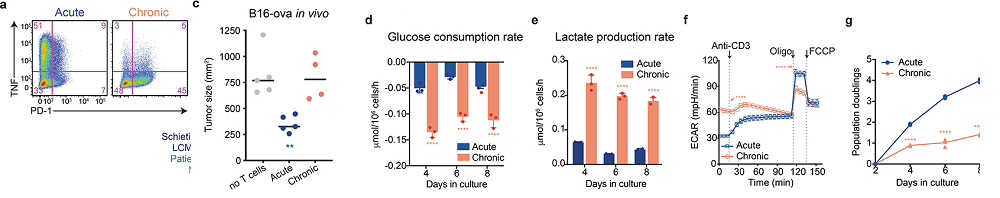
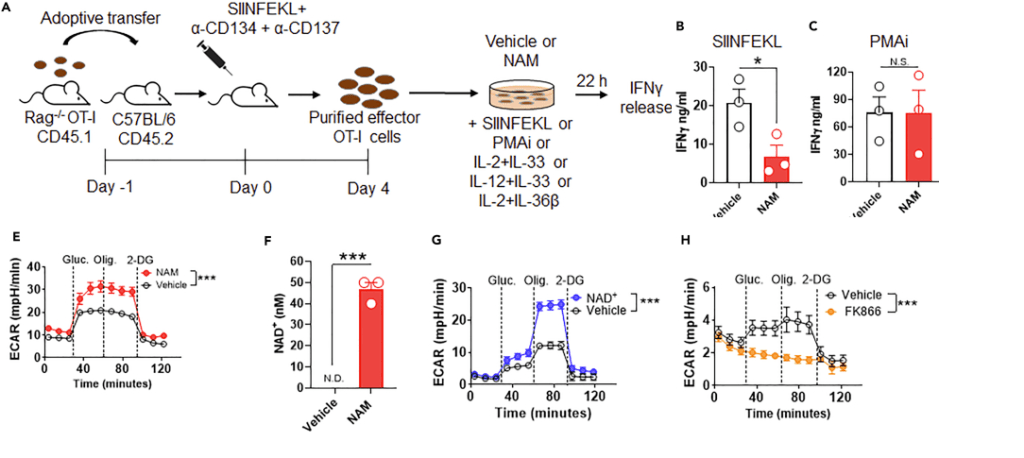
Polyclonal CD8+ T cells, T cells were isolated from the spleen and inguinal lymph nodes of C57BL/6 mice. T cells were also isolated from OT-I mice. These mice contain transgenic inserts for mouse Tcra-V2 and Tcrb-V5 genes. The transgenic T cell receptor was designed to recognize ovalbumin peptide residues 257-264 (OVA257-264) in the context of H2Kb (CD8 co-receptor interaction with MHC class I). The take home is that chronically stimulated T cells, by tumor antigens or ovalbumin, leads to impaired mitochondrial function and more reactive oxygen species generation. Both copper and niacin have the potential to improve this situation.
OT-I transgenic T cells, following 48 h of stimulation were co-cultured with B16-F10 melanoma cells that had been treated with IFN-γ to induce MHC-I expression. Chronically stimulated T cells were treated with mitochondrial electron transport chain complex inhibitors to test the response to oxygen consumption.
This results in MHC class I-restricted, ovalbumin specific, CD8+ T cells (OT-I cells). That is, the CD8 T cells of this mouse primarily recognize OVA257-264 when presented by the MHC I molecule. Cells were cultured in the presence of 1 μM of SIINFEKL peptide, a peptide from ovalbumin. The melanoma cells supplied the MHC class I to present the transgenic T cells with their ovalbumin peptide. Vardhana used B16-F10, B16-OVA, EL4, and A20 meleanoma cell lines. An interesting nuance is that they added 50 μM of the reducing agent β-mercaptoethanol (β-ME).
Figure 1, an increase in glycolysis
In the melanoma cells, 1 ng/mL IFN-γ was to induce MHC-I expression. IL-2, 10 ng/mL, was also added with (chronic) or without (acute) 1 μM SIINFEKL. T cells were passaged into fresh co-cultures every 48 h until eight days following initial stimulation with the peptide.
From Vardhana (2020) figure 1
In Figure 1a we see the same story: The more PD-1 on the cell surface, the less TNF in vesicles. It is the chronically stimulated cells that have the most PD-1. Skipping some flow cytometry data….
Panel d, The chronically stimulated T cells consume much more glucose than the T cells only stimulated once with the ovalbumin peptide. This glucose could be for glycolysis only or glycolysis plus OxPhos.
Panel e shows an increase in lactate production indicating that glucose consumption is probably not going towards OxPhos.
Panel f demonstrates that the extracellular acidification rate (ECAR) is increased when both the chronic and the acute stimulated T cells are stimulated with CD3 antibodies. The acute stimulation cells acidify more in the presence of electron transport chain blockers. And finally,
panel g, the acute stimulation T cells divide almost 4x as fast as those chronically stimulated with the ovalbumin peptide .
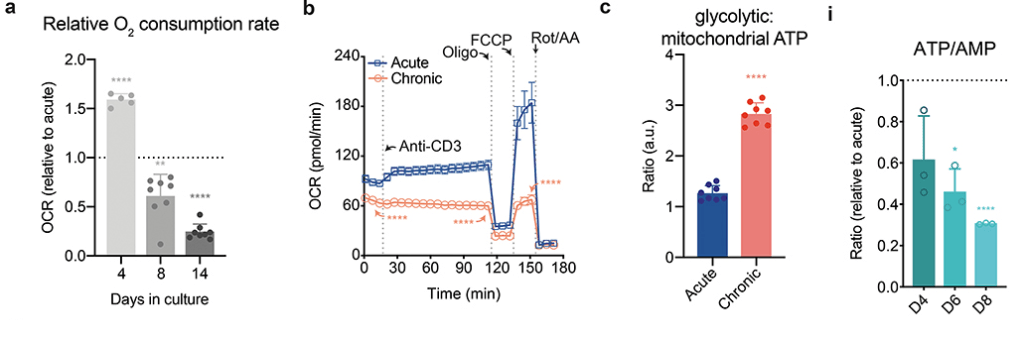
Fig 2 less O2 reduction and ATP production with chronic stimulation
Vardhala also used radioactive glucose to measure TCA cycle activity in these T cells (panels d-f not shown).. Some of the nucleotide ratios are not being shown in this post in effort to keep the narrative simple. It is just impossible to do this public access publication justice in a single post.
select panels from Vardana (2021) figure 2 [2] P values were calculated by unpaired, two-sided Student’s t-test (a-c,e-f) or unpaired, two-sided Student’s t-test test with Benjamini-Hochberg False Discovery Rate (FDR) correction (i). Data are presented as the mean ± s.d. of n=5 (a), n=8 (a,c), n=4 (b), or n=3 i) biologically independent samples from a representative experiment. *P<0.05, **P<0.01, ****P<0.0001. Please see the original publicaton for complete data
They saw a decrease in all intermediates in the TCA cycle. [2] Triphosphate and monophosphate nucleotide ratios were also reduced in the chronic stimulated T cells compared to the one time only acute stimulated cells. [2] Panel i from the chronic model documents that he problem gets worse with time.
Figure 3 mitochondria inhibition and T cell proliferation (not shown)
Cu(I)NA2 is predicted to supply Cu/Zn SOD with the necessary cofactor to mitigate the ROS generation as well as keep the flow of electrons through through the electron transport chain. Both of these should increase the ATP/AMP ratio as well as decrease the NADH/NAD+ ratios.
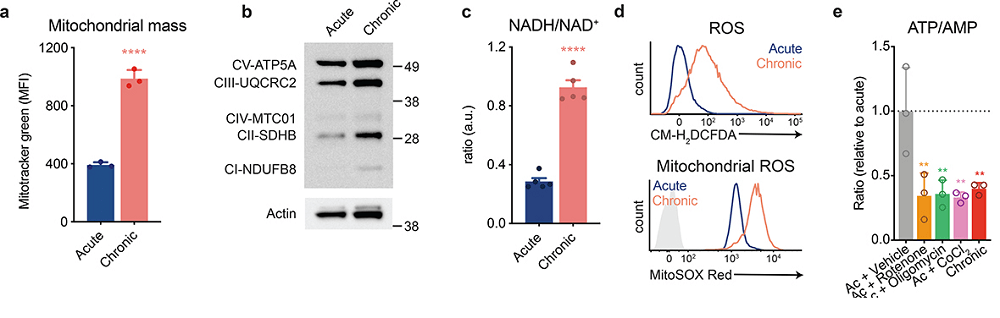
Data are presented as the mean ± s.d. of n=3 (a,e,f) or n=5 (c) biologically independent samples from a representative experiment. **P<0.01, ****P<0.0001 MFI, mean fluorescence units.
Panel a Mitotracker green is simply a fluorescent indicator there to measure mitochondria size irrespective of activity. These mitochondria might be undergoing a vain attempt to expand and keep up with demand.
panel b This is a Western blot. The black bands are proteins. There does not appear to b a huge difference in protein amounts of various complex proteins.
panel c This is something we might want to copy. A smaller NADH/NAD+ ratio in the acute T cells that were not over exposed to peptide suggest better functioning mitochondria.
Panel d examines the total and mitochondrial reactive oxygen species upon stimulation. The gray shaded trace is the unstimulated reference.
Panel e Various inhibitors of electron transport chain complexes were used to mimic he effect of chronic stimulation: complex I (rotenone), complex V (oligomycin),Fe-S cluster containing complexes, cobalt chloride (CoCl2),
reactive oxygen species and reduced thiol supplementation
The rest of the Vardhana publication addressed the issue that the real root of reduced T cell proliferation was due to ROS generation rather than impaired mitochondria activity.
Nicotinamide slowing down CD8+OT-I T cells? [3]
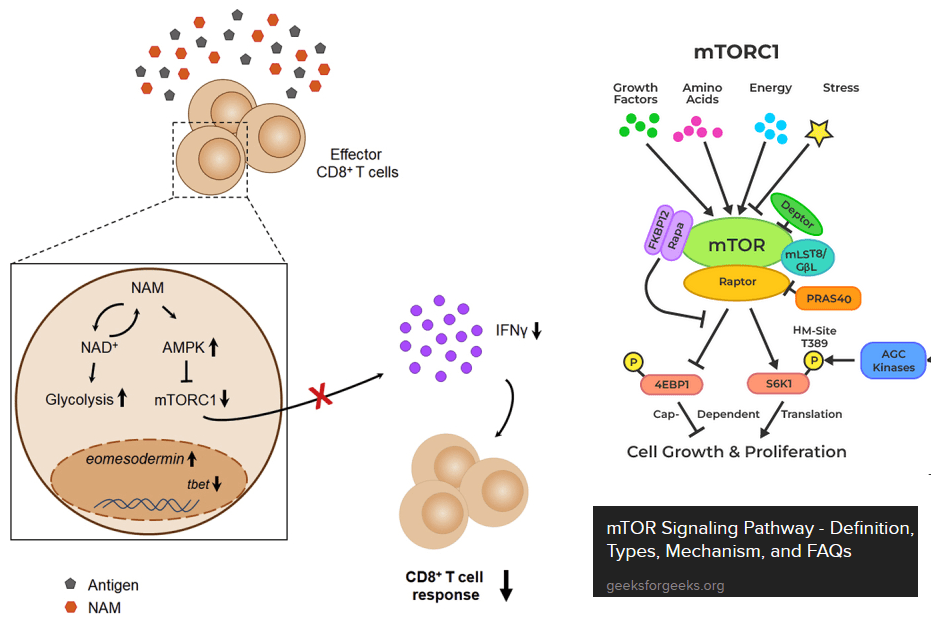
Agliano, Federica et al. “Nicotinamide breaks effector CD8 T cell responses by targeting mTOR signaling [3] graphical abstract and a cartoon of mTOR signaling. AMP kinase (AMPK) is activated when ATP/energy levels are low.
The next paper tests the hypothesis that nicotinamide can shut down over responsive CD8+ T effector cells. [3] Just as a warning, this is the exact opposite of T cell exhaustion. The paper makes use of the OT-I mice genetically engineered to think that the ovalbumin egg protein is a virus. These authors introduced us to the mammalian target of Rapamycin, or mTOR. mTOR integrates all sorts of signals from everywhere and gives the cell permission to start translating mRNAs into proteins. Ribosomal S6 kinase is a target of mTOR. This kinase promotes translation of mRNAs. Note that increases in the ratios of ADP to ATP tend to turn mTOR off and sufficient nutrients tend to turn it on. These authors used the Sea Horse to measure extracellular acidification rate, i.e. glycolysis without the TCA cycle and electron transport chain. [3]
Figures 1 and 2 Turning on cytokine production, or not…
Naïve CD3+, CD4+, CD8+ T cells from spleen and lymph nodes from C57BL/6J mice were purified and differentiated using a commercial kit with added 30 mM or 10 mM NAM or the solution used to dissolve the NAM. Final activation was with CD3/CD28 or PMA + ionomicyn (PMAi), a combo used to stimulate T cell activation, proliferation, and cytokine production. The authors saw differences in cytokine production, but by their own admission, used an surrealistically high concentration of NAM in their cell culture experiments. [3] Not getting into the specifics, the reason has to do with mTOR.
Figure 3 Some Sea Horse experiments
Let us continue with the Agliano [3] publication, which also used T cells from OT-I mice. Recall that these cells were engineered to react with the ovalbumin peptide provided that it is presented via MHC1 surface proteins.
Panel A the general protocol. They are activating the T cells with the peptide, phorbol ester, or a bunch of cytokines.
Panels Band C Nicotinamide only slows down production of INFγ in response to the peptide, but not the phorbol ester plus ionomycin Ca2+ ionophore. PMA activates protein kinase C. ionomycin pokes Ca2+ permeable holes in cell membranes. This is sort of a double whammy way of activating T cells. Panel D examined response to interleukins.
Panel E. Here Angliano and coauthors are comparing 10 mM nicotinamide (NAM) and the solution (vehicle) used to dissolve NAM. When glucose (gluc) is added the cell culture medium starts acidifying. Adding the ATP synthase inhibitor oligomysin (Olig.) does nothing. At 122 g per mole, an average human male with 5 liters of blood would have to consume about 6.1 g of nicotinamide to theoretically achieve this concentration.
Panel F The large extracellular concentrations of nicotinamide are increasing the intracellular concentrations of NAD+.
Panel G used only 1 mM NAD+. Consuming 0.6 g of NAD+ probably won’t happen either.
Panel H, FK866 is a highly specific noncompetitive inhibitor of nicotinamide phospho ribosyltransferase . The authors presented another narrative suggesting that the large doses of niotininamide were slowing the translation of cytokine transcripts via phospho-AMP kinase pathways involving mTOR. [3]
Figure 4 demonstrates that NAM down regulates mTORC1 independently of NAD+. [3] Figures 5 and 6 looked at the effect of NAM on human T effector cells. This post is not going to get into this part of the study.
Concluding thoughts
The Vardhana paper made the cause for CD8+ T cell exhaustion being tied to reactive oxygen species and proposed use of reduced thiol supplements like N-acetyl cysteine. [2] We’d like to point out that (1) copper is a cofactor for Cu/Zn superoxide dismutase and (2) niacin is a precursor for NADH/NADPH. NADPH, in particular, plays a role in keeping thiols reduced. The Agliano paper made the case niacin’s close relative nicotinamide, being a good treatment autoimmune diseases when CD8+ T cells become cytotoxic against self, i.e. autoimmunity. [3] This site is in not way making any claims to treat disease. That cuprous niacin could treat two opposite ends of immune dysregulation would be an audacious claim and perhaps a worthy hypothesis to test!
References
Li W, Cheng H, Li G, Zhang L. Mitochondrial Damage and the Road to Exhaustion. Cell Metab. 2020 Dec 1;32(6):905-907. free article
Vardhana, S. A., Hwee, M. A., Berisa, M., Wells, D. K., Yost, K. E., King, B., Smith, M., Herrera, P. S., Chang, H. Y., Satpathy, A. T., van den Brink, M., Cross, J. R., & Thompson, C. B. (2020). Impaired mitochondrial oxidative phosphorylation limits the self-renewal of T cells exposed to persistent antigen. Nature immunology, 21(9), 1022–1033. PMC free article
Agliano, Federica et al. “Nicotinamide breaks effector CD8 T cell responses by targeting mTOR signaling.†iScience vol. 25,3 103932. 15 Feb. 2022, free article
Collier JL, Weiss SA, Pauken KE, Sen DR, Sharpe AH. Not-so-opposite ends of the spectrum: CD8+ T cell dysfunction across chronic infection, cancer and autoimmunity. Nat Immunol. 2021 Jul;22(7):809-819. PMC free article
Why do the elderly get sick more than younger folks? Fight Aging has a good lay friendly piece on the mitochondrial aspects of T cell exhaustion. The following paper is cool enough to be published in the prestigious journal Cell. The authors found that hypoxia does something bad to the mitochondria that prevents them from producing cytokines needed to keep chronic virus infections contained. We’ve know for a long time that the real damage to cardiac mitochondria occurs when oxygen is restored. The mitochondria turn into superoxide generating machines. We might be done with the pandemic proper, but older folk are still getting Covid, the flu, and so on. Then there is the chicken pox/ shingles virus.
Schurich A, Pallett LJ, Jajbhay D, Wijngaarden J, Otano I, Gill US, Hansi N, Kennedy PT, Nastouli E, Gilson R, Frezza C, Henson SM, Maini MK. Distinct Metabolic Requirements of Exhausted and Functional Virus-Specific CD8 T Cells in the Same Host. Cell Rep. 2016 Aug 2;16(5):1243-1252. PMC free article
This publication asked the question of why we humans might have some chronic virus infections like cytomegalovirus that are usually well contained and generally harmless. Others, like hepatitis B virus, are far from harmless. The above publication compared CMV and HBV specific T cells from the same patients. The lay reader not particularly intersected in scientific experiments is encouraged to just glance at the images to take in the hard work that goes into understanding out our bodies work.
The graphical abstract of Schurich 2016 has been embellished to demonstrate the role of IL-12 in increasing transcription of interferon gamma.
The patients in this study had both CMV and HBV reactive T cells. Peripheral blood mononuclear cells (PBMC) were isolated from patients positive for HLA-A2+ , one of many variants of the MHC complex of T cell receptors. According to these authors, naïve T cells rely on mitochondrial oxidative phosphorylation of fatty acids. Activated T cells switch to glycolysis as a quicker source of energy even though it is less efficient.
The authors used fluorescent probe labeled peptides from HP,KLHLYSHPI, from Proimmune. As the affinity of isolated, soluble monomeric MHC-peptide complexes for their specific TCR is weak, and the interaction between the MHC-peptide and associated TCR has a half-life of approximately 10 seconds, multimerization is applied to enhance detection sensitivity. The detection sensitivity increases with the amount of MHC monomers complexed onto a multimer. For enhanced detection sensitivity, the Dextramer® technology holds an optimized number of MHC-peptides that enable efficient and sensitive detection of antigen-specific T cells. Read more about the sensitivity of the Dextramer® reagents here.
Figure 1. HBV specific CD8+ T Cells express more Glut 1
The authors are building their case that cytotoxic T cells that express the CD8 marker also express more Glut1 because they are more dependent on glycolysis. Virus specific dextramer was used to activate these T cells into cytokine production. The center histogram graph is perhaps the easiest to understand. The CMV specific CD8+ T cell population has a large number of members that just express a few Glut1 transporters on their cell membranes. The implication is that they are more reliant on fatty acid oxidation and OxPhos to meet their energy needs.
Comments on Schurich et al (2016) are in purple.
This post is skipping some of the data in Figure 1. Panel 1E asks the question of whether the Glut1 glucose transporters are actually operational. 2-NBDG is glucose with a fluorescent tag NBD. Not only are more Glut1 on the surface of HBV T cells, but they are also operational.
Not the almost non-overlapping of CMV and HBV histograms for 2-NMDG uptake in 1E.
The argument for a copper supplement is that the ATP yield from one molecule is 38 with a copper replete electron transport chain versus 2 ATP from glycolysis alone. The Schurich group has published an excellent review on T cell metabolic requirements in chronic infections. Cholesterol and fatty acid synthesis is needed for T cell proliferation. Fatty acid oxidation was given limited mention. For now we are left with the hypothesis that Glut1 is there because O2 is not available as an electron accept in the electron transport chain. We have to remember that glucose can also be a source of electrons for OxPos ATP production.
Niacin and the role of NADH/NAD+
Our programmed death receptor 1 PD-1 in Long Covid journey began in a previous post. A follow up post examined the role of PD-1 andTim-3 in chronic versus acute LCMV infections. These cell surface receptors shut down transcription of genes for fatty acid metabolism. Sometimes we need to remember niacin, the other two thirds of BioCu1/ Copper One.
This figure is not from Schurich (2016). It is added to illustrate the complexity of NAD+ and ADP/ATP signalling of energy status.
Figure 2. CD8+ T Cells may become hypoxic in the liver.
The next figure compares virus killing cytotoxic T cells from peripheral blood mononuclear populations (PBMC) to intrahepatic liquid (IHL). These cells were stimulated with the HBV dextramer. The low affinity binding (box) is really not that much different. The expression of the Glut1 passive glucose transporter is greater at p<0.05 level of confidence. The authors think that the hepatic environment may be hypoxic. If the liver is hypoxic, could the same situation exist in GI epithelial cells and the SARS-Cov2 virus?
The story continues with PBMC cultured under normoxic and hypoxic conditions. Regardless of the virus specificity, growth in hypoxic conditions increases the expression of Glut1.
This post makes use of a SeaHorse cartoon illustrating the strategy of gradually adding electron transport chain inhibitors and their use to calculate the spare and maximal respiratory capacity. The spare reserve capacity (SRC) is the maximum O2 consumption minus that which is coupled to ATP production.
Note that the PD-1+ T cells have some sort of electron transport chain defect between complex I and V.
Figure 3 HBV T cells, glycolysis, “immediate effector function”
Part of the reasoning behind these experiments was a previous study that Schurich and coauthors cited suggesting that galactose as a sugar source slows down glycolysis. It probably slows down oxidative phosphorylation (ATP production with reduction of oxygen to water. NADH is reduced to NAD+) and the ETC if fatty acid beta oxidation is not a choice.. If sugars are the only source of energy, there is still the additional step required. Glucose to glucose 6-phosphate is the first step in glycolysis. Galactokinase and Gal-1-P uridyltransferase are an additional two steps that slow down glycolysis, but still permit it.
The metabolic diagram in the lower right hand corner was added to the original Schurich figure 3A.
The boxed in areas on the right hand side of the 3A charts are CD8+ T cells that contain a large amount of IFNγ cytokine, presumably in secretory vesicles. Note that T cells that have receptors for CMV have a tendency to express large amounts of IFNγ whether or not the sugar in the growth medium is glucose or galactose. Panel 3B puts numbers to go with the flow plots. The same trend for greater TNF cytokine production is also seen for CMV vs HBV.
MitoTracker stains healthy and unhealthy mitochondria
The fluorescent dye MitoTracker stains mitochondria regardless of whether or not they have a resting membrane potential. In some pathologies postulated by the authors, mitochondria may become enlarged. The possibility of mitochondrial proliferation was not discussed but could potentially be detected in this assay.
In panel D we see a larger population of HBV specific T cells have more MitoTracker dye uptake. Is this pathology or simply a failed attempt to keep up with increased energy demands. When the T cells are activated with HBV dentomers, the difference is lost.
JC-1 measures membrane potential of healthy mitochondria.
The JC-1 mitochondrial membrane potential dye was used to look at functionality.
When the membrane potential is inside negative, JC-1 enters the healthy mitochondria and aggregates in such a way to yield red fluorescence. In HBV virus specific T cells, cells with 50/50 green/red fluorescence predominate, 63.2 %. In CMV specific cells.
Figure 4 IL-12 for exhausted T cells not producing IFNγ?
This post is skipping the work with IL-12. In so many ways Anna Schurich and fellow researches published an interesting study that raises more questions about what is going on in the mitochondria in T cells, or any cells, during hypoxia. Bumping up production of INFγ with IL-12 is interesting. That IL-12 also seems to increase the output of mitochondria is more interesting and leaves us searching for an explanation of why this is.
Why is the liver hypoxic and the many organs that CMV infects not hypoxic?
Is the liver always hypoxic or just when the metabolic load of a meal arrives via the portal vein or when the patient takes a drug that requires metabolism by cytochrome P450?
Could the real mitochondria damage occur when O2 is restored?
Cu(I)NA2 comes to the rescue
Marin W. et al. (2021) Mitochondria as a therapeutic target for cardiac ischemia‑reperfusion injury (Review) Int, J. Mol Med. 47: 485-499, 2021 PMC free article
The review summarizes several decades of research towards the understanding of how cardiac mitochondria become generators of superoxide when ischemia that results from a myocardio infarction is reversed too quickly by reoxygenation. Complex I becomes a generator of super oxide. The Marin review discusses therapeutic interventions to restore the NAD+ that is depleted in the ischemic heart. Nicotinamide riboside (NR) and nicotinamide mononucleotide (NMN) are the natural precursors of NAD+. Copper is only given brief mention in this review as a cofactor in Cu/Zn SOD 1 that removes the superoxide generated by the ischemia reperfusion injured cardiac mitochondria.
Conclusion
The pandemic might be in the rear view mirror for many, but the elderly are still coming down with Covid and many other viral infections that are less of a problem for the young. The lay reader is not expected to understand all of the experiments leading to T cell mitochondria as being the smoking gun for T cell exhaustion in viral infections. We think that the combination of niacin and copper might one day prove to be therapeutic.